
System Architecture, Equipment Requirements and China's Supply Chain
An answer on a screen often arrives within seconds. Text appears line by line, images emerge from descriptions, and programs execute instructions. The results of computation seem so weightless that the material world supporting them can easily recede from view: current passes through switchgear and power modules, heat crosses cold plates and heat exchangers, and data travels through copper cables and optical fiber. A transformation in intelligence is also rearranging the specifications, locations and responsibilities of this equipment.
Technological progress sometimes takes the form of shrinking dimensions. More transistors occupy a smaller area, more processors fit into a denser rack, and more tasks finish in less time. The industrial system accommodating that compression must nevertheless extend outward. As chips become more concentrated, power delivery and cooling must become more precise; as the number of computing units rises, the networks connecting them must become more reliable; and as equipment becomes more expensive, production, verification, maintenance and recovery from failure require more than a certificate of conformity for an individual product.
This change can already be identified item by item in public design documents. One Schneider Electric reference design for an AI data hall places 48 high-density AI racks, 48 networking racks, power infrastructure and two cooling paths on the same engineering diagram. Reading it draws attention from processors toward electrical cabinets, pumps, valves and couplings. The industrial categories behind these products are familiar, but the conditions under which they operate are changing.2
This is also where opportunities worth examining arise for Chinese manufacturing. Longstanding capabilities in power electronics, precision machining, fluid control, cable manufacturing and system integration are meeting the requirements of a new generation of computing facilities. The ability to make a similar product is only the starting point for participation; keeping that product operating under specified loads, temperatures and failure conditions moves a supplier closer to the substantial responsibility a customer is willing to entrust to it.
This report follows a reference data hall. It first explains the relationships among equipment, then examines procurement and business operations, and finally returns to the position Chinese companies have reached. It investigates a specific transmission mechanism: computing architectures establish requirements; system designs translate those requirements into equipment configurations; manufacturers meet them with verifiable products; and projects assemble those products into facilities capable of sustained operation. Only along this path can investment in computing capacity become orders that can be delivered, recognized as revenue and ultimately converted into cash.
Abstract
This report examines manufacturing requirements for AI data-hall power, cooling and data interconnects through analysis of a public reference design, recalculation of basic engineering relationships and comparison with corporate disclosures. Its baseline is Revision 13 of Schneider Electric's RD109DS reference-design PDF. Manufacturer specifications, design assumptions, company statements and our calculations are identified separately. We did not obtain a complete set of comparable procurement prices for the same project. We therefore present equipment and capacity ledgers, a cost-allocation method and a conditional electricity-cost example, rather than an actual procurement total for the entire data hall.
The research produces four principal findings. First, higher rack power density changes the spatial distribution of equipment, interface specifications and verification requirements; it cannot be equated directly with proportional growth in the quantities or procurement costs of all supporting equipment. Second, heat must be accounted for across the complete data hall. At the baseline's full design load and specified heat allocation, liquid removes 87% of the heat from AI racks; after networking racks are included, approximately 25.4% of IT heat still enters the air-cooling path. This is a recalculation of a reference scenario, not an industry average or an on-site measurement. Third, the level at which redundancy is configured materially affects equipment quantities: shareable capacity and necessary fault-isolation boundaries must be assessed together. Fourth, public evidence of Chinese companies' participation now spans product development, customer validation, volume delivery and system deployment. Evidence at these levels is not interchangeable, and individual companies' progress cannot establish market shares for the entire supply chain.
The report's central argument is that the additional manufacturing difficulty created by AI infrastructure is concentrated in the capacity accommodated per unit of space, matching between systems and responsibility for sustained delivery. Industrial progress with engineering significance should first be demonstrated through these verifiable capabilities, before revenue, profit and capital investment are discussed.
Keywords: AI data halls; power supply and distribution; cold-plate liquid cooling; data interconnects; equipment ledger; manufacturing supply chain
I. Begin with a Complete Data Hall
1. From racks to the facility
The ability to install computing equipment in racks and connect the racks to power does not mean that a data hall is ready for sustained operation. Equipment power requirements must enter the distribution design, thermal loads the cooling design, and data ports the network design; maintenance, standby provision and recovery paths must also connect across these designs. The object of study must therefore expand from an individual product to a system with defined boundaries.
This report uses Revision 13 of Schneider Electric's RD109DS as its reference. Prepared for US voltage and frequency conditions, it is a manufacturer's reference design, not a construction basis for a specific Chinese project or an average configuration for all AI data halls. We use it because IT load, rack configuration, power paths and cooling paths can be cross-checked within one document. The version is identified by the revision number in the downloaded PDF's footer. The official directory metadata and filename contain differing version information; all parameters here follow the Revision 13 file actually examined.2
Table 1 sets out the baseline used throughout the report. Design facts are consolidated here; additional assumptions are identified separately below.
| Item | Reference-design value or configuration | Status and location |
|---|---|---|
| IT design capacity | 7,392 kW | PDF pp. 1, 4 |
| AI racks | 48 racks at 132 kW each | PDF p. 4 |
| Networking racks | 48 racks at 22 kW each | PDF p. 4 |
| Share of AI-rack heat removed by liquid | 87% | Design condition on PDF p. 4 |
| IT power supply | Four 3 MW powertrains with 3+1 distributed redundancy | PDF p. 2 |
| IT uninterruptible power supply modules | Two 1,500 kW UPS units per powertrain | PDF p. 2 |
| Data-hall air-side terminal equipment | Six fan walls in an N+1 configuration | PDF p. 4 |
| CDUs | Three per pod across three pods, in an N+1 configuration | PDF p. 4 |
Source for Table 1: Schneider Electric, RD109DS, Revision 13, pp. 1–4. Capacities and proportions are design conditions, not measured results. The target availability tier does not establish that a completed project has been certified. UPS means uninterruptible power supply; CDU means coolant distribution unit. Specifications are used only as a research baseline and do not constitute product recommendations.
The design power of the two rack groups can be checked directly: 48 × 132 = 6,336 kW, and 48 × 22 = 1,056 kW, giving a total of 7,392 kW. This simple addition first corrects a readily overlooked bias: IT load also includes supporting computing equipment such as networking. Discussing total power and heat solely through AI-rack counts omits another continuously operating load.
The facility adds another layer beyond IT load. Power-distribution equipment has losses; pumps, fans and outdoor heat-rejection equipment consume electricity; and monitoring and other auxiliary systems also use energy. IT capacity describes the scale at which computing equipment is supplied, whereas facility input describes how much power the entire boundary must obtain externally. Their denominators differ.
2. Higher density first changes space and interfaces
A limited thought experiment illustrates the effect of density. Keep the AI design load at 6,336 kW and networking design load at 1,056 kW. At an assumed 66 kW per AI rack, 96 AI racks are required; at 132 kW, 48 are required. If the 48 networking racks remain unchanged, the two layouts contain 144 and 96 racks respectively—a reduction of one-third—while total IT design capacity remains 7,392 kW.
The 66 kW figure is a hypothetical comparison value, not another actual product configuration cited in this report. The experiment establishes only a quantity relationship: rack count can fall while the data hall's power-supply capacity remains unchanged. It does not establish equivalent computing performance, floor area, cost or reliability, nor imply that rack-level equipment can simply be halved in proportion to rack count.
As each rack accommodates more load, power must enter through more concentrated interfaces, heat must leave a smaller space, and maintenance space may also be constrained. Manufacturers may consequently need to move from “making more units” toward “making each unit carry more while remaining maintainable under defined conditions.” Some structural components decrease with rack count, some interfaces require higher specifications, and some facility capacities remain governed largely by total load. These changes can coexist within one project.
This is the report's starting point for examining manufacturing. Product quantity, performance per unit, integration and service responsibility must be studied separately and then connected through procurement boundaries. Multiplying rack density by a fixed “supporting-equipment value per rack” can easily mistake architectural change for market growth on a consistent basis.
3. Three paths and a timeline
Power enters through the facility supply and distribution system, reaches rack-level and board-level power supplies, and is ultimately consumed by computing equipment. Heat moves from components into cold plates or air and then, through circulation and heat exchange, outdoors. Data travels within equipment, within racks and between racks; topology determines how ports and links connect. These three paths use different media and equipment but meet within the same rack.
There is also a timeline that cannot be omitted. Design capacity is the capability prepared to accommodate load; actual load changes with equipment installation, task type and utilization; annual electricity use accumulates over a period of operation. The sum of all equipment nameplate ratings cannot be treated directly as the project's annual electricity consumption. Standby modules and redundant supplies may remain installed throughout the year without continuously delivering rated output.
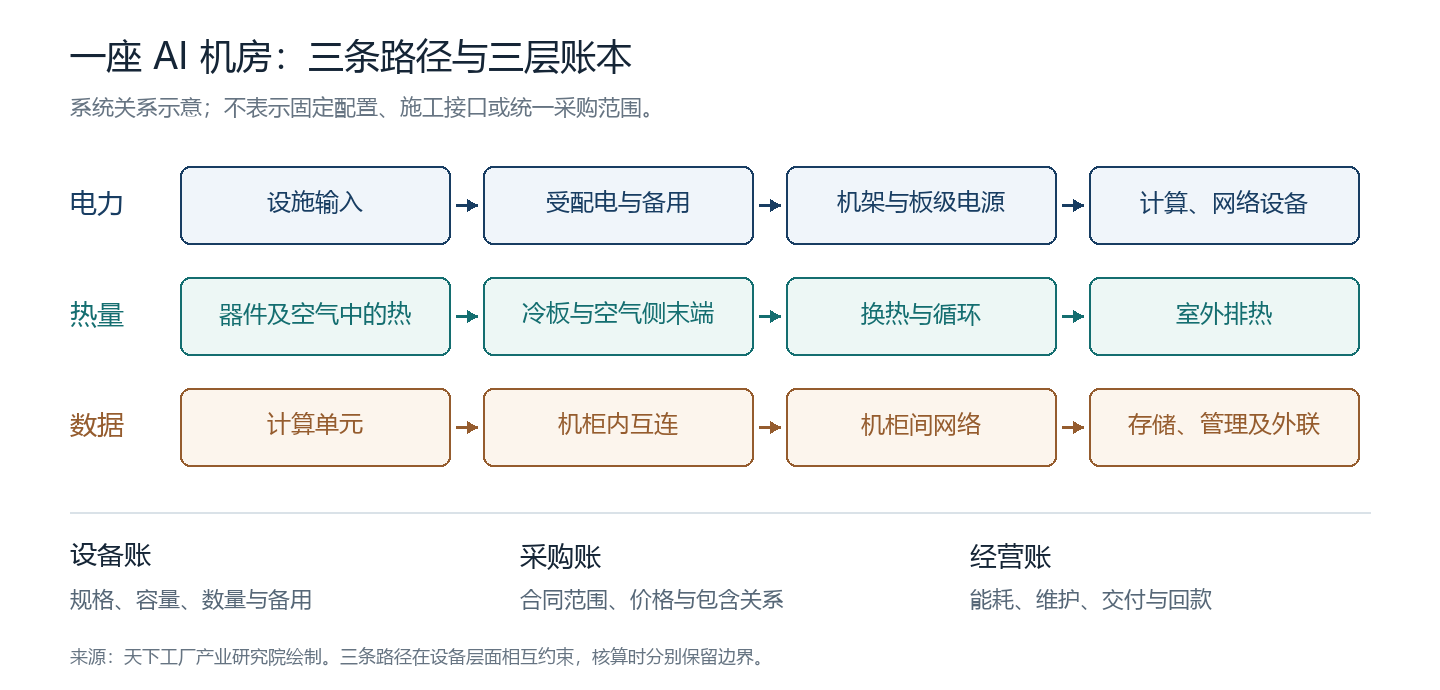
Figure 1: System-relationship schematic drawn by Tianxia Gongchang Research. The heat path summarizes processing stages. The data row identifies interconnect layers to be checked separately; it does not depict a real network as a one-way serial topology. The diagram prescribes neither fixed procurement packages nor construction interfaces.
The International Energy Agency's updated 2026 analysis estimates that global data-center electricity use rises from 485 TWh in 2025 to around 950 TWh in 2030. The latter is its central scenario, not demand already realized or a monetary denominator for China's AI supporting-equipment market.3 The macroeconomic scale explains why the subject deserves attention; specific industrial judgments must still return to the configuration and operation of individual systems.
II. Delivering Power to Where Computation Takes Place
1. From continuous power to maintainable power
The power system's first responsibility is continuous operation. Utility input must pass through appropriate transformation, distribution and protection before reaching racks. When a section is shut down, maintained or fails, the system must retain the supply capability required by the project. Projects make different choices in utility connection, standby generation, storage and distribution paths; no single architectural diagram is a universal configuration.
Redundancy adds equipment and changes its operating role. Under N+1, for example, N units meet the required load and an additional unit preserves service under the specified loss of one unit; 2N provides two full-capacity systems. Whether these arrangements achieve their intended effect also depends on switches, cables, controls and shared elements. Two sets of equipment with sufficient rated capacity may still fail together if they share a fault point that cannot be isolated.
Procurement analysis must therefore identify the level at which redundancy resides: facility powertrains, UPS modules, rack feeds or in-rack supplies. Multiplying reserve factors across every level can count capacity already included elsewhere; ignoring redundancy understates installed quantities and initial investment. A sound equipment ledger follows the actual circuit segment by segment and records each level's service scope and failure conditions.
For manufacturers, product value lies not only in rated capacity but also in compatibility with this maintenance arrangement. Protection coordination, how remaining modules share load after one exits, how fault information reaches monitoring, and whether maintenance is possible under agreed conditions may all affect acceptance of a model. Design documentation and test records are needed; a peak-efficiency curve alone cannot settle the assessment.
2. Voltage and current turn abstract requirements into copper and insulation
The most direct physical relationship is between power and current. In ideal DC supply, current equals power divided by voltage. To compare orders of magnitude only, assume 120 kW is transmitted continuously at the DC bus under discussion, with conversion losses ignored: 54 V corresponds to approximately 2,222 A, while 800 V corresponds to 150 A. The currents differ by about 14.8 times. Here, 54 V and 800 V are two independent comparison voltages; the example is not a direct retrofit proposal for an existing rack.
Current flowing through a resistive path produces heat loss. Higher current requires conductor cross-section, contact resistance, temperature rise and cooling conditions to be rematched. Busbars and connectors therefore translate computing demand into specific manufacturing questions: how materials and plating are selected, how contact areas are designed, whether contact forces remain stable, whether assembly tolerances can be maintained in volume production, and how contacts change after thermal cycling.
Higher voltage can ease current requirements at the same power while introducing new requirements for insulation, protection, isolation and maintenance. Interrupting DC fault currents, selecting device voltage ratings, arranging grounding and adapting personnel procedures cannot be answered by the power equation alone. Potential conductor reductions must be compared within the same procurement boundary against additional power-electronics, protection and verification investment.
The current ratio cannot establish an equivalent percentage reduction in total copper use, nor can an ideal circuit-loss ratio be treated as a project's electricity-saving rate. Actual path length, cable cross-section, conversion efficiency and reserve configuration change the result. The power equation supplies the design motivation; equipment lists and testing progressively establish its engineering implementation.
NVIDIA's public 2025 technical article on 800 VDC discusses higher distribution voltage and storage across multiple timescales, emphasizing ecosystem collaboration.4 By 2026, the Open Compute Project's low-voltage DC white paper and solid-state transformer design document supplied further common material for discussing voltage systems, interfaces and conversion equipment.56 These documents show a developing technical route; the extent of adoption in particular projects still requires individual verification.
3. Beyond sufficient capacity: changing loads
AI power requirements also have a time dimension. Processors may consume differently during computation, communication and other task phases; when many devices operate synchronously, their changes can aggregate at system level. Power equipment must handle sustained demand as well as changes over specified timescales.
Power Stabilization for AI Training Datacenters uses production telemetry, hardware and simulation to investigate power fluctuations in large-scale training and compares mitigation through software, GPU controls and rack storage.7 We use this research to illustrate that “load shape is also a design input,” not to generalize the fluctuation amplitude of a particular training case to every inference or enterprise data hall.
This distinction separates three storage responsibilities. Very short-duration power changes require equipment to absorb or release power rapidly; equipment transfers require support over a certain duration; longer standby duties concern available energy and sustained operation. Kilowatts, a power unit, and kilowatt-hours, an energy unit, are not interchangeable. A battery with large energy capacity may still be unsuited to a particular fast-response task if its power, control and interface capabilities are insufficient.
Supply-chain cooperation consequently extends into control and system verification. Battery, capacitor, power-converter and control-equipment manufacturers must explain the timescale their products address, where they connect, how they are controlled and how the system recovers after failure. Adopting one storage category does not automatically mean another category of standby infrastructure can be eliminated entirely.
Site constraints also shape procurement. Equipment space in an existing building, reuse of distribution paths, permitted downtime and connection approval timing all affect a technical route's economics. A more advanced architecture may not suit every retrofit at once; compatibility and transition within existing facilities may create separate requirements.
4. Conversion efficiency matters across the entire path
A power module's efficiency must be stated together with input, output, load fraction and environmental conditions. Peak efficiency describes one operating point; annual project losses depend on actual load and operating time. A generously sized, lightly loaded system may operate far from the best point shown in marketing materials.
For fixed output power, input equals output divided by efficiency; the difference is the loss within that boundary. Multistage conversion must be accounted for sequentially along the energy path. Reducing loss at one stage may lower cooling requirements; eliminating a stage may transfer conversion and protection duties elsewhere. Manufacturers' resulting order gains or losses depend on architectural reassignment, not total power alone.
Two schemes should be compared under consistent loads, operating periods, standby conditions and cost boundaries. If scheme A includes standby batteries while scheme B lists only rectifier modules, their price difference cannot directly establish the economic benefit of efficiency improvements. Even genuine electricity reductions require local tariffs, utilization, maintenance costs and incremental investment before savings can be assessed.
The industrial judgment on power therefore has distinct levels. Growing facility load creates capacity requirements; density and variability change specifications and controls; architectural shifts redistribute equipment roles. Whether a manufacturer benefits depends on successful verification and delivery in those new roles. Separating these levels helps explain why companies within the same AI power chain can produce different business results.
5. From an efficiency curve to volume products
Power-equipment manufacturing must ultimately preserve the design relationship between current and temperature rise in continuous production. Component and magnetic-component selection, conductor connections, insulation and mechanical fixing, cooling layouts and control parameters are interrelated. Experienced teams can tune a prototype item by item; volume products require critical conditions to become repeatable production requirements.
For the same connection structure, surface condition, assembly forces and changes after thermal cycling can affect actual temperature rise. A test recording only whether equipment powers on cannot explain these differences. Verification relevant to the intended application must record load, environment, input changes and protective actions, distinguishing design validation from routine production inspection.
Customer-validated configurations must also be maintained through product iteration. Replacing a component or material may improve purchasing cost while changing thermal, control or reliability behavior. Whether substitution is permissible and what tests must be repeated should follow engineering-change procedures and customer agreements. Supply-chain management thus connects with product design; procurement cannot resolve the assessment alone.
These tasks explain why power-supply capability cannot be captured simply by factory floor area or maximum power. Rapid prototype design, batch consistency and diagnosis at a customer's site require different organizational capabilities. Companies must connect them to move from project-based development toward sustained supply.
For Chinese companies with existing power-electronics capabilities, this extension has an intelligible route: identify new operating conditions within established processes, close the gaps through testing, and embed mature conditions in products and production procedures. Technology-transfer opportunities exist, and the engineering investment they require must enter operating budgets. The resulting product competitiveness may then extend beyond a single project cycle.
III. Heat Does Not Disappear When Computation Ends
1. From the chip surface to the outdoor environment
Heat must still leave the equipment after computation finishes. A cooling system transfers heat from temperature-constrained locations to the final environment while maintaining specified flow, pressure, cleanliness and maintainability. A cold plate is only one starting point along this path; heat-exchange and heat-rejection infrastructure outside the data hall also determine how much heat the system can continuously remove.
In single-phase cold-plate liquid cooling, liquid absorbs heat as it flows through cold plates, returns through piping to heat-exchange equipment, and recirculates. It remains liquid during the operation under discussion. A heat exchanger can transfer heat between the technology cooling loop and the facility-water loop while keeping their fluids separate. Different environments, materials and maintenance arrangements on the two sides make this separation a manageable engineering boundary.8
A higher permissible supply-liquid temperature may extend the time during which outdoor conditions can be used for heat rejection. This potential still depends on equipment temperature limits, heat-exchange temperature differences, climate and cooling-plant design. ASHRAE's white paper on liquid-cooling development connects component thermal requirements and supply-liquid conditions with facility heat rejection, drawing attention to the continuous path from component to facility.9
“Using liquid cooling” therefore cannot by itself establish the energy efficiency, water use or cost of an entire data hall. Cold plates can connect to different outdoor heat-rejection systems, and the same cooling technology can perform differently under different climates and operating conditions. Analysis must follow heat along the complete path rather than stop when liquid leaves the rack.
2. After 87%, what does the air side still carry?
The baseline provides a calculable example. Assume both rack groups reach the design loads in Table 1 and approximate IT input electricity as heat entering the respective cooling paths. Total AI-rack heat load is then 6,336 kW. At an 87% allocation, 5,512.32 kW enters the liquid path. The remaining AI-rack heat is 823.68 kW; adding the networking racks' 1,056 kW gives a total air-path load of 1,879.68 kW.
Table 2 expands this calculation. Conditions come from the reference design; results are not readings from on-site heat meters. Additional heat from facility pumps, fans and other equipment is not included in this IT heat-allocation table.
| Heat allocation | Calculation | Result at full design load |
|---|---|---|
| Total AI-rack heat | 48 × 132 | 6,336.00 kW |
| AI-rack liquid path | 6,336 × 87% | 5,512.32 kW |
| AI-rack air path | 6,336 × 13% | 823.68 kW |
| Networking-rack air path | 48 × 22 | 1,056.00 kW |
| Whole-data-hall IT air path | 823.68 + 1,056 | 1,879.68 kW |
| Air-path share of IT heat | 1,879.68 ÷ 7,392 | Approximately 25.4% |
Source for Table 2: Our calculations using the design conditions in Table 1. Detailed inputs and formulas appear in Tables 1 and 2 and the Methodological Appendix. Two decimal places are retained for recalculation; they do not imply corresponding precision in the heat load.
A data hall making extensive use of liquid cooling may still require substantial air-side cooling. This follows from the complete facility's load structure. It explains why the liquid-cooled share of AI-rack heat cannot simply be presented as the liquid-cooled share of the entire data hall, much less used to conclude that demand for air-side equipment has disappeared.
The changed denominator matters industrially. Cold plates, piping and CDUs handle concentrated heat sources, while air-side terminals handle the remaining equipment and associated space. The cooling methods for power supplies, storage and switching equipment also evolve with specific products. Changes in equipment demand should follow which heat sources enter which paths, rather than simply label “air cooling” and “liquid cooling” as growing or exiting categories.
For air-side manufacturers, emerging issues may include more dispersed load locations, coordination between cooling paths, and maintenance space affected by piping and electrical equipment. Liquid-cooling manufacturers cannot overlook the air side's contribution to operability merely because they remove most chip heat. Both paths ultimately require accounting and control within the same facility boundary.
3. How temperature differences change pumps, piping and heat exchangers
Single-phase steady-state heat transfer follows a basic relationship: thermal power equals mass flow rate multiplied by specific heat capacity and the supply-to-return temperature difference. For the same heat load, a smaller permitted temperature difference requires greater flow; higher flow in turn requires checks on pipe diameter, pressure drop, pump operating points and controls.
To illustrate this physical relationship only, take the liquid-path heat load of 5,512.32 kW in Table 2 and approximate the fluid as pure water, with a specific heat capacity of 4.18 kJ/kg·K and density of 1,000 kg per cubic meter. Leaving other conditions aside, temperature differences of 5°C, 10°C and 15°C correspond to pure-water-equivalent flows of approximately 15,825, 7,912 and 5,275 liters per minute, respectively.
These are conditional calculations, not substitutes for actual coolant properties, manufacturer-permitted temperature differences or piping selection. Fluids containing additives or other constituents have different properties and viscosities; actual pump energy also depends on pressure drop and efficiency, not flow alone. These temperature differences are not the approach temperature used in procurement documents, which describes the relationship between the supply-liquid temperatures on the two sides.
The comparison reveals a nonlinearity in equipment requirements. If server cooling requirements narrow the permissible temperature difference, higher flow may impose greater demands on pumps and piping. A heat exchanger transferring heat across a smaller temperature difference may require a new balance among structure, area and pressure drop. Reducing one item's cost can transfer a burden elsewhere in the system. Comparisons confined to cold-plate prices or CDU rated capacity can miss this transfer.
Manufacturers therefore face performance determined jointly by materials and geometry. Cold-plate channels, joining methods and contact interfaces affect heat transfer and resistance; pumps must maintain flow against system resistance; valves must balance control with local pressure loss; and filtration and cleanliness management influence long-term operation. Including these conditions in tests makes “how many kilowatts it supports” a comparable specification.
4. What reliability are additional units buying?
Another cooling variable worth calculating separately is where redundancy sits. Assume the Table 2 liquid heat load is divided equally among three pods. Further assume each CDU can handle 750 kW at the target operating conditions and that capacities can be combined in this way. N+1 in each pod requires three units of working capacity plus one spare per pod, or 12 units in total. A single shared pool at aggregate capacity requires eight working units plus one spare under the same algorithm, or 9 units.
The 750 kW module is our assumption, not the CDU model or rating used in RD109. The comparison between 12 and 9 also establishes only a counting method: round up and add standby units. It does not demonstrate equivalent piping, isolation capability, control complexity, failure impact or maintainability.
This limitation illustrates the completeness an industrial judgment requires. Shared capacity may reduce repeated redundancy; pod isolation may contain failures; and additional piping may increase installation and maintenance requirements. The reliability a customer purchases must be defined through specific failure scenarios. Treating redundant units solely as inefficient investment to remove loses sight of the design problem, while adding units without examining shared elements also fails to establish reliability.
The meaning of modularity becomes clearer for manufacturers: products must be easy to combine, but also provide consistent interfaces, defined performance, traceable status and executable maintenance arrangements. Only together do these conditions allow standard products to be reused across projects of different sizes and potentially shorten system verification and delivery cycles.
5. A coupling carries trust in the whole system
As computing equipment becomes more valuable, the responsibility borne by liquid connections changes. They must remain sealed under specified conditions while meeting flow, mating-cycle, material-compatibility and maintenance requirements. The system's ability to detect leakage—and isolate or stop affected equipment afterward—must also be defined in advance. Leak monitoring is the information entry point; subsequent actions and recovery conditions complete the response.
The Open Compute Project's cold-plate liquid-cooling requirements document addresses quick disconnects, pumps, materials, sensors and leak intervention as system issues.8 Suppliers must consequently retain increasingly specific evidence: test conditions, batches, material changes, life and failure records may all enter customer assessments. Passing a dimensional interface check is a different level of proof from completing system verification across all operating conditions.
Progress most easily overlooked often occurs here. Machining a metal part is common; maintaining consistency through continuous production, tracing changes to delivered batches, and feeding site problems into the next design iteration require longer accumulation. Stable data-hall operation turns that accumulated experience into capabilities customers can test.
This also gives smaller manufacturers a more specific point of entry. Participation in a new industry need not begin with producing an entire data hall; it can start with a component within an existing specialty. Its operating conditions and responsibilities must, however, be reassessed. General-purpose pumps and valves, ordinary couplings or conventional machining can provide a foundation, but not replace validation for the intended application.
Cooling's industrial value develops through this connection from materials and processing to system responsibility. Equipment specifications become engineering capability only when heat actually leaves the data hall and agreed service can be maintained during maintenance and failure conditions.
6. A boundary between design validation and production inspection
The OCP single-phase direct-to-chip cold-plate test specification published in 2026 covers leakage and pressure, thermal and flow behavior, mechanical performance, environmental reliability and cleanliness. It explicitly addresses design and prototype qualification, while production sampling, in-line screening and factory acceptance lie outside the same scope.24 This distinction matters industrially: a design passing tests still needs production controls to preserve the relevant conditions in subsequent batches.
Cold-plate manufacture can involve forming, machining, joining, cleaning and inspection. Different designs use different process routes; this report does not presume any one method necessarily superior. What must be examined is whether internal channels, sealing boundaries and contact surfaces meet target conditions after these operations, and whether inspection can detect problems affecting use.
Cleanliness particularly connects factory and site. Foreign matter left in channels or piping can circulate elsewhere, and site installation can introduce further contamination. Checking appearance before delivery alone cannot cover the entire loop. Component handling, packaging, transport, installation and pre-commissioning preparation therefore need connected records. Dividing responsibility only at equipment boundaries, without defining handover condition, can cause problems to be passed repeatedly among suppliers.
Tests must also be comparable. Two products claiming the same cooling capacity are not automatically comparable if tested with different fluids, supply temperatures, flows or pressure drops. Conditions agreed by customers and suppliers shift discussion from adjectives to parameters; stating measurement uncertainty and locations also helps prevent differences in instruments or methods from being mistaken for product differences.
Separating design validation from production inspection also helps control cost. Repeating every life test on every product is impractical, while critical production processes require inspections appropriate to their risks. Deriving production controls from design failure modes is an engineering method manufacturers must establish. Public test documents provide a common language, but companies must still implement it in ways appropriate to their own processes and customer conditions.
In manufacturing, measuring a product's performance is already a step beyond appearance inspection; consistently meeting the same conditions across batches is another. The distance from a single sample to continuous production determines when a technological achievement becomes supply capability. AI data halls' reliability demands make that distance more visible and give companies that complete this work carefully a clearer basis for evaluation.
IV. Turning Computing Units into a Computing System
1. Interconnect layers define product boundaries
Processors within a rack exchange data, multiple racks coordinate, and storage and management also require networks. Different paths have different bandwidth, distance, latency and maintainability requirements. They may use different technologies or share some space and power conditions; materials analysis must first distinguish the layers.
NVIDIA's rack-system networking documentation distinguishes in-rack NVLink, inter-rack compute networking, and storage, management and external connections.10 We use it as an example of one specific system, not evidence that every manufacturer uses the same topology. Within a project, identify the layer at which a connection occurs before discussing requirements for connectors, cables, modules and switches.
A single link can also contain several products. Pluggable optical modules, fiber patch cords, adapters and distribution infrastructure perform conversion, transmission and connection, while high-speed copper assemblies may deliver connectors and cable together. Active cables include signal-processing components and cannot be price-compared with passive copper solely by length. Adding internal harness sales to the procurement price of a complete system that already includes them also double-counts value.
The connector and optical-module industries should therefore not be combined here into an unbounded “connectivity market.” This report examines how defined topologies create requirements. Chip, switch and module values are recorded only at their respective procurement levels, not used to construct an aggregate interconnect market for the entire data hall.
2. Calculate links from ports rather than applying a multiplier
To explain the method, consider a hypothetical network independent of RD109. Hosts have 512 network ports in total; each leaf switch has 32 downlink and 32 uplink ports; each spine switch uses 32 ports; and leaf and spine switches are fully interconnected as assumed in this example. The network requires 16 leaf switches and 16 spine switches, with 512 host-to-leaf links and 512 leaf-to-spine links.
The two levels therefore contain 1,024 point-to-point links. If every link uses one separate optical module at each end, 2,048 optical modules are required. This result applies only to the stated arrangement and excludes storage and management networks and spares. Copper cables, active optical cables, breakout connections or different switch-port arrangements require quantities and allocation to be recalculated.
| Object in the hypothetical network | Quantity | Calculation |
|---|---|---|
| Host ports | 512 | Assumed input |
| Leaf switches | 16 | 512 ÷ 32 |
| Host-to-leaf links | 512 | One link per host port |
| Leaf-to-spine links | 512 | 16 × 32 |
| Spine switches | 16 | 512 ÷ 32 populated ports |
| Total links across both levels | 1,024 | 512 + 512 |
| Separate optical modules at both ends of every link | 2,048 | 1,024 × 2 |
Source for Table 3: Our independent assumptions and calculations, not a network bill of materials for RD109, DGX or any actual project. Port speed, protocol, congestion performance and actual service capability are not established by this counting example.
GPU count cannot substitute directly for a connection schedule. The number of equipment network ports, switch hierarchy, uplink-to-downlink ratio and link length all change cable and module requirements. Equal numbers of computing devices can require different material quantities under different topologies; equal material quantities can also cost differently at different speeds.
Recording ports, links and optical modules separately also clarifies pricing boundaries. Purchasing a complete active optical cable should not trigger separate pricing for two pluggable modules; breakout cables also invalidate the assumption that every externally visible cable has only two identical endpoints. As configurations approach higher density and bandwidth, precise interface definitions increasingly determine whether the ledger holds together.
3. High-speed connections impose new conditions on manufacturing precision
Electric current and data both pass through metal conductors, but their concerns are not identical. Power connections focus on carrying capacity, loss and protection; high-speed signal connections must also address impedance, reflections, loss and crosstalk. In actual products, these properties relate to terminals, insulation, cable structure, shielding and assembly condition. TE's technical introduction to 224G Ethernet solutions likewise identifies impedance optimization, return loss and crosstalk as design factors.11
Distance is one important variable in choosing copper or optical connections. Distance, speed, power consumption, signal processing and maintenance jointly determine selection; neither route can be described as an unconditional replacement for the other. Optical connections also have manufacturing and site requirements. End-face contamination affects transmission and link behavior, and Corning's technical material connects connector cleanliness with optical performance.12 A component conforming at shipment must preserve its performance conditions through installation and maintenance.
Interconnect manufacturing capability therefore extends beyond materials and processing into testing. Individual dimensions, complete-link performance and batch consistency must connect. A higher nominal rate establishes a changed product target; customer validation and stable volume supply still need separate evidence.
Zhaolong Interconnect's 2026 interim report states that single-lane 112 Gb/s high-speed cables were in stable volume supply, 224 Gb/s products in small-batch delivery, and 1.6 Tb/s high-speed assemblies progressing through customer validation.13 These statements distinguish the stages of different product generations within one company. They cannot all be counted as volume-production revenue at the same maturity level.
For research, this differentiated progress is more informative than a general claim of “mastering advanced technology.” It lets observers continue checking validation, delivery and business results, while giving accumulated manufacturing experience a specific scale of measurement. High-speed interconnect progress must ultimately materialize in a cable that can be measured, assembled and used continuously.
V. How Chinese Manufacturing Capabilities Enter New Data Halls
1. Taking on new responsibilities through existing specialties
Power, cooling and interconnects span multiple manufacturing categories. Their materials, processes and production organizations have distinct histories; new data halls bring these capabilities into closer collaboration. One company may specialize in power conversion, another in heat exchange, and a third in high-speed cables. Within one project, their interfaces and responsibilities must connect.
There is more than one route into this work. System companies extending into components gain design control but must invest more in processes and quality. Component companies participating upstream in system design understand customer requirements earlier but need additional application-engineering and verification capabilities. Each route has costs; competitiveness cannot be judged only by the completeness of a product range.
What deserves identification is how the company's responsibility changes. When supplying to drawings, the customer largely defines technical boundaries; in joint design, the supplier must explain how its parameters affect other equipment; in delivery, it must coordinate factory tests, transport, site installation and failure recovery. As responsibility moves closer to the system, evidence generally becomes more application-specific.
Manufacturers may therefore incur costs before earning volume revenue. Test stands, application engineers, samples, customer audits and product iterations all require investment. Whether validation cycles shorten, a platform can be reused and site problems decline affects how later orders absorb that investment. Industrial opportunity and commercial returns are separated by real engineering work.
2. Power-supply case: from development to sustained delivery
Megmeet's 2026 interim report states that its customized data-center and server power projects began moving from development to delivery in the second half of 2025, with sustained AIDC-related volume delivery beginning in the first quarter of 2026. It also describes participation in relevant platform-power and high-voltage DC development.14 These formal company disclosures support an assessment of participation stage; they do not allow separately undisclosed revenue from an individual customer to be extracted.
The case matters because of the sequence. A requirement does not immediately become recognizable revenue. Technical schemes, customer interfaces, sample validation, production preparation and sustained supply must connect progressively. Continued customer acceptance of products with the same specifications indicates progress beyond some development stages; stable profitability still requires observation of prices, costs, quality and expenses.
Other power manufacturers need application-specific analysis of experience transfer. Knowledge of conversion, magnetic components, control and cooling may provide a base, but rack supplies, high-voltage DC equipment and different terminal supplies do not share identical operating conditions. Transferable technology, elements requiring revalidation and new production equipment for a new architecture should be assessed separately.
Product platforms may reduce repeated development. If a common core design serves multiple customer categories, development investment can be spread across more orders. If every project is highly customized, growing revenue may be accompanied by proportional increases in application-engineering and maintenance input. Evaluating growth quality requires attention to reuse, not simply counting new product models.
3. Thermal-management case: connecting components, testing and delivery
Envicool's 2026 interim report lists products from cold plates, quick disconnects and manifolds to CDUs and cooling plants, alongside related testing equipment. It also states that particular cold plates, quick disconnects, manifolds and rack-mounted CDUs passed testing and validation for the relevant Intel platform.15 Product scope and validation status are limited to the objects described; they cannot be extended to every model or customer application.
The case shows how matching products becomes a corporate capability in its own right. Cold-plate pressure drop affects the loop, the loop affects pump operating points, and fluid and materials affect long-term operation. Conforming individual items still require proof that their combination meets requirements. Testing equipment and delivery procedures help connect single-product performance with whole-system operation.
For component suppliers, fuller customer documentation requirements are more than additional paperwork. Test conditions and batch records make anomalies traceable; material-change management prevents subsequent products from silently diverging from validated configurations; and site feedback helps distinguish design, manufacturing and installation issues. Documentation quality ultimately affects fault diagnosis and the technical trust customers are willing to extend.
Inspection and testing investment has long-term significance in these products. Output can change relatively quickly through additional shifts, but reliability evidence from continuous operation takes time. Manufacturers converting each validation and site experience into reusable design rules can reduce rediscovery in the next iteration. Industrial progress should also be assessed through this accumulation, which is less visible in photographs of finished products.
4. System case: bringing a new power route to the site
On 2 November 2026, Envision announced in a company release that its integrated 800 VDC system was supporting live computing workloads at its Galaxy campus in Ulanqab, connecting 10 kV AC input, solid-state transformers, storage and DC distribution.16 We record this as company-announced deployment progress. The release does not supply sufficient independent long-term operating data; we do not adopt the comparative claim “world's first” or derive a savings percentage against conventional systems.
The progress remains worth recording: technical discussion can now be tied to a deployment claim at a specific facility, allowing subsequent tracking of load, efficiency, availability, protection and maintenance. Bringing a new voltage level into operation requires coordinated equipment and controls; operating results and replicability ultimately establish its value.
Chinese companies' participation in this system exploration shows an expanding role for manufacturing capabilities. It includes producing to known specifications as well as organizing existing power-electronics, storage and control expertise into new system schemes. Commissioning, verification and revision are part of engineering maturation. The time they take does not invalidate progress, and deployment does not remove the need for further examination.
Here pride has a concrete foundation: domestic companies are taking responsibility for specific products, interfaces and systems and presenting development and deployment progress that outsiders can track. These tasks add substance to Chinese manufacturing item by item. Maintaining demanding standards for long-term performance and valuing achievements already made are two necessary aspects of the same research effort.
5. What evidence is still needed to move from cases to industry?
These cases concern power development and delivery, thermal products and platform validation, successive generations of high-speed interconnects, and on-site facility-power deployment. Together they show Chinese companies participating in multiple supporting stages of new computing infrastructure; they do not establish comprehensive replacement across the entire chain.
Research must preserve six distinct states: offering a product, completing specified tests, obtaining customer qualification, securing a definite purchase, delivering, and recognizing revenue and collecting payment. One company can occupy different states across products, and a product's status may apply only to a particular customer platform. Recording these states over time turns news into industrial monitoring.
Company databases provide an entry point for identifying cases. Keyword searches locate relevant entities, while product information, certifications and disclosures narrow the field. But a registered business scope containing “power supplies,” “liquid cooling” or “connectors” does not establish suitability for the architectures discussed here; headquarters location is not necessarily the relevant production-line location. Cases not checked at product and production-stage level are not used to calculate industrial-cluster shares.
We therefore use a capability matrix rather than a “beneficiary ranking.” Each case records what is supplied, how far evidence extends and what remains to be checked. Blank cells do not deny capability; they indicate missing material in this public-source study. These boundaries allow updating with later evidence and prevent marketing material from becoming an industry ranking directly.
| Object examined | Participation level verified in this study | Conclusions that still cannot be drawn |
|---|---|---|
| Megmeet's relevant power business | Company disclosure of development advancing toward sustained volume delivery | Revenue from one platform, actual share and profitability of all products |
| Envicool's relevant liquid-cooling products | Disclosed product coverage and specific-platform validation | Reliability of every model in every project |
| Zhaolong Interconnect's high-speed business | Different-rate products at different delivery or validation stages | Full volume production of next-generation products |
| Envision's announced 800 VDC project | Company-announced deployment under live load | Independently verified long-term efficiency, overall cost advantage or global ranking |
Source for Table 4: References [13]–[16]. Disclosure identity and cutoff date are retained for every status. Companies are research cases, not an industry-wide sample, and are not used to estimate market shares.
These cases make “Chinese manufacturing participation in AI infrastructure” more specific. Progress can be located in design, testing, production, delivery or operation, with a defined object for the next verification step. Industrial research should make those advances accurately visible while keeping unfinished work equally clear.
6. Smaller companies need entry points grounded in process capabilities
Large computing facilities divide requirements among many processes. Metalworking companies may participate in a cold-plate or structural-component operation, cable makers through materials and assembly, and fluid-equipment suppliers through pumps, valves or piping under specified conditions. Entry depends on actual products and customer requirements, not an industry label alone.
Finding an entry point begins by translating customer requirements into questions the company's processes can answer. Which equipment and operations guarantee dimensions and consistency? Are materials traceable? How must performance be measured? Does lead time include subcontracting and validation? Can anomalies be diagnosed? These questions identify adjacent capabilities and expose necessary new investment.
Cooperation with a system company can reduce the need to understand the entire data hall, but it does not remove component responsibility. Upstream suppliers need clear delivery boundaries, inspection conditions and change requirements; system companies must convey final operating conditions to the relevant stages. Passing only a compressed purchase price upstream, without complete specifications and handover standards, may pair low cost with greater integration risk.
Industrial clusters' role can be understood organizationally. Adjacent capabilities in materials, machining, surface treatment, testing and logistics within a region may ease collaboration and iteration. This possibility must still be verified through actual companies, lines and projects; company count cannot be equated with advanced supply capability. Lacking a complete sample, this report does not rank regions.
Local industrial services can be more targeted by identifying missing links: companies can machine products but lack shared testing conditions; have products but are unfamiliar with customer documentation; or have entered a supply chain but face delivery and financing constraints. Supporting real gaps is closer to capability formation than gathering every related manufacturing category under a fashionable label.
Companies must also accept that entry has a sequence. They can first establish sound processes, testing and delivery for one component, then extend with customer demand, rather than assume unfamiliar system responsibility prematurely to display a complete product range. Sustainable manufacturing expansion generally needs support from capabilities already verified.
VI. Putting Equipment Relationships into the Procurement Ledger
1. A product belongs to one transaction level in each ledger
Data-hall construction involves many transaction levels. An owner may purchase a complete computing system or tender some facility equipment separately; system companies buy from equipment companies, which buy from component suppliers. Each level generates genuine revenue, but those revenues cannot simply be added to the owner's total investment.
Suppose an owner buys servers including power supplies and cold plates, and the server manufacturer pays suppliers for those items. The owner's procurement amount already includes their value. Adding component-company revenue to the server amount counts the same value again. If the research question instead concerns domestic component-company revenue, downstream purchasing can be studied, but that measure cannot continue to be called owner expenditure.
Similar boundaries exist between facilities and IT. In-rack cold plates may arrive with complete systems, external CDUs may be bought separately, and racks and distribution components may be bundled under different contracts. Researchers need contractual deliverables, not just equipment locations. Two physically adjacent products may have different suppliers; equipment delivered as a contractual package must not be disaggregated and then added back to the package total.
For consistency, we separate owner procurement from manufacturing supply. The owner level records tax-inclusive or tax-exclusive treatment and installation boundaries for actual or assumed packages. The supply level records equipment and component roles without adding them again to the owner's total. An item is incremental only after confirming that the original package excludes it.
| Object examined | Treatment in the owner's procurement ledger | Treatment in manufacturing analysis |
|---|---|---|
| Complete computing systems, in-rack power supplies and cold plates | Determine from the contract whether already included as a package | Analyze supply relationships without adding owner expenditure twice |
| Facility distribution, UPS and standby systems | Record the actual package and standby scope | Examine specifications, manufacturing and delivery responsibility |
| CDUs, piping and outdoor heat rejection | Check inclusion of equipment, installation, fluid and controls | Distinguish system, equipment and component supply |
| Data cables, optical modules and switches | Count according to topology and contractual deliverables | Avoid double-counting assemblies and internal components |
| Integration, installation, commissioning and spares | List separately or state that they are included | Do not treat service revenue as a pure equipment unit price |
Table 5 is our accounting framework and contains no actual project quotations. Procurement scope follows contracts and formal schedules.
2. How many assumptions underpin a “cost per kilowatt”?
Cost per unit of IT capacity can aid comparison, but numerator and denominator must both be clear. Whether the numerator covers facility support, computing equipment or both—and whether it includes land, construction, tax, installation, standby equipment and services—changes the result. The denominator may likewise be design capacity, installed capacity or average utilized load.
The same project's accumulated investment may be similar early in construction and later in operation, while utilized capacity differs. Cost per installed unit declines as equipment is populated; that decline cannot be attributed entirely to falling equipment prices. Similarly, a new data hall using existing shared infrastructure should not be compared directly with the full investment required for a greenfield facility.
Specification differences in quotations matter equally. Identical rated capacity may involve different redundancy, materials, monitoring, tests and warranty scope. Dividing money by kilowatts compresses those differences into one figure. Comparisons over time must also check product generations, materials and exchange rates. Without comparable specifications, there is no rigorous unit-price series.
Public material obtained for this report supports configuration and capacity ledgers but cannot reconstruct prices within a complete contractual boundary for the same project at the same date. We therefore do not report “what this data hall costs” or precise system shares of total investment. The equipment ledger preserves reference-design facts; the monetary ledger is developed only through conditional calculations with explicit inputs.
This restriction is methodologically necessary. Public markets contain equipment list prices, channel quotations, budgets, framework ceilings and awarded amounts; these record different transaction states. A framework's maximum is not its final execution, and an award including installation and spares is not directly another model's factory equipment price. Assembling such figures into a complete total creates artificial accounting neatness.
A genuinely comparable procurement ledger retains the scope, specification, quantity, unit, date and price conditions for every line. A line without price evidence can remain blank; a seemingly reasonable figure from a neighboring product cannot fill it. When comparable quotations become available, this equipment ledger can remain in use while monetary entries are completed within the same boundaries.
3. Begin the economic analysis with a reproducible electricity calculation
Equipment selection also requires operating expenditure. Power usage effectiveness, or PUE, relates total data-center energy to IT energy over the same period. ISO/IEC 30134-2:2026 is the second edition of the relevant standard; its public catalogue describes coverage of measurement, calculation, reporting and interpretation. Projects still need measurement within applicable boundaries.17 US Department of Energy material likewise explains PUE as annual facility energy divided by annual IT energy.18
The following assumptions are independent of the reference design's listed PUE and do not treat it as an actual operating value. With IT design capacity of 7,392 kW, an annual average IT load of 70% of design and 8,760 hours, annual IT electricity use is approximately 45.3277 million kWh. If PUE falls from 1.30 to 1.20 over the same period while IT electricity remains unchanged, facility use falls by approximately 4.5328 million kWh annually.
At a uniform assumed tariff of RMB 0.60/kWh, the annual electricity-cost difference is approximately RMB 2.72 million. This illustrates the economic order of magnitude of an efficiency change, not actual project savings or contractual returns. Tariffs, load, equipment condition and climate change actual outcomes; other billing items such as demand charges are excluded.
| Assumption or result | Conditional example |
|---|---|
| IT design capacity | 7,392 kW |
| Annual average IT load fraction | 70% |
| Annual operating hours | 8,760 hours |
| Annual IT electricity use | Approximately 45.3277 million kWh |
| PUE comparison | 1.30 and 1.20 |
| Annual facility electricity difference | Approximately 4.5328 million kWh |
| Uniform assumed tariff | RMB 0.60/kWh |
| Annual electricity-cost difference | Approximately RMB 2.72 million |
Source for Table 6: Our assumptions and recalculation. Monetary amounts are rounded to indicate magnitude and exclude additional maintenance, financing, retrofit downtime and equipment-replacement costs.
PUE already reflects additional facility energy within the boundary under discussion. Adding the electricity benefit of the same distribution or cooling improvement again may double-count savings. A retrofit analysis should use a top-down facility-energy comparison or a bottom-up equipment-loss comparison and check their relationship, not add the two results unconditionally.
PUE also does not measure task-level computing efficiency. A data hall may reduce auxiliary energy while still producing disappointing useful output per unit if tasks are poorly configured. Power, cooling and computing-equipment efficiency must be observed separately and then assessed against a common business objective.
4. Procurement decisions require lifecycle conditions
A higher purchase price may reflect better performance, testing, spares or service—or merely brand and channel factors. A lower price may bring later maintenance costs. Economic assessment requires purchase, operation, maintenance and replacement arrangements over a defined period while retaining reliability requirements. Without reasonable operating assumptions, simple payback can easily become the result of a single parameter.
Owners need specific answers: how much load a retrofit permits, equipment consumption at actual operating points, standby behavior, personnel and spares required for maintenance, how much equipment a fault affects, and recovery steps. Manufacturers must determine which performance customers will pay for and what it costs their own businesses to provide it.
These economic ledgers do not automatically align. Greater system efficiency may reduce some equipment requirements and lower an owner's long-term expenditure while demanding more supplier development and verification. A product's higher technical standing does not necessarily produce a higher gross margin. Understanding industrial value allocation requires further examination of competition, pricing, procurement and delivery responsibility.
Only then does the “ledger” move from an equipment schedule to business analysis. Capacity describes how much must be accommodated, configuration how it is accommodated, price what the contract pays, and operation the recurring cost. The layers connect, but each retains evidence boundaries that cannot be crossed.
VII. How Orders Become Revenue, Then Cash
1. Growth passes through specific milestones
Computing-capacity plans first provide demand signals. Site and power preparation, finalized design, product validation, tendering and procurement, manufacturing and transport, and site commissioning and acceptance follow. Revenue and collections arise according to contracts, accounting policies and performance conditions. No earlier milestone can be treated as proof that a later one is complete.
These timing gaps deserve particular attention in new architectures. Products must adapt to new interfaces, projects wait for other equipment, sites may be built in phases, and customers may change configurations. A delay at one stage can shift delivery across the chain. Announced project capacity is therefore only an entry point for tracking progress, not a figure to multiply directly by unit value to derive a supplier's revenue for the year.
Development projects must also be distinguished from commercial orders. A customer expressing requirements, accepting samples or performing validation establishes a cooperation stage; fixed quantities, delivery dates and payment terms require separate evidence. Platform recommendations or product qualifications can improve entry into procurement consideration but do not automatically replace project engineering and contracts.
NVIDIA's DSX Ready program, announced in September 2026, initially covered battery storage and CDUs and explicitly stated that qualification does not replace site-level engineering judgments.19 Such programs make validation requirements more identifiable for manufacturers while underscoring that product qualification, project fit and final acceptance remain separate stages.
2. A case in which order growth and revenue follow different rhythms
Shenling Environmental Systems' September 2026 investor-relations record discusses approximately RMB 1.8 billion of new effective liquid-cooling-related orders in the first half. The company explains that these include advance-payment orders and major-customer orders payable after receipt. It also attributes increased goods dispatched mainly to data-computing services, with revenue conversion still dependent on project progress and acceptance.20
The same demand growth can thus appear successively in orders, inventory, goods dispatched and revenue. Watching only orders may overlook funds tied up in production and delivery; watching only one period's revenue may miss supplies not yet meeting recognition conditions. Public research must place these accounts and disclosures on the same timeline.
Equipment manufacture commonly incurs materials, labor and production costs first, and acceptance may remain incomplete after shipment. Later customer payment terms then require the supplier to finance a period of cash commitment. Expanding production requires working capital as well as buildings and machinery. Obtaining more orders and delivering them at reasonable cost are successive but distinct problems.
For component companies, customer concentration and contractual level also affect bargaining and payment arrangements. Changes in end projects may pass upstream through system and equipment companies. Researchers should verify actual purchasers and contracts rather than infer identical credit terms or payment cycles from the end customer's industry alone.
3. Revenue growth does not mean simultaneous profit growth
Shenzhen Honor Electronic's 2026 interim report summary records first-half revenue of approximately RMB 2.509 billion, up 18.32% year on year, and net profit attributable to listed-company shareholders of approximately RMB 8.0853 million, down 93.95%.21 Its contemporaneous investor-relations record discusses product-mix optimization as well as competition, raw materials, exchange rates and expenses affecting performance.22
These are consolidated company figures; the overall profit change cannot all be attributed to AI power supplies. The case supports a narrower and more useful conclusion: even where demand attracts attention, company revenue, gross profit, expenses and net profit can move differently. Growth-quality analysis must examine actual business mix and costs.
Validation, development and capacity preparation may precede a new product's introduction. Materials and quality costs can change as deliveries expand, while larger customers may negotiate prices. Companies must continuously monitor unit contribution, line utilization, yield, after-sales requirements and cash commitment rather than equate higher output alone with improved operations.
Industrial research should also avoid turning technical position directly into a profit conclusion. A component's system importance may bring stricter validation, while retained pricing power depends on alternative supply, standardization, customer concentration and differentiation. Technical importance, supply scarcity and commercial returns connect but are not substitutes.
4. Sustained delivery turns capability into an asset
In high-value facilities, buyers need suppliers to deliver products of consistent quality and take responsibility for later changes. One successful sample can start cooperation; consistency across batches, fault handling and next-generation follow-through progressively establish long-term trust.
Some of these capabilities are visible in equipment and headcount; others reside in processes: how parameters are frozen, who approves material substitutions, how problems are traced, how site modifications return to drawings, and how the next batch avoids repeated anomalies. They affect customers' switching costs and whether companies retain quality as they scale.
Chinese manufacturing must continue accumulating long-term competitiveness at this level. The speed of entry into new projects deserves recording, as does sustained delivery quality. Experience formed during rapid industrial expansion can remain useful through the next technological shift only when embedded in design, production and service systems.
VIII. Which Findings Survive Changes in Scenario?
1. Change parameters before deciding how strong a conclusion should be
A reference data hall clarifies relationships but can create another error: treating a recalculable parameter set as universal proportions. To avoid that, we separately vary the liquid-cooled heat share, average IT load and tariff to examine the conditions on which principal findings depend.
First, retain baseline AI and networking design loads and change only the share of AI-rack heat entering the liquid path. At 75%, the whole-data-hall IT air-path share is approximately 35.7%; at 87%, approximately 25.4%; and at 95%, approximately 18.6%. Even assuming all AI-rack heat enters liquid, the air path still accounts for approximately 14.3% if networking racks retain their original cooling method.
Only one parameter changes here; other equipment has not been reselected accordingly. The results establish that air-side requirements in this example depend on the complete load structure and that a single “fully liquid-cooled” label cannot characterize the whole facility. Networking and power products' cooling methods can also change in reality, so 14.3% is not an industry lower bound.
| Assumed share of AI-rack heat entering liquid | Whole-data-hall IT air-path share |
|---|---|
| 75% | Approximately 35.7% |
| 87% | Approximately 25.4% |
| 95% | Approximately 18.6% |
| 100% | Approximately 14.3% |
Source for Table 7: Our controlled parameter comparison. AI and networking loads remain unchanged; networking heat continues into air, and additional facility heat is excluded.
Next consider electricity cost. Keeping IT design capacity at 7,392 kW, annual hours at 8,760 and the PUE difference at 0.10, an average IT load of 40% and assumed RMB 0.40/kWh tariff give an annual cost difference of approximately RMB 1.04 million. At 90% load and RMB 0.80/kWh, it is approximately RMB 4.66 million. The intermediate 70% load and RMB 0.60/kWh give approximately RMB 2.72 million.
PUE is fixed exogenously within each scenario for conditional comparison; actual equipment-efficiency curves across load levels are not modeled. Real projects also require climate and operating data. The range nevertheless establishes material dependence on operating conditions: a fixed payback period without load and tariff assumptions cannot adequately support procurement.
2. Architectural change redistributes requirements
If higher-voltage distribution gains adoption, some low-voltage paths and conversion equipment may move or decrease, while adapted power-electronics, protection and control equipment must increase. If more devices enter liquid loops, air-side load may fall while liquid-path, coolant and verification requirements rise. Changes in interconnect distance, speed or topology likewise alter combinations of copper, optics and signal processing.
For one supplier, these changes can create substitution and new demand simultaneously. Manufacturing an item in an old architecture does not guarantee retained share in a new one; offering a next-generation sample does not mean existing customers will switch in the same period. Analysis should separately consider delivered business, new-product validation and architectural adoption timing.
This also explains why “rising supporting-equipment value per rack” cannot simply be extrapolated indefinitely. Integration can reduce external connections, standardization can lower unit prices, large-scale purchasing can redistribute profit, and improved system efficiency can reduce some capacity requirements. Total investment, physical equipment quantities and supplier revenue need separate tracking.
A more reliable approach assigns observable conditions to key judgments. Wider adoption of high-voltage DC requires more defined specifications, product validation and deliveries; volume production of an interconnect category requires delivery status and operating disclosures; system energy savings require data within a consistent operating boundary. These conditions are closer to verifiable change than a single-point market-size forecast.
3. Environmental metrics need complete boundaries
Facility-efficiency improvements deserve examination, but energy, water and carbon metrics must be distinguished. Recirculating liquid in a loop does not establish that the facility consumes no water; outdoor heat rejection must be checked for evaporation. US Department of Energy material on cooling-water efficiency explicitly identifies cooling-tower evaporation as one final heat-rejection path.18
A lower PUE likewise does not independently establish lower energy consumption or carbon emissions per computing task. Load, equipment efficiency, task type and electricity source all affect the outcome. An improvement in one metric should not be generalized into improvement across all environmental performance.
Chinese policy also emphasizes matching equipment with applications. The Ministry of Industry and Information Technology's interpretation of the Implementation Plan for High-Quality Development of Energy-Saving Equipment (2026–2028) identifies system coupling and matching of energy-using equipment as a work area.23 This accords with our system perspective: advanced individual units must create efficiency in their actual combination. A few efficient product names cannot establish whole-facility performance.
4. What this study can establish
The physical equipment ledger uses one public reference design to explain specific relationships among capacity, density, cooling and redundancy. It does not cover every chip, system manufacturer, climate or power condition. Controlled comparisons examine causal relationships and orders of magnitude; they do not serve as construction designs, equipment selections or total-cost-of-ownership quotations.
Corporate cases mainly involve companies with extensive public disclosure, creating sample-selection bias. They support participation status for the relevant company and period, not representation of all smaller companies or calculation of industry-wide capacity, concentration or domestic-production shares. Company-stated project, product and validation progress should continue to be updated with subsequent disclosures.
Monetary gaps remain explicit. Without complete procurement and operating information for one project, we do not present an actual whole-data-hall cost or precise cost structure. Conditional electricity calculations show only the magnitude of parameter changes. Later contracts and measurements can extend the existing equipment ledger without changing its accounting principles.
These boundaries keep the conclusions testable. The supported proposition is that AI infrastructure's manufacturing requirements are becoming more specific along system constraints, and Chinese companies have traceable participation progress at several stages. Capability and financial returns still require successive confirmation through validation, delivery and operating data.
IX. Conclusion: Turning Progress into Facilities That Operate
An AI data hall brings industrial work at different scales together. Computation inside chips connects to rack power supplies and cold plates; sustained rack operation connects to building distribution, piping and networking; and the building connects to wider electricity and manufacturing systems. The further ambitions for intelligence advance, the more accurately these engineering relationships must be handled.
The ledger leaves capacities and quantities, but also a deeper recognition: technological progress requires many industries to advance their boundaries together. Power must remain stable under new loads, cooling must transfer heat within new spaces, and interconnects must preserve reliability at new speeds. Every stage needs people to design, manufacture and test it and remain responsible after delivery.
Chinese companies can now present specific products, validation and deployment progress across these stages. Their significance can be recognized in a coupling, a power system or a high-speed cable, and followed further through a new system's operation. Long-accumulated experience in materials, processing, power electronics and production organization thereby connects with new computing requirements and acquires new uses.
This progress deserves appreciation. It comes from parameters engineers check repeatedly, consistency sustained on production lines, problems exposed by tests and resolved one by one, and responsibility continuing after equipment reaches the site. Turning technical ideas into products that customers use over the long term is among manufacturing's most concrete and substantial achievements.
The remaining challenges are clear: system matching at higher densities, protection and interfaces in new architectures, long-term reliability, quality and cost, and the business capability to turn delivery into cash. Keeping these problems visible strengthens the credibility of achievements and directs further investment.
Artificial intelligence may have expansive prospects, but manufacturing progress must become specific. When a data hall truly operates, power, heat and data follow their paths, and much unseen industrial labor is tested at the same moment. Chinese manufacturing's continued advance will also be recorded in facilities that can be calculated, verified and used continuously.
Methodological Appendix
A. Facts, calculations and judgments
This report calls specifications and disclosures recorded in public documents source facts, results obtained from our stated inputs conditional calculations, and explanations of relationships and economic meaning research judgments. Reference-design parameters are not on-site measurements; corporate disclosures establish what companies have publicly stated, not that we have independently tested their products. Particular loads, tests and simulations in papers are not generalized unconditionally to other applications.
The core reference is Revision 13 of Schneider Electric's RD109DS. Key configurations were checked on PDF pp. 1–4, with visual inspection of pp. 2–4. The official directory displayed other version metadata; the downloaded file's footer and contents govern here. The source ledger records public URLs, locators, evidence type and scope; downloadable files also have checksums retained for later version checks.
Companies are topic-selected cases, not a random sample or industry-wide survey. They are not used to calculate national factory counts, regional shares, concentration or domestic-production shares. Deployment statements without independent operating data retain their status as company statements.
B. Principal formulas and inputs
- Data-hall IT design power = AI-rack count × AI design power per rack + networking-rack count × networking design power per rack.
- IT liquid-path thermal power = AI design power × share of AI heat entering the liquid path.
- IT air-path thermal power = AI design power × remaining share + networking design power. This assumes all networking-equipment heat in this example enters the air path.
- Single-phase equivalent volumetric flow = thermal power ÷ specific heat capacity ÷ supply-to-return temperature difference ÷ density, followed by appropriate unit conversion. The text uses approximate pure-water properties, not actual coolant viscosity or piping resistance.
- Assumed CDU count = target thermal power ÷ usable capacity per unit under target conditions, rounded up before adding standby units. Pods and the shared pool are calculated separately; equivalent failure conditions are not established.
- DC current = power at the bus concerned ÷ voltage. The comparison excludes conversion losses, actual conductor selection and protective-device selection.
- Annual IT electricity = IT design power × assumed average load fraction × annual hours.
- Annual facility electricity difference = IT electricity over the same period × PUE difference; electricity-cost difference additionally multiplies by the uniform assumed tariff.
Power is expressed in kilowatts or megawatts, and electricity in kilowatt-hours. Equipment ratings in kilovolt-amperes require interpretation with power factor and other conditions; they are not added directly to kilowatts. Supply-to-return temperature difference is kept separate from approach temperature between the two sides. Currency is used only for hypothetical renminbi electricity cost; no equipment quotations are combined across currencies.
C. Recalculation and updating conditions
Calculations can be reproduced using the formulas in this appendix and the inputs specified in Tables 1 and 2 and the main text, checking heat balance, summed proportions, capacity after a redundant unit exits, and network-port balance. Sufficient decimal places are retained for checking; the text rounds appropriately to communicate magnitude.
If the reference design is revised, delivery status changes, or complete procurement and operating data for the same project become available, the corresponding inputs and evidence should be updated rather than silently replacing historical conclusions with new parameters. Price gaps remain until comparable material is obtained. This study conducted no equipment testing, site audit or company interviews and did not certify the reference design.
D. Choice of analytical methods
This report uses equipment-quantity decomposition, boundary reconciliation, conditional sensitivity analysis and comparison of company stages. Market concentration, industry-wide revenue forecasts, customs-scale comparisons and share-based attribution are not performed: the three systems span several industries, and available material does not provide a unified comparable denominator. The contribution is cross-system explanation of requirements and a reproducible equipment ledger, rather than an aggregate market total covering all supporting products.
Cover photograph: Cooling-cabinet aisle at the Frontier supercomputer facility, Oak Ridge National Laboratory (thematic photograph). Oak Ridge National Laboratory / Wikimedia Commons / CC BY 2.0.
References
[1] 天下工厂制造业数据库 (Tianxia Gongchang Manufacturing Database).
[2] SCHNEIDER ELECTRIC. EcoStruxure Reference Design 109: 7,392 kW, Tier III, ANSI, Chilled Water, Liquid-cooled AI Clusters (NVIDIA GB200) [R/OL]. RD109DS, Revision 13, pp. 1–4. Official directory; PDF examined.
[3] INTERNATIONAL ENERGY AGENCY. Key Questions on Energy and AI: Executive Summary [R/OL]. 2026. Locator: updated data-center electricity-demand outlook. Source.
[4] SRIVASTAVA N, PETTY H. Building the 800 VDC Ecosystem for Efficient, Scalable AI Factories [EB/OL]. NVIDIA Technical Blog, 2025-10-13. Locator: power architecture and multi-timescale storage. Source.
[5] OPEN COMPUTE PROJECT. Data Center Facility—Low Voltage Direct Current Power Distribution [R/OL]. Version 1.0; 2026-03-30. Locator: executive summary and system boundaries, p. 7. Source.
[6] GOOGLE, MICROSOFT, NVIDIA. Solid State Transformer (SST) Specification [S/OL]. Revision 0.3.0, cover effective date 2026-06-22. Locator: scope, electrical interfaces and system behavior, pp. 7–18. This is a version-specific technical specification, not described as a globally uniform mandatory standard. Source.
[7] CHOUKSE E, WARRIER B, HEATH S, et al. Power Stabilization for AI Training Datacenters [EB/OL]. arXiv:2508.14318v1; 2025-08-20. Locator: abstract, Sections I and III. The HTML examined was v1; the preprint is not described as having undergone journal peer review. Source.
[8] GULLBRAND J, GORE N, MATTESON J, et al. ACS Liquid Cooling Cold Plate Requirements Document [R/OL]. Open Compute Project, Revision 1.0; 2019-10-09. Locator: pp. 4, 7–9, 20–22, 30–31; loop definitions, components, monitoring and intervention. Only these definitions and system relationships are used; older water-temperature classifications are not treated as current universal limits. Source.
[9] ASHRAE TC 9.9. Emergence and Expansion of Liquid Cooling in Mainstream Data Centers [R/OL]. 2021. Locator: component thermal requirements, facility effects and system-transition discussion. Source.
[10] NVIDIA. DGX GB Rack Scale Systems User Guide: Networking [EB/OL]. Locator: NVLink Networking; Network Overview. Source.
[11] TE CONNECTIVITY. 224G Solutions for Ethernet Ecosystems [EB/OL]. Locator: technical discussion of impedance, return loss and crosstalk. Manufacturer descriptions are not treated as our independent measurements. Source.
[12] CORNING. Connector Cleaning FAQs [EB/OL]. Locator: contamination's effect on connection performance. Its product-specific cleaning procedure is not generalized into an operating procedure for all optical connections. Source.
[13] ZHEJIANG ZHAOLONG INTERCONNECT TECHNOLOGY CO., LTD. 2026 Interim Report [R/OL]. 2026-08. Pp. 10–13, particularly p. 13 on product delivery and validation status. Source.
[14] SHENZHEN MEGMEET ELECTRICAL CO., LTD. 2026 Interim Report [R/OL]. 2026-08. Pp. 14, 18, customized data-center and server power development and delivery. Source.
[15] SHENZHEN ENVICOOL TECHNOLOGY CO., LTD. 2026 Interim Report [R/OL]. 2026-08. Pp. 9–10, product coverage, testing equipment and platform validation. Source.
[16] ENVISION. Envision Achieves World's First Commercial Deployment of Integrated 800V DC SST-Based Power System in Large-Scale AI Data Center [EB/OL]. Company release, 2026-11-02. The title reproduces the source title; it does not establish a global ranking in this report. Source.
[17] ISO/IEC. ISO/IEC 30134-2:2026, Information technology—Data centres key performance indicators—Part 2: Power usage effectiveness (PUE) [S/OL]. Edition 2, 2026-01-16. The public catalogue, scope and version were checked; the full paid standard was not obtained. Official catalogue.
[18] U.S. DEPARTMENT OF ENERGY, FEMP. Cooling Water Efficiency Opportunities for Federal Data Centers [EB/OL]. 2019-01-09. Locator: typical evaporative-cooling path and annual PUE explanation. Source.
[19] GANERIWALA V. NVIDIA Launches DSX Ready to Qualify Power and Cooling Products for AI Factories [EB/OL]. 2026-09-21. Locator: Power and Cooling Qualification. Source.
[20] GUANGDONG SHENLING ENVIRONMENTAL SYSTEMS CO., LTD. Investor Relations Activity Record [R/OL]. No. SL20260907, meeting date 2026-09-04, pp. 1–2. Locator: new effective orders, goods dispatched and acceptance-related revenue recognition. Source.
[21] SHENZHEN HONOR ELECTRONIC CO., LTD. 2026 Interim Report Summary [R/OL]. 2026-08, p. 2. Consolidated revenue and net profit attributable to listed-company shareholders. Source.
[22] SHENZHEN HONOR ELECTRONIC CO., LTD. Investor Relations Activity Record [R/OL]. No. 2026-019, meeting dates 2026-09-21 to 09-24, pp. 1–2. Locator: business performance and its explanation. Source.
[23] DEPARTMENT OF ENERGY CONSERVATION AND RESOURCES UTILIZATION, MINISTRY OF INDUSTRY AND INFORMATION TECHNOLOGY. Interpretation of the Implementation Plan for High-Quality Development of Energy-Saving Equipment (2026–2028) [EB/OL]. 2026-03-20. Locator: strengthening system coupling and matching of energy-saving equipment. Source.
[24] SUTTON B, ZAKAIB B, SINGER G, et al. Single-Phase Direct-to-Chip Cold Plate Test Specification [S/OL]. Open Compute Project, Version 1.0.0, cover effective date 2026-09-03. Pp. 8–9, 11–22, scope and test categories. Source.