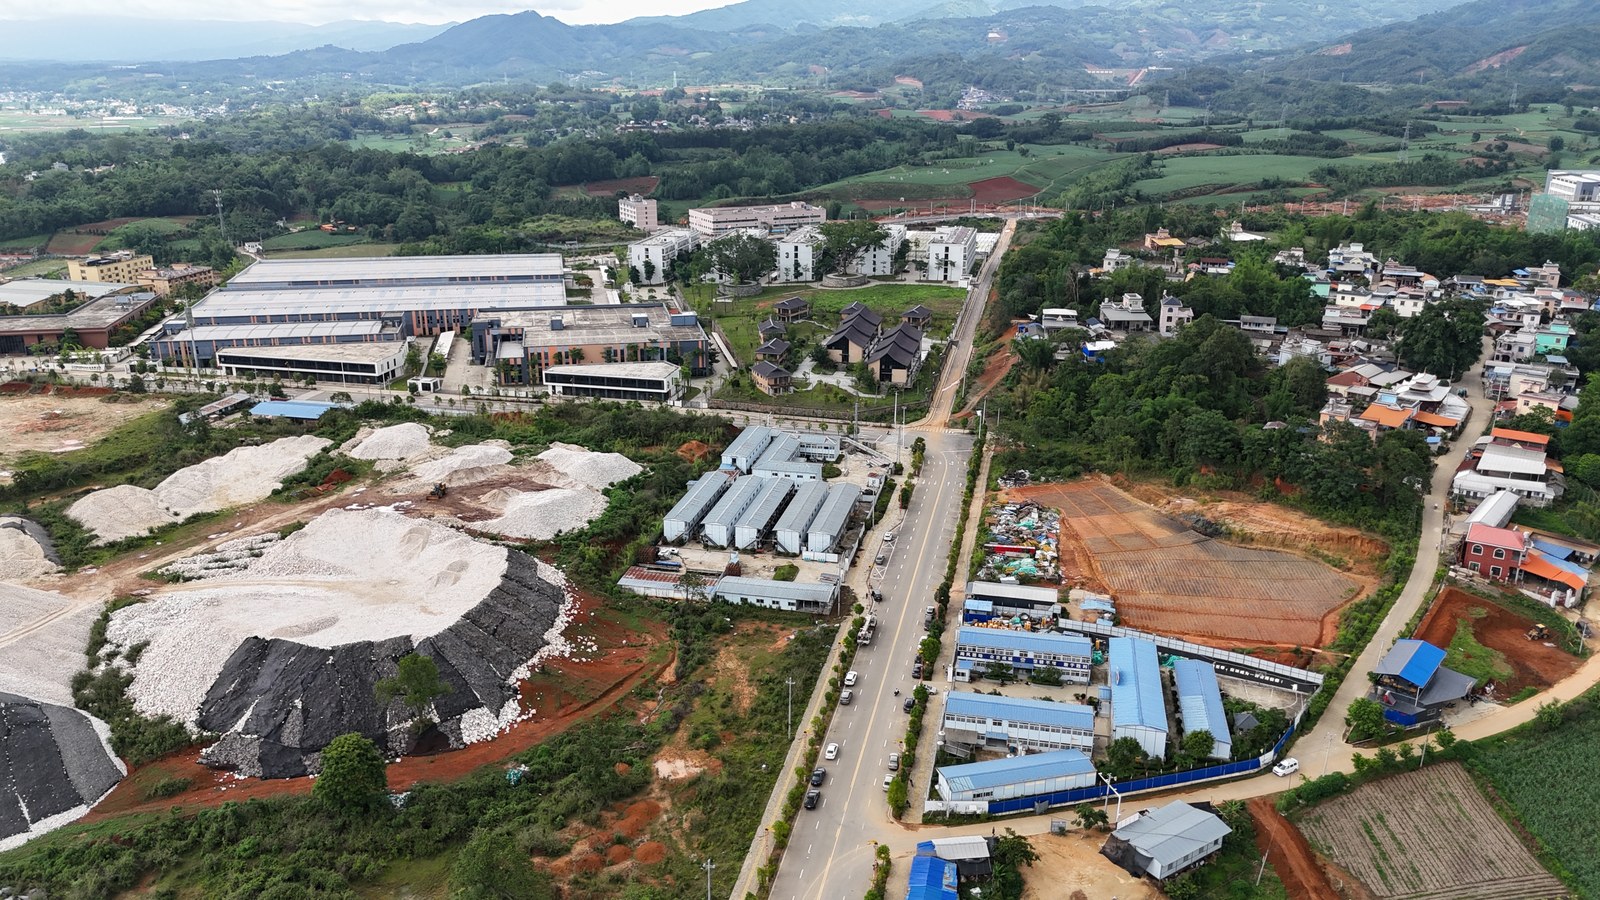

1. Prologue: The Weight of a Coordinate
In the autumn of 2025, the owner of a precision structural-parts company spent three months torn between two candidate plots of land. One sat in a development zone in a county in the Yangtze River Delta, with land prices forty percent higher and unremarkable investment incentives; the other was in a new industrial park in a central-China city, with cheap land and two full pages of tax-break clauses, and the park's leadership personally showed him the site three times. By the numbers, the second option would save nearly 20 million yuan over five years. He had all but decided to sign.
What actually stopped him was a single remark from an old supplier over dinner: "If you move out there, who's going to do your heat treatment?"
He went back and had his team audit the process list. His precision structural parts involved seven processes done in-house and five that relied on outside partners: heat treatment, anodizing, precision grinding, testing and metrology, and mold repair. In that Yangtze Delta county, there were over a hundred qualified providers across those five categories within a thirty-kilometer radius — payment terms, quality, and lead times could all be shopped around. In the new inland park, within fifty kilometers there were exactly two heat-treatment plants that met his requirements, and anodizing had to be shipped to the provincial capital a hundred and twenty kilometers away. Between round-trip logistics and queuing, surface treatment alone would add four days of turnaround. His customers ordered by the week; a four-day swing was enough to cost him his most important account.
Twenty million yuan of savings on paper lost to a supplier network within a thirty-kilometer radius. In the end, he stayed in the Yangtze Delta.
There is no lofty theory in this story — only a fact so plain it borders on cruel: factory site selection is one of the highest-stakes, hardest-to-reverse decisions in manufacturing. Equipment can be replaced, people can be hired, products can be redesigned; but once a site is fixed, the land, the buildings, the environmental permits, the commuting radius of your workers, and the logistics radius of your suppliers are all nailed to a single pair of coordinates. Choose well, and the surrounding industrial network lowers your costs every single day. Choose poorly, and every day you pay an invisible fine for that dot on the map — extra days of logistics, skilled workers you cannot find, outside partners who will not come — entry by entry, year after year.
Worse still, this decision has long been made under severely incomplete information. A business owner can see land prices, tax rates, and policy documents, but not the network that actually decides life or death: within thirty kilometers, how many plants can actually do heat treatment? How many competitors are fighting over the same pool of skilled workers? How far are my downstream customers from here? Would my upstream suppliers be willing to follow me? The answers to these questions are scattered across the workshops of several million factories, and no one had ever put them on the same map.
Now someone has.
Over the past several years, the Tianxia Gongchang industry platform has done something unglamorous: building a profile for each of the 4.8 million Chinese factories it covers, and resolving the actual production address of the vast majority — not the registered business address, but the place where the factory buildings physically stand — into latitude-longitude coordinates. As of today, this data asset contains over 3.45 million valid factory coordinates, of which more than 3.14 million are factories in operation. Spread these points across a map of China, and for the first time the spatial structure of Chinese manufacturing becomes visible at the resolution of "factory sites" rather than "registered addresses."
What this essay examines is what happens to factory site selection when such data meets AI: how a craft that once ran on experience, connections, and investment brochures is becoming a problem that can be computed, verified, and simulated. We will start with location theory from more than a century ago, explain why traditional site-selection methods are failing today, describe the industrial geography of China as seen through 3.45 million coordinates, show how supply-demand relationships and supplier networks can be quantified into site-selection evidence — and honestly delimit the boundaries of this method: what it can compute, and what it cannot.
A word up front about where we stand. Tianxia Gongchang built this data asset and uses it; this essay is obviously not a disinterested bystander's commentary. But we have chosen to write it as research: every figure comes with its definition, every limitation is disclosed, and every conclusion distinguishes "what the data says" from "what we judge." Readers may treat this as a product manual to be wary of, or as a research report to be tested — we hope for the latter, and we believe the methods and facts here can withstand that test.
This is not a light read. But if you are searching for the right place on the map for a factory, an industrial park, or a supply chain, the fifty thousand characters that follow may be worth your time.
2. A Century of Site-Selection Theory: From Transport Costs to Agglomeration Economies
Where should a factory be built? This question has been studied as a serious discipline for two hundred years. Revisiting that academic lineage is not pedantry — quite the opposite: the underlying logic of every AI site-selection model today can be traced back to these classical theories. Only by understanding them can we see clearly what AI has actually changed, and what it has not.
Thünen's Rings: Distance Is Cost
In 1826, the German estate owner Johann Heinrich von Thünen published The Isolated State. He imagined a solitary city surrounded by a homogeneous plain and reasoned that different crops would arrange themselves in concentric rings around the city: the innermost ring would grow fresh vegetables and produce fresh milk, which cannot survive long transport; further out would be timber, heavy and expensive to haul; beyond that grain, and in the outermost ring, pasture. The structure of these rings was determined by a single variable: distance to market.
Thünen studied agriculture, but the core of his insight applies to all production: the value of land lies not in the land itself but in the transport cost between it and the market. For the same mu of land, every increment closer to demand is an increment of value. The "demand proximity" metric in any modern site-selection model is, at bottom, a descendant of Thünen's rings.
Weber's Triangle: The Birth of Industrial Location Theory
The first person to build a complete theory of factory location was the German economist Alfred Weber. In his 1909 Theory of the Location of Industries, he proposed an analytical framework still in use today: the optimal location of a factory is the point among raw-material sources, fuel sources, and the consumer market that minimizes total transport cost — the famous "location triangle."
Weber divided industrial inputs into two kinds: ubiquitous materials (like water and gravel, found everywhere) and localized materials (like iron ore and coal, found only in particular places). He further classified production by a "material index": weight-losing industries (like smelting, where a hundred tons of ore yield a few tons of metal) should locate near raw materials, while weight-gaining industries (like brewing, where most of the weight comes from water available anywhere) should locate near markets. On top of this transport-cost framework, Weber layered two corrections: differences in labor cost can "pull" a factory away from the transport-optimal point, and the gains from agglomeration can "pull" dispersed factories together.
Seen with today's eyes, what is astonishing about Weber's framework is its structural completeness: transport costs, labor costs, agglomeration effects — more than a century later, every serious site-selection model still works on these same three variables. Only the way each variable is measured has fundamentally changed.
Marshall's Industrial Districts: Why Factories Love to Cluster
Even before Weber, the English economist Alfred Marshall had noticed something odd in his 1890 Principles of Economics: factories of the same kind always appear in clumps. Sheffield's cutlery, Lancashire's cotton — factory beside factory, plainly intensifying competition among themselves. Why crowd together anyway?
Marshall's explanation, later known as "Marshallian externalities," involves three mechanisms:
- The labor pool. Where similar factories cluster, a large market of skilled workers grows up. Workers fear unemployment less (the plant next door is always hiring), and owners fear labor shortages less (the streets are full of people who know the trade). Both sides' risks are absorbed by the pool.
- Shared intermediate inputs. Where factories clump, specialized suppliers spring up to serve them — molds, hardware, packaging, repairs. Each supplier gets enough order volume to become more specialized and cheaper; each factory in turn buys more professional services at lower cost.
- Knowledge spillovers. Marshall's oft-quoted line: in an industrial district, "the mysteries of the trade become no mysteries, but are as it were in the air." Process improvements, market shifts, the merits of different machines — in dense factory country these travel at the speed of dinner tables, job-hopping, and neighborly visits.
All three mechanisms hold with precision in China's industrial belts today. Why do the nation's injection-molding-machine repair masters concentrate in a handful of cities? Why can materials be sourced in three days inside an industrial belt but not in three weeks outside it? The answers were written down more than a hundred and thirty years ago.
Christaller and Central Places: The Hierarchy of Markets
In 1933, the German geographer Walter Christaller proposed central place theory to explain why cities and markets form hierarchies: a shop selling daily necessities can open in every village, while a piano store can only survive in a big city — because different goods require different "threshold populations" to sustain them. The theory later became the foundation of commercial site selection (stores, warehouses, branch networks). Its lesson for industrial location is this: different links in an industrial chain require hinterlands of different scales. A maker of standard fasteners can live off one county's demand; a maker of large forgings may need orders from all of East China to keep its furnaces lit. The first question of site selection has never been "where is cheap" but "how large a hinterland does my business need."
Hoover and Lösch: The Structure of Transport and the Boundaries of Markets
Between Weber and Krugman, two transitional figures deserve mention. The American economist Edgar Hoover, in the 1930s, refined the analysis of transport costs: freight does not rise linearly with distance — loading, unloading, and transshipment ("terminal costs") account for the bulk, so the unit cost of long-haul transport declines. This seemingly technical correction explains something important: why ports and rail hubs — "transshipment points" — naturally attract factories. Locating where transport modes change saves an entire segment of terminal costs. The heavy-industry layout along China's coasts and rivers, and the pull that inland rail-port hubs exert on industry today, all run on Hoover's arithmetic.
The German economist August Lösch, in the 1940s, flipped the perspective from "where should one factory go" to "what shape will the whole market take": when countless producers compete in space, each firm's market area gets squeezed into honeycomb-like boundaries, and the economic landscape becomes a nested network. Lösch's lesson: your serviceable radius is not set by you alone; it is set jointly by your position and your competitors' positions — a theoretical seed for the competition map discussed later in this essay.
Krugman and the New Economic Geography: Agglomeration Can Be Self-Fulfilling
In the 1990s, Paul Krugman put increasing returns to scale and transport costs into a single general-equilibrium model, founding the "new economic geography" and winning the 2008 Nobel Prize in Economics for it. His core insight: the spatial distribution of industry is not dictated by resource endowments alone, but is a self-reinforcing historical process — a place accumulates factories for accidental reasons, factories attract workers, workers form a market, and the market attracts more factories. Once agglomeration crosses a critical threshold, it snowballs into a self-fulfilling "core-periphery" structure.
The theory explains much of what resource endowments cannot in China's industrial geography: why is the world's lighter production concentrated in Shaodong, Hunan, and a few towns in Zhejiang? Why can Anping, a single county in Hebei, host the country's largest wire-mesh cluster? Those places have no special raw materials and no special ports — only a spark decades ago, and an agglomeration loop that has reinforced itself ever since.
For the site selector, Krugman's lesson cuts both ways. The positive: following agglomeration is usually right, because agglomeration itself is efficiency. The negative: agglomeration is path-dependent — today's industrial map is a snowball rolled by history, not necessarily the optimum for the present. Where the snowball has rolled too far, land, labor, and environmental capacity rise until they eat up the agglomeration dividend. When to follow the cluster and when to leave it is precisely the hardest judgment in the discipline.
The Common Predicament: A Telescope Without Glass
Looking at this two-hundred-year lineage as a whole reveals a shared predicament: the theory matured long ago; the data never kept up.
Thünen needed the transport cost of every crop to market; Weber needed the precise locations of materials, fuel, and markets; Marshall needed to know how many factories, workers, and suppliers each district held; Krugman's models needed the true spatial distribution of industry as their initial conditions. For most of history those data either did not exist or existed only at the coarsest grain — a statistical yearbook can tell you how many above-scale machinery firms a province has, but it will never tell you how many anodizing shops able to take an order sit within ten kilometers of a particular town.
And so a theoretical science degenerated, in practice, into a craft: bosses chose sites on the word of fellow townsmen, parks picked their "pillar industries" by intuition, and consultants drew heat maps from provincial statistics. The optics of the telescope were worked out a century ago; the glass was never ground.
Now the glass exists. In the chapters ahead, we first examine how the old lens failed, then look at what the new lens can see.
3. Three Reconstructions of China's Industrial Geography: How Today's Map Came to Be
Location theory describes universal laws, but every actual industrial map is a product of history. To understand how China's factories are distributed today — why the beads formed here rather than there, why some clusters run deep while others scatter at the first gust — the time axis must be stretched out to see which great tides carved this map. This chapter covers three great spatial reconstructions. It is not a history lesson: every section bears directly on how a site selector should read the map today.
The First Reconstruction: The Hand of the Plan (1950s–1970s)
The first large-scale shaping of new China's industrial geography came from two famous rounds of planned-economy allocation: the industrial foundation laid in the 1950s under the "156 key projects," and the "Third Front construction" that began in the mid-1960s.
The site logic of these two rounds had nothing to do with markets; it was a direct projection of state will. The 156 projects landed heavily in the Northeast and North China, anchored to resource endowments and existing industrial bases. The Third Front, driven by national-defense considerations, moved entire heavy-industry systems into the deep southwest and northwest — "near mountains, dispersed, concealed" was the site-selection doctrine of that era, almost the exact opposite of Weber's transport-cost minimization.
The legacy of the planned hand remains clearly visible on the map: the heavy-industry base of the Northeast and North China, the Wuhan–Shiyan automotive corridor, the defense and equipment systems of Sichuan and Guizhou, the machine tools and aviation of the Guanzhong plain. For today's site selector this legacy means two things. First, these old industrial regions hold China's deepest pools of heavy-industry craftsmen and engineering culture; for certain processes (large castings and forgings, precision machine tools, special materials) their talent density remains unmatched. Second, they also demonstrate the price of locating against the grain of location economics — the large-scale relocation and restructuring of Third Front enterprises in the market era is itself a cautionary textbook: when transport costs and supplier radii once again became hard constraints, spatially misplaced capacity sooner or later voted with its feet.
The Second Reconstruction: The Hand of the Market (1980s–1990s)
Reform and opening launched the second reconstruction, driven by two forces that had not existed before.
The first was the wild growth of township and village enterprises. The Sunan model, the Wenzhou model, the Pearl River model — different paths, same destination: for the first time, industrialization bypassed the cities and the plan and germinated directly in the soil of counties and townships. The most distinctive feature of China's industrial geography today — the "one town, one product" industrial belt — mostly planted its seeds in this period. Why this town and not the next one over? The starting points are often improbably small: a craftsman returning home, a commune enterprise pivoting, one order that happened to come in. But once Krugman's self-reinforcement mechanism (see the previous chapter) kicks in, the spark snowballs: masters train apprentices, apprentices strike out on their own, suppliers grow up alongside, traders funnel in orders from across the country — and twenty or thirty years later, the town simply is the industry.
The second was the reshaping of the coast by export-oriented growth. Special economic zones, open cities, export processing — the global relocation of supply chains landed in the Pearl River and Yangtze River deltas, shaping the "shop in front, factory behind" spatial pattern. The site logic of this round was textbook location economics: near ports (transport costs), abundant labor (factor costs), policy lowlands (institutional costs). By the end of the twentieth century, the basic pattern of Chinese manufacturing — dense in the east, sparse in the west, coast over interior — was set.
For today's map reader, the second reconstruction's lesson hides in the details: clusters grown organically by the market and clusters planted by foreign investment have different genes. The former (industrial-belt type) are deep-rooted — local entrepreneurs, local craftsmen, local suppliers intertwined — highly storm-resistant but slow to upgrade. The latter (processing-trade type) are efficient — born to international standards — but shallow-rooted: they are anchored by orders and costs, and when the orders leave, so do they. To judge a cluster's resistance to relocation, first judge its birth.
The Third Reconstruction: Cost and Security Together (2000s–Present)
Entering the new century, and especially over the past decade and a half, the third reconstruction has unfolded, driven by several overlapping forces — the historical depth behind the "great migration" chapter later in this essay.
First, the extreme expansion of coastal capacity after WTO accession pushed land and labor costs to critical points, triggering textbook gradient transfer: labor-intensive links diffusing inland and into central and western counties. Then came the divergence of industrial upgrading: coastal cores "emptied the cage for new birds," climbing toward R&D, brands, and high-end manufacturing; the capacity thus displaced did not vanish but faced a choice between the interior and Southeast Asia. Layered on top in recent years is the supply-chain security logic — multiple bases, backups, near-shoring — inserting "resilience" into the site-selection objective function for the first time, sometimes aligned with cost, sometimes directly against it.
The third reconstruction also has a feature the first two lacked: it is happening as a battle over existing stock. The keynote of the first two reconstructions was increments — new factories rising on empty land, new clusters growing where nothing stood. In the third, inflow and outflow, expansion and contraction happen simultaneously; one region's gain is often another's loss. This subtly changes the value of spatial data: in the incremental era, spotting "where things will grow" was enough; in the stock era, one must also spot "where things are shrinking" — and contraction signals are far harder to read from public narratives than growth signals, because no locality advertises that its factories are leaving. Coordinate data records outflow as faithfully as inflow, and that symmetrical honesty is worth a great deal in the stock era.
Unlike the first two reconstructions, the third has no single dominant logic. In the planned era you listened to the state; in the opening era you listened to costs; today's site selector must listen simultaneously to costs, markets, security, policy, and talent — five voices that frequently sing out of tune. This is precisely why site selection has become unprecedentedly complex, and why it has become unprecedentedly dependent on data and computation: when the single logic that intuition could lean on disappears, only laying all five voices on the table makes weighing them possible.
The Superposition: Today's Map
Today's Chinese industrial map is the superposition of three reconstructions: the heavy-industry base laid by the plan, the constellation of industrial belts grown by the market, and the great migration now in progress — three layers of markings coexisting and entangled.
This is why static, single-caliber industry data is doomed to mislead: a provincial statistic for "number of machining enterprises" may mix together state-owned giants inherited from the Third Front, family workshops grown out of townships, and precision-machining plants freshly relocated from the coast — three kinds of firms with utterly different technical lineages, supplier needs, and relocation propensities, summed into one number that explains nothing.
And this is exactly why coordinate-level, profile-level industry data matters: it does not stir the three layers into a single pot. It lets every factory stand at its true location, carrying its own origin, industry, scale, and status. The history of three reconstructions cannot tell you what the map will look like in the next decade, but it tells you at least this: the map has always been changing, and every change has rewarded those who saw it first.
4. Why Traditional Site Selection Fails: Four Systemic Blind Spots
Before discussing what AI can do, we must honestly dissect where traditional site selection fails. The failure is not for lack of professionalism — quite the contrary: investment-promotion officials, consulting advisors, and the executives in charge of plant construction are mostly exceptionally shrewd people. The failure is structural: the information infrastructure their decisions rest on contains four blind spots that no amount of individual effort can patch.
Blind Spot One: The Registered Address Is Not the Production Site
Most publicly queryable enterprise data in China is anchored to the registered business address. The gap between registered addresses and actual production sites is large enough to distort any spatial analysis built on the former.
The sources of the gap are many: firms registered in a development zone for tax reasons while producing in an old plant; headquarters registered in a downtown office tower with the factory in a suburban county; one business license carrying three production bases; production long since halted and relocated with the license never updated. In due diligence on a single firm, these gaps can be verified one by one. But when you need to answer a spatial question like "how many injection-molding plants are actually producing within thirty kilometers of this area," registered-address data can be wildly wrong — the place you think is dense may merely be a "license-dense zone," and the place that looks blank may hide whole streets of workshops.
Doing site-selection analysis with registered-address data is like planning subway lines with household-registration data: the numbers are real; the locations are wrong.
Blind Spot Two: The Wall of Administrative Boundaries
Nearly all public industry statistics use administrative units: province, city, county. But industrial agglomeration is market behavior; it does not read the administrative map. A real industrial cluster frequently spans two counties, three districts, or sits astride the border of two prefecture-level cities.
This "statistical wall" produces two classic misjudgments. First, cross-boundary clusters get bisected: a cluster spanning two counties appears in each county's statistics as merely "some related enterprises"; no one treats it as one complete industrial belt, and its true scale is systematically underestimated. Second, aggregation within a boundary conceals internal structure: a city may report three thousand metal-products firms — sounding like a great cluster — but if those three thousand are evenly smeared across ten thousand square kilometers, virtually no Marshallian externalities exist among them; suppliers, craftsmen, and knowledge spillovers are all out of reach. Three thousand scattered plants and three thousand packed into fifty square kilometers are two entirely different worlds for a site selector, yet on the administrative statistics table they are the same number.
As later chapters will show, among the industrial clusters we identified in the nationwide coordinate data, 88 clearly span county lines — clusters that no county-level statistical source could ever see whole.
Blind Spot Three: The Mismatch Between Investment-Promotion Language and the Real Ecosystem
The information supply side of site selection has long been dominated by "investment promotion" language. Park brochures list land prices, standard factory buildings, tax rebates, utility hookups; leadership briefings tout pillar industries, flagship projects, output targets. None of this is false, but it systematically avoids the life-or-death variable for manufacturers: the supporting ecosystem.
A factory's daily operation depends on a fine-grained external network: outsourced processing, mold repair, tool grinding, surface treatment, packaging and printing, equipment repair, hazardous-waste disposal, testing and metrology. The players in this network are mostly small shops of a few dozen people; they never appear in investment brochures and rarely enter statistics. Yet they are what determine whether a factory can "run smoothly" in a place. A brochure will tell you how many tens of thousands of yuan per mu the land saves; it will not tell you the nearest heat-treatment plant is a hundred and twenty kilometers away. It will tell you how many "above-scale enterprises" have moved in; it will not tell you how many days a master keeps you waiting to rework a mold.
Hence a script that replays endlessly: a firm lands for the incentives, and only after production starts discovers it is the only one of its trade within fifty kilometers — no suppliers, no skilled-labor pool, no peers, every Marshallian externality equal to zero. The land and tax savings are repaid, with interest, through a decade of operating friction. The trade calls such plants "island factories." Their tragedies rarely enter any case library, because no one wants to admit they picked the wrong place.
Blind Spot Four: The Radius of Experience
The last blind spot is the most insidious: the geographic radius of personal experience is finite.
Traditional site selection leans heavily on the owner's personal network — where fellow townsmen have factories, where old suppliers sit, which places the trade association friends recommend. Within a small radius this mechanism works remarkably well (that dinner-table line about heat treatment was worth twenty million yuan). But it has an inherent range limit: an entrepreneur with twenty years in the Pearl River Delta knows its ecosystem inside out, while his knowledge of the middle Yangtze may amount to a few site visits and a few articles. When the tide of industrial transfer demands nationwide re-selection, the radius of experience becomes the ceiling of decision quality.
Subtler still, experience lags in time. Industrial geography is alive: an inland cluster that looked thin five years ago may have grown complete supporting links in several niches; a coastal belt at its zenith may be quietly hollowing out under cost pressure. Those who navigate by experience are always steering with a map that is several years old.
The Common Structure of the Four Blind Spots
Put the four together and a common structure appears: site selection is a spatial problem, yet nearly all the information in the decision maker's hands is non-spatial — registration data is spatially displaced, statistics are chopped up by administrative walls, promotion materials dodge the ecosystem, and personal experience is bounded by its radius. This is why two hundred years of location theory degenerated in practice into a craft: the theory was not wrong; the data fed to it was unworthy.
To make site selection a science again, what is needed is not a cleverer model but getting the most basic layer right first: returning every factory to the coordinate where it actually stands. That is the subject of the next chapter.
5. 3.45 Million Coordinates: Chinese Manufacturing Lit Up for the First Time
In mid-2026, the Tianxia Gongchang Industry Research Institute completed a full inventory of the platform's coordinate data asset. This chapter presents what that inventory revealed — it is both the data foundation for every analysis in this essay and the direct evidence for our belief that research on China's industrial geography is undergoing a paradigm shift.
What This Data Is
First, the definitions — because definitions determine the credibility of every conclusion that follows.
The Tianxia Gongchang industry platform covers profiles of 4.8 million Chinese factories. On top of this archive, the platform has resolved the latitude-longitude coordinates of actual production addresses for the vast majority: more than 3.45 million factories currently carry valid coordinates — roughly ninety-four percent — of which more than 3.14 million are in operation. In other words, the overwhelming majority of real manufacturing sites in mainland China are now points on this map that can be searched, computed, and aggregated.
Three key details of definition:
- Factory sites, not registered addresses. The previous chapter covered the distortions of registration data. This coordinate base is anchored to the actual place of production and operation — where the factory buildings truly stand. This is its fundamental difference from every "enterprise map" on the market built from business-registration data.
- Points, not areas. Each factory is a coordinate point, so any spatial question — "how many factories of a given category lie within a thirty-kilometer radius of this location" — can be computed precisely rather than approximated by administrative units.
- Alive, not dead. Each profile carries operating status, industry category, product descriptions, and scale signals; the coordinates are not bare points but points with full profiles attached. When computing "density," you can count only firms in operation, only a particular industry, only firms above a certain scale.
An Honest Preface: A Technical Limitation That Must Come First
Before showing what this data can do, we state its limits — that is the Institute's rule, and something anyone who uses this data seriously must know.
The address system in rural and township China is inherently coarser-grained than in cities. Vast numbers of township factories register addresses that end at "such-and-such village" or "such-and-such town industrial zone," and address resolution can only place them at the village or town center point. The result: in places dense with township industry, dozens or even hundreds of factories share a single coordinate. The inventory found roughly 7,774 such "high-density shared-point locations" nationwide (thirty or more factories stacked on one coordinate), totaling about 454,000 firms — roughly fourteen and a half percent of all factories with coordinates.
A concrete example: Anping County in Hebei is the country's largest wire-mesh cluster. The coordinate base shows 4,712 related factories there — but they sit on only 1,139 distinct locations, because large numbers of village workshops have been merged onto village center points.
What does this mean? It means extreme care is required for micro-analysis "precise to a few hundred meters" inside township industrial belts. We therefore set ourselves an iron rule: every density conclusion released externally must report two numbers — the company count and the distinct-location count. The company count answers "how many factories are here"; the distinct-location count answers "how spread out they are in space." Only together do they constitute honest density.
Fortunately, the workhorse scales of site-selection analysis are five, ten, and thirty kilometers — and at those scales, the offset between a village center point and the true factory site (usually within a kilometer or two) barely affects conclusions. What this limitation truly constrains is block-level micro-analysis, not the industry-scale site selection this essay discusses.
What Became Visible When the Lights Came On
When 3.45 million points were spread on one map for the first time, things that had existed only in hearsay and experience became directly observable facts.
First, the spatial concentration of Chinese manufacturing far exceeds the impression given by statistical yearbooks. Statistics by administrative unit flatten everything; at coordinate scale, manufacturing is not spread evenly across the national territory but condensed into dense "beads" — the Pearl River and Yangtze River deltas are two great strings of them, with the Shandong peninsula, southeastern Fujian, Chengdu-Chongqing, and the Central Plains each strung in their own way. Between the beads lie stretches of near-blankness. For a site selector the implication is direct: there is no such thing as a homogeneous site-selection space in China. The feasible locations have always been discrete — whether you are inside a bead, at its edge, or between beads is three entirely different fates.
Second, the true boundaries of industrial belts do not match their names. Almost every famous belt's actual firm distribution spills beyond the administrative unit it is named after. The nominal "County X industrial belt" routinely extends into two or three townships of neighboring counties — suppliers follow the anchor plants wherever they go, county lines be damned. This confirms the "statistical wall" of the previous chapter: analyzing industry by administrative units shows you clusters that have been cropped.
Third, the spatial companionship of supporting industries is a universal law, and its strength is startling. This point matters enough to deserve its own chapter (the next one). Here is one number as an appetizer: of the tens of thousands of beverage plants nationwide, seventy percent can find all three supporting categories — packaging, printing, and preforms — within a twenty-kilometer radius. "Industrial ecosystem" is not a figure of speech; it is a measurable spatial fact.
Fourth — and most important for this essay — this map makes counterfactuals possible. Traditional site selection can only evaluate the candidates put in front of it. With full-coverage coordinates, you can interrogate any location in China — "if I built here, what would supply, demand, supporting industries, and competition look like within thirty kilometers" — and get an answer grounded in complete data. For the first time, site selection can enumerate, not merely compare.
Why This Data Did Not Exist Before
A natural question: if it is so useful, why had no one built it?
The answer is cost structure. This coordinate base is not the product of one purchase or one scrape; it is the output of a long-running pipeline: profiles built firm by firm, addresses cleaned line by line, coordinates resolved point by point, operating status continuously refreshed, industry and product labels endlessly calibrated. Multiply each stage of that pipeline by a base of 4.8 million and you get an engineering effort that cannot be completed without patience. The market does not lack enterprise data; it lacks the unglamorous work of reducing "enterprises" to "factory sites" and maintaining them over time.
That is why we dare say "lit up for the first time": not as rhetoric, but because to our knowledge, a manufacturing coordinate base anchored to actual factory sites, covering the whole country, attached to complete profiles, and continuously updated did not previously exist on the market. Competing data is almost entirely anchored to registered business addresses — it answers "where is this company registered"; we answer "where does this factory live." For site selection, the distance between those two questions spans every blind spot of the previous chapter.
The lights are on. The next chapters look at two things the light reveals: the spatial grammar of supply and demand, and the true map of industrial clusters.
6. How This Data Was Forged: A Story About Unglamorous Work
Earlier we said this coordinate asset did not exist before because of cost structure. This chapter unpacks those two words — involving no technical secrets, only the engineering character of the thing. Understanding how it was forged explains why it is hard to replicate, and why we are so frank about its limitations.
It Began With a Humble Need
Tianxia Gongchang did not start from a grand narrative like "build a map of Chinese industry." It started from an extremely concrete user need: a salesperson selling equipment wanted to find every metal-surface-treatment factory in a particular city in Guangdong — ideally with the owner's phone number.
To serve that humble need well, several questions cannot be dodged. Does this factory actually exist? Does it actually do surface treatment? Is it still alive? Where is its plant — not where the license is registered, but where the yard the workers walk into every morning actually is? And when the phone rings, does the person answering have any say? Each of these questions, at the scale of 4.8 million, is a production line that must run continuously.
Five Stages
Profiling. Consolidating enterprise information scattered across countless public sources into one profile per factory: name, category, products, scale signals, status. It sounds like collection; most of the effort is actually "unification" — the same factory appears under different names, abbreviations, and former names across sources. Recognizing them as one firm instead of three, and two firms as two instead of one, is the first life-or-death line of profile quality.
Locating. Turning the text address "province, city, town, village, road" into a pair of coordinates. Urban addresses are relatively orderly; township addresses are wildly varied — "next to the village committee," "across from such-and-such factory" — hence the village-center-point merging problem confessed earlier. The first lesson this stage taught us: the granularity of addresses is a mirror of China's urban-rural divide. No one can conjure precision that the address itself does not contain; one can only honestly label the precision tier.
Classifying. The 1,965 industry categories did not fall from the sky; they are the product of several rounds of mutual grinding between the national-standard framework and industrial-belt reality. National classifications are scientific and stable, but the front lines of industry cut far finer — two "mesh makers" may be two trades that never touch. The value of a category system lies not in fineness but in whether "the trade language in a salesperson's mouth" and "the label in the profile" can meet.
Verification and refresh. Profiles are not built once and done. Firms shut down, relocate, pivot; status signals must be cross-validated from multiple sources and refreshed on a rolling basis. This is the most endless of the five stages — it produces no new data; it only keeps existing data from rotting. A data asset is like a factory building: without maintenance, it depreciates.
Contact and reach. The final stage turns profiles into business: contact leads for key people and decision makers, delivered — de-identified, tiered, compliant — to users with legitimate purposes. Over 3 million factories carry direct contact channels to owners or decision makers. The work behind that number is less data engineering than a long refinement of one question: what kind of outreach creates value for both sides?
The Compound Interest of Unglamorous Work
None of these five stages is clever. Their common trait: each execution is worth little; continuous execution is worth a great deal — all the compound interest hides in the word "continuous."
For the same reason, this asset's moat is not any algorithm but time multiplied by discipline. Algorithms can be caught up with; five years of rolling verification cannot — start building today and in five years you hold a snapshot of five years from now, while we hold the animation running from the past to five years from now. The genuinely valuable parts of industrial-geography analysis — trends, inflows and outflows, the birth and death of clusters — exist only in the animation, never in any single frame.
The Surprise of By-products
Strictly speaking, every site-selection capability in this essay is a by-product. The data was built to help salespeople find customers; nobody planned "automatic industrial-cluster discovery" on day one. But once profiles are accurate to the factory site, coverage reaches the full population, and updates track the present, the capacity for industrial-geography research emerges on its own — every coordinate used in cluster identification and every category used in supplier-radius measurement is the daily output of those five stages.
There is a lesson here for anyone in the data business: the ceiling of a data asset's value is set by the honesty of the original need it served. "Help a salesperson find factories that really exist, really operate, and really match" is a need with zero tolerance for bad data — one dead phone number costs one user. Data raised under such a need has precision to spare when repurposed for research. Data hoarded for storytelling, by contrast, shatters at first contact with real decisions.
We also write this chapter with a private motive: so that when readers cite any number in this essay, they know it was not copied from a report but grown out of these five stages. The weight of a number comes from the weight of its production line.
7. The Geography of Supply and Demand: Supplier Radii Can Be Measured
Marshall said suppliers gravitate toward industrial districts; Krugman wrote it into models. But how close is "gravitate"? Is the typical distance between a factory and its suppliers five kilometers or fifty? How much do supplier radii differ across industries? These questions used to have only qualitative answers. With full-coverage factory-site coordinates, they can be measured directly for the first time.
This chapter presents what we actually measured in the data, and what it means for site selection.
Two Measured Results
Beverage plants and their "big three." A beverage plant's daily operation depends on three categories of nearby suppliers: packaging materials, printed labels, and preforms and caps. Beverages are the classic "weight-gaining" product — Weber demonstrated a century ago that they must locate near markets — and their packaging suppliers must in turn locate near them: bottles and cartons are a business of "shipping air," and every extra kilometer of haul is pure loss. We measured supplier proximity for 11,965 beverage plants nationwide. The result: 70.3% of beverage plants can find all three supplier categories — packaging, printing, and preforms — within a twenty-kilometer radius. Seventy percent of plants, all three supports in place, radius twenty kilometers. This is not the result of industrial planning; it is spatial order grown from decades of spontaneous market evolution.
Molds and injection molding: near-total symbiosis. A more extreme example is the relationship between mold shops and injection-molding plants. Molds are the "teeth" of injection molding; the frequency of tooling, trials, and repairs is extremely high, and how fast a mold master can arrive directly determines a plant's downtime losses. The measurement: 99.7% of mold shops have an injection-molding plant within a ten-kilometer radius. The number has the flavor of physical law — it says that in China, mold shops existing independently of injection-molding customers essentially do not exist; the two trades are spatial symbionts.
These two numbers reward repeated chewing, because they represent two different strengths of spatial coupling: beverages and packaging are "strongly companioned" (seventy percent fully supplied within twenty kilometers); molds and injection molding are "nearly bound" (ninety-nine percent adjacent within ten). The coupling strength of any industry pair can be measured pair by pair — and every coupling strength is a site-selection constraint.
Supplier Radius: Every Industry Has Its Own Isochrone
Measure enough industry pairs and a concept of great practical value to site selection crystallizes: the supplier radius — the typical distance, evolved by the market, between an industry's factories and each category of support they depend on.
Three factors set the supplier radius:
- Interaction frequency. Work requiring masters on-site often (mold repair, equipment rescue) has a very short radius, on the order of ten kilometers. Weekly deliveries (packaging, labels) sit in the middle, twenty or thirty kilometers. Standard parts settled monthly can stretch to hundreds.
- Transport economics. The more a material "ships air" (preforms, cartons, foam), fears vibration (precision parts), or has a clock on it (fresh ingredients), the shorter the radius.
- Indivisibility of the service. Processes like heat treatment, plating, and anodizing require the workpiece to be physically sent out and brought back — each round trip costs days. Double the radius, and work-in-progress turnover slows by a notch.
The intuition of the structural-parts owner in the prologue — "who's going to do my heat treatment" — was in essence a question about his industry's supplier radius. What he did not know is that the question now has a precise answer: for any candidate location, the number of eligible providers of each outsourced process within ten, thirty, and fifty kilometers is a directly computable figure.
From "Exists" to "Deep": Supplier Depth
Having a supplier within the radius is merely a passing grade. What truly separates candidate locations is the depth of support — how many alternatives of each category exist within the radius.
Depth determines three things. Bargaining power: with one heat-treatment plant in radius, prices and payment terms are its call; with ten, they are yours. Resilience: when the sole supplier shuts for maintenance, jacks up prices, or has its capacity locked by a big customer, your line stops with it; with backups, the risk is spread. Evolutionary headroom: a factory's processes change — not needing anodizing today does not mean not needing it in three years. Landing in a deep-support location is buying an option on your own future process changes.
In data language: traditional investment-promotion pitches evaluate a location's "stock metrics" (land price, buildings, incentives); supplier depth evaluates its "network metrics." Every island-factory tragedy happens where the network metrics are zero.
The Demand Side Is Equally Geographic
All the above is the supply side — where your suppliers are. The other half of site selection is the demand side: where your customers are.
For consumer-facing industries (food and beverage, daily goods), demand proximity is Thünen's problem — look at the distribution of population and purchasing power. But for the intermediate-goods industries that make up the bulk of Chinese manufacturing — components, materials, equipment — the demand side is itself another population of factories. A wire-harness maker's customers are automakers and tier-one suppliers; an industrial-valve maker's customers are chemical plants and water-treatment plants; a carton maker's customers are every factory within fifty kilometers that ships boxes.
This is the second value of full-coverage factory coordinates for site selection: the map is simultaneously a supply map and a demand map. "How many potential customers of mine lie within a hundred kilometers of this candidate site" — for an intermediate-goods manufacturer, that variable outweighs land price by an order of magnitude. And this demand map resolves down to industry categories: the platform's profile system covers 1,965 of them, so you can circle precisely "injection-molding plants within fifty kilometers" or "chemical plants within a hundred kilometers," not a vague "number of manufacturing enterprises."
One additional note: the ring logic of the demand map differs slightly from the supply map's. Supply asks "how close is close enough"; demand asks "how far can I still reach." The same factory can have effective service radii that differ by an order of magnitude across customer groups — high-frequency small-batch customers need doorstep service, low-frequency bulk customers can sit a province away. A rigorous demand map is therefore not one circle but several, layered by customer type — each layer's radius set by the delivery rhythm of that layer's business.
Supply and Demand on One Map: The Complete Form of the Problem
Overlay the supply map on the demand map, and the site-selection problem shows its complete form for the first time. For any candidate location, four questions can be answered at once:
- How deep is my upstream (materials, outsourcing, supporting services) in each radius ring?
- How dense is my downstream (customer-industry factories or consumer markets) within serviceable range?
- How are my peers distributed (competitors, but also the source of the labor pool and knowledge spillovers)?
- Are the shared resources I depend on (skilled workers, logistics corridors, testing institutions, hazardous-waste disposal) already sustained by existing industry?
Weber's location triangle becomes, here, a three-dimensional structure centered on the candidate point, layered by industry category, ringed by radius. The theory has not changed. What has changed is that every cell of the structure now holds a real number.
Later we will pull the camera back — from ring analysis of a single location to the national scale: what did the algorithm find when it went looking for structure among 3.45 million points on its own? Before that, let us first spread the concept of the supplier radius out across industries.
8. A Spectrum of Supplier Radii: Five Spatial Grammars of Supply Chains
The supplier-radius chapter gave the concept and two measured numbers. This chapter widens the view: different broad classes of manufacturing follow entirely different spatial grammars in their supply chains. Reading your own industry's grammar correctly is the precondition for using the five maps well. Below are five typical grammars — most industries will find their primary or hybrid form among them.
Grammar One: Hub-and-Spoke — the Gravity Field of the Anchor Plant
Automobiles are the archetype. An automaker is a gravity center: just-in-time delivery measured in hours locks the suppliers of large components — seats, dashboards, bumpers — within a one-hour ring; tier-two and tier-three suppliers spread outward in successive rings, forming a layered gravity field centered on the anchor plant. Construction machinery, large agricultural equipment, and rail equipment follow the same grammar, differing only in how tightly the rings are drawn.
Under this grammar, site selection nearly reduces to a geometry problem: your tier in the supply hierarchy determines the radius you are permitted to stand in. Tier-ones have little choice — where the anchor goes, they go. The real contest happens at tiers two and three: stand too close and the tier-ones bid up your factor costs; stand too far and your response time disqualifies you. More consequential still is the trend toward multi-centered fields: when your customers include more than one anchor plant, the optimum is no longer hugging any one of them but a weighted position among several gravity centers — a calculation that hand-waving gets badly wrong, and precisely the home turf of ring-based computation. Hub-and-spoke industries carry one more lethal trait: the center moves. When an automaker reshuffles its capacity, one announcement can depreciate an entire region of suppliers — the "customer concentration" signal from the risk chapter deserves its highest sensitivity here.
Grammar Two: Mesh Symbiosis — the Honeycomb of Discrete Manufacturing
Hardware, molds, injection molding, general components — these trades have no single gravity center. Instead, countless small and mid-sized plants are one another's customers and suppliers, woven into a dense web. The mold-injection pair with its "99.7% within ten kilometers" is a classic cross-section of this web. The economics of mesh grammar is high-frequency, small-ticket transactions: a mold repair, a batch of semi-finished parts sent out for a process, an emergency equipment rescue — no single transaction is large, but the frequency is extreme, and none of them can absorb the time cost of long-distance transport. Mesh industries therefore have the shortest agglomeration radii of any grammar; the industrial belt often condenses into one or two towns.
The corollary for site selectors is brutal and clear: mesh industries essentially offer no "island survival" option. Join the web, bring a small web with you (relocating as an ensemble), or do not come. Evaluating a location's fit for a mesh industry is not about "are there peers" but about the density and completeness of the web — the count of each high-frequency counterparty within ten kilometers.
Grammar Three: Process-Anchored — the Pipeline Logic of Heavy Industry
Steel, petrochemicals, basic chemicals, paper, cement — process industries have their spatial grammar set by material flows: bulk raw materials in, bulk products out, transport costs weighing heavily, with processes linked by pipelines, heat, and by-product exchange. These industries are heavily anchored: to ports, to mines, to water, to pipeline corridors — and once set, they do not move for decades.
Process-anchored firms rarely face site-selection problems themselves, but they are the origin points for everyone else's: downstream processing around chemical parks, metal products around steel mills, plastics compounding near refineries — for a large class of midstream industries, the optimal location is "up against a process giant." The key to reading such locations is reading the spillover of by-products and utilities: the pipeline radius of steam, hydrogen, and base feedstocks is a harder constraint than road travel time — and the most substantive line in any park brochure.
Grammar Four: Asset-Light Quick-Response — Consumer Goods Fighting at the Channel's Side
Apparel, small appliances, toys, household goods — the grammar here is set by the rhythm of the demand side. When quick response becomes the competitive core, the supply chain compresses to its limit: fabric, trim, printing, and sewing must complete sampling and repeat orders within a same-day round-trip circle. E-commerce and livestreaming push the logic to its extreme — the Cao County and Baigou stories in the atlas chapter are both "channel rhythm reshaping space."
The peculiarity of reading maps for these industries: the weight of logistics nodes crushes everything else. The location of express-delivery sorting hubs, cloud-warehouse pricing, and trunk-line speed matter far more than the traditional "downstream factory density." Their demand map is not a factory-distribution map but an overlay of channels and fulfillment networks — the same five maps, wearing a different face of weights.
Grammar Five: Knowledge-Intensive — the Engineer Radius and the Equipment Radius
Semiconductors, precision instruments, medical devices, aerospace components — here transport costs are nearly negligible (value density is extreme), and the spatial grammar is set by two scarcer things: engineers and special equipment. The engineer radius means the metropolitan circles where high-end talent is willing to live — these factories struggle to leave the gravitational range of major cities. The equipment radius means access to heavy-asset services: testing, trials, cleanroom processing — the queue time for an imported testing machine can cost a hundred times more than freight.
Knowledge-intensive industries agglomerate in "island chains": not contiguous belts but archipelagos of parks scattered across the suburbs of several large cities, held together by talent markets and shared equipment. The hint for site selectors: for these industries, administrative rank and city tier become relevant again — not because of policy, but because talent and public technology platforms naturally grow there.
Hybrid Grammars and Grammar Drift
Real firms often straddle grammars: an automotive-electronics plant lives half in hub-and-spoke (following the automakers) and half in knowledge-intensive (competing for engineers). A quick-response apparel firm that grows big and integrates fabric production slides from grammar four toward grammar two. More important, grammars drift as industries evolve: photovoltaic modules slid from knowledge-intensive toward process-anchored cost competition within a decade, flipping the site-selection logic entirely.
So the real conclusion of this chapter is methodological: diagnose the grammar first, then compute the space. With the same coordinate data, a wrong grammar diagnosis means wrong weights, and wrong weights mean precisely computed error. That diagnostic step remains mostly human — it rests on understanding the industry. AI site selection does not mystify data: the data computes each grammar cleanly, but "which grammar your industry is speaking" deserves a real conversation between the owner and the analyst first.
9. 1,572 Clusters: The Chinese Industrial Map Rediscovered by Algorithm
If the preceding chapters held a magnifying glass over the rings around a single location, this chapter lifts the camera to ten thousand meters and asks a bigger question: how many industrial clusters does China actually have, and where are they?
The question sounds as if it should have been answered long ago — after all, "industrial belt" and "industrial cluster" are among the highest-frequency terms in China's economic narrative. But press the point: where is the complete national list of clusters? Where are each cluster's spatial boundaries drawn? The answer: they do not exist. What exist are government-designated lists (organized by administrative application), trade-association directories (organized by membership), and the "industrial belt" sections of media and e-commerce platforms (organized by convention). Each has value, but none was measured with the same ruler — and none was grown out of the actual spatial distribution of firms.
In mid-2026, the Tianxia Gongchang Industry Research Institute ran an experiment: presuppose no list at all, and let the algorithm search for structure directly among 3.45 million factory coordinates.
Method: Let the Data Speak
The methodology fits in one paragraph, because it uses only the classical tools of economic geography — no black boxes.
Step one: divide the country into a uniform spatial grid and count each grid cell's factories by industry. Step two: for every cell, compute the standard metric of economic geography — the location quotient: how many times more concentrated an industry is in this cell than the national average. A location quotient significantly above one means the industry's density here far exceeds what "random scattering" would predict — genuine agglomeration exists. Step three: connect adjacent cells whose location quotients exceed the threshold — agglomeration does not stop neatly at grid lines, and adjacent high-density cells belong to the same cluster. Each connected region that emerges is an industrial cluster surfacing naturally from the data: with its own spatial boundary, firm roster, dominant industry, and scale.
The method's key property is that it is unsupervised: the algorithm does not know in advance that "Anping does wire mesh" or "Guzhen does lighting." It sees only point density. What it finds can therefore be validated in reverse — if it failed to find even the famous belts, the method would be wrong; if it finds things beyond the famous lists, those things deserve to be taken seriously.
Results: 1,572 Clusters, and Two Surprises
The algorithm identified 1,572 industrial clusters nationwide.
The first validation was reassuring: we checked the algorithm's output against the list of 77 well-known industrial belts our content team has long maintained — all 77 were rediscovered by the algorithm: Anping's wire mesh, Guzhen's lighting, Keqiao's textiles, not one missed. The method holds.
The real value lies in two discoveries beyond the lists.
Discovery one: 223 "unnamed clusters." The algorithm found 223 high-density agglomerations that appear on no known industrial-belt list. Most sit in the counties of central and western China and third- and fourth-tier cities; they are smaller than the famous eastern belts, but structurally identical: a single industry highly concentrated, with its own ring of suppliers. We manually sampled a batch — inspecting firm names and products one by one — and every sampled case confirmed the algorithm's judgment: these are real industrial clusters that have simply never entered public narrative. They are the dark matter of China's industrial geography: objectively there, exerting gravity, never yet illuminated.
For site selectors, these 223 unnamed clusters may be the most commercially valuable information in this essay. The agglomeration dividend of famous belts has long been priced into land and competition; an unnamed cluster means the dividend is still there and the cost has not yet risen — the skilled-labor pool and initial suppliers exist, but land and wages are still at inland-county prices. The smartest moves of the industrial-transfer era are often not into the core of a famous belt (too expensive), nor onto the blank slate of a new park (too lonely), but into these growing unnamed clusters — the only problem being that you must first know where they are.
Discovery two: 88 cross-county clusters. Among the identified clusters, 88 clearly span county-level administrative boundaries. This is the empirical proof of the "statistical wall": these 88 clusters are chopped into fragments in any county-based statistics, and their full scale is visible only at coordinate scale. Some sit astride prefecture-city borders — governments on each side court investors separately and count output separately, while the market long ago stitched the two sides into one organism.
Cluster Profiles: From "Lit Up" to "Read"
Identifying clusters is only the first step. Because every coordinate point carries a full firm profile, each cluster can generate a "cluster profile":
- Dominant industry and product structure. What does this cluster actually make? Single-category depth, or related diversification? Aggregated from member firms' categories and product descriptions.
- Scale spectrum. How many leaders, mid-sized firms, and long-tail workshops? A cluster of nothing but long tail and a cluster with anchor firms are entirely different ecological niches.
- Supplier completeness. Using the methods of earlier chapters, measure the depth of each supporting category inside and around the cluster.
- Growth signals. The inflow rate of newly registered firms and outflow rate of deregistrations — is the cluster expanding, steady, or hollowing out.
Line up 1,572 such profiles and an unprecedented picture appears: the complete spatial spectrum of Chinese manufacturing — from the mega-clusters of the Pearl River Delta to the nameless mountain clusters of northern Guizhou, measurable, comparable, and rankable with one ruler for the first time.
What This Map Means for Site Selection
Back to the main thread. For site-selection decisions, this algorithmic map provides three capabilities traditional methods cannot.
First, candidate-set generation. Traditional candidates come from investment invitations and personal acquaintance — essentially "whoever found me." The cluster map lets a firm enumerate instead: "rank every cluster in the country related to my industry by supplier depth, competitive density, and growth" — the candidate set goes from three or five to the full population.
Second, judging cluster life stages. Following agglomeration is right, but timing matters. A growth-stage cluster (net firm inflow, suppliers thickening fast) and a mature or hollowing cluster are entirely different environments for a newcomer. Continuously updated coordinates turn "what stage is this cluster in" from a feeling into a data question.
Third, vision across boundaries. The 88 cross-county clusters remind us: the optimal landing spot may be the county next door to a famous belt — sharing the same labor pool and supplier ring at a fraction of the land cost. Such "cluster-edge arbitrage" opportunities can only be found systematically on a coordinate map that ignores administrative lines.
The map exists; the ring-analysis tools exist. Later chapters assemble it all into the core question: how exactly does AI do site selection.
10. An Atlas of Industrial Belts: Rereading Famous Names Through Coordinates
The cluster-identification chapter covered method and totals. This chapter reads differently: pick several belts whose names everyone knows, and describe what became legible once they turned from legend into coordinates. These details showcase the data, but more importantly they are reading lessons for site selectors — each section ends in an actionable judgment.
Anping Wire Mesh: The Best Textbook of Data Honesty
Anping County, Hebei, is the country's largest wire-mesh cluster — from farm netting and fencing to high-end filtration and sintered mesh, one county covers nearly every industrial meaning of the word "mesh." Our coordinate base shows 4,712 wire-mesh factories in and around Anping — sitting on just 1,139 distinct locations.
That "4,712 versus 1,139" is the origin of the dual-metric discipline stressed throughout this essay: Anping's mesh industry is rooted in villages, and large numbers of village workshops resolve only to village center points, stacking dozens of factories on a single dot. Read together, the two numbers actually reveal Anping's truest industrial form — extremely dispersed village industry: not tidy standard plants in a park, but a network of family factories spread across hundreds of villages. For buyers, this means enormous supply elasticity (capacity hides in countless small shops that brokers can mobilize quickly in peak season) but limited per-factory scale and consistency — large orders need a trader or lead factory for quality consolidation. For site selectors, it means the way to "enter" Anping is not to buy land and build, but to embed into the village network — a finishing plant or QC center beats building another production base.
Zhongshan Guzhen: One Town's Global Pricing Power
Guzhen town in Zhongshan, Guangdong — "China's lighting capital" — a township-level unit carrying the densest stretch of the national lighting industry. Through coordinates, Guzhen's spectacle is boundary spillover: lighting firms have long overflowed the town line into neighboring Henglan and Xiaolan and across the river into Jiangmen, forming a contiguous high-density region across administrative borders — a textbook specimen of the cross-county-cluster phenomenon. The spillover's direction is not random: density decays slowest toward cheaper land and closer logistics trunk lines.
The judgment for site selectors: entering a mature cluster at its zenith, every mu of core-area land charges a premium for the "cluster brand" — the brand belongs to Guzhen, but the business need not happen there. Follow the direction of slowest density decay and find the position "one step away" — sharing the labor pool and supplier ring, one price tier lower on land. That is cluster-edge arbitrage drawn on a real map.
Keqiao Textiles: The Dual-Core of Market and Factory
Keqiao, Shaoxing, hosts China Textile City — one of the world's largest textile trading markets — and its coordinate distribution shows a textbook dual-core structure: one core is the market (the trading cluster of Textile City), the other is capacity (the printing-dyeing and weaving factories), spatially separated yet locked together. The dyeing segment, consolidated into designated parks under environmental campaigns, appears on the map as several unusually dense knots — a living specimen of the policy hand rewriting spatial structure.
The judgment for site selectors: in environmentally sensitive industries (dyeing, plating, surface treatment), the spatial distribution reads not as market logic but as permit logic — capacity is locked inside parks holding environmental-capacity quotas, and park admission slots are themselves scarce assets. For these industries the first question of site selection is always "where are there still quotas," and coordinate data shows directly which knots the existing capacity has been gathered into.
Yongkang Hardware: Category Drift From Hammers to Tumblers
Yongkang, Zhejiang, styles itself the "hardware capital," but the coordinate base's industry labels reveal an interesting drift: the cluster's product center has been moving for decades — from traditional locks and tools, to security doors, then to vacuum tumblers, power tools, scooters. The cluster's "shell" (craftsmen, molds, the underlying metalworking capability) stays stable while the "filling" changes with each market cycle. Similar stories: Chenghai toys drifting toward building blocks and IP derivatives, Danyang eyewear concentrating into lens deep-processing.
The judgment for site selectors: when evaluating a cluster, separate its underlying capability from its current products. The underlying capability (what the local hands know how to do) determines the cluster's vitality; current products are just this cycle's projection of that capability. A cluster that "knows metalworking" is worth far more than a cluster that "is making tumblers" — the former can accompany your pivots; the latter may expire with your category. The year-over-year drift of product descriptions in the coordinate profiles is exactly what lets you peel "underlying capability" from "current products."
Cao County and Baigou: Northern Counties' Counterattack
The industrial-belt narrative has long been dominated by Jiangsu, Zhejiang, and Guangdong, but some of the steepest growth curves on the coordinate map appear in northern counties: Cao County, Shandong, grew two new curves — hanfu costume and performance wear — out of wood-craft processing; Baigou, Hebei, upgraded its bag-and-luggage cluster from stalls to factories on the strength of e-commerce channels. The common traits: low starting point, fast climb, deep coupling with e-commerce platforms — order intake online, capacity organized in the county.
The judgment for site selectors: e-commerce-coupled clusters have a demand map utterly unlike traditional ones — their customers are not within a hundred kilometers but at the far end of the express-delivery trunk lines. Evaluating such locations, amplify the weight of logistics nodes (sorting centers, courier-price lowlands) and shrink the weight of traditional "downstream factory density." The same five maps must be read with different weights for different industries — there is no universal reading formula, which is exactly why site-selection modeling must understand the industry before computing the space.
Zhili Kidswear: One Town's Vertical Universe
Zhili town in Huzhou, Zhejiang, makes children's clothing — to the point where one town supports a striking share of the national supply. Through coordinates, Zhili's spectacle is the spatial density of vertical integration: from fabric and trim markets, printing and embroidery, sewing, to design and pattern-making, e-commerce operations, livestream bases, and express sorting — an entire kidswear chain compressed to the scale of one town. It is the limit case of quick-response grammar: from a design sketch to the first shipped order can be measured in days. Yet such a vertical universe has one hidden fragility: its binding to a single category runs deep. Kidswear demand tracks birth cohorts; the fate of an entire town correlates with one demographic curve — the "customer concentration" signal of the risk chapter, displayed at its most macro.
The judgment for site selectors: vertical-universe clusters are an "enter and get everything" proposition — you need build no supporting links, but you also can hardly take just one piece: their efficiency comes from the coupling of the whole system, and your rhythm must follow the town's. Right for players who live on speed; wrong for those who want to cultivate craft at their own pace.
Shaodong Lighters: Lessons From an Extreme-Cost Cluster
Shaodong, Hunan, holds an absolute share of global disposable-lighter output — an inland county town turned a product priced in dimes into a global business. Shaodong's existence is itself a rebuttal of location determinism: no port, no raw materials, no market proximity — only the cluster's organizational capability of dividing labor to the extreme and squeezing every cent of cost, plus decades of accumulated special-purpose equipment and molds.
The judgment for site selectors: an extreme-cost cluster's moat is "the organizational capital of the entire cluster," not any single factor — meaning it can virtually never be poached away or replicated elsewhere. If such a cluster exists in your industry, do not fantasize about building around it; either join it, or compete orthogonally on product dimensions.
The Atlas's Methodological Summary
Seven names, seven readings: Anping teaches dual metrics, Guzhen teaches edge arbitrage, Keqiao teaches permit logic, Yongkang teaches capability versus product, Cao County and Baigou teach industry-dependent weights, Zhili teaches the trade-offs of vertical coupling, Shaodong teaches the irreplicability of organizational capital. Together they say one thing: industrial belts are not interchangeable "pools of cheap capacity" — each has its own spatial grammar. Reading the grammar before placing your stone is the real use of coordinate data for site selection — the data does not think for you; it gives your thinking, for the first time, an object of sufficient resolution.
And of such belts, the coordinate base has identified more than fifteen hundred — over two hundred of which no one has yet named. The atlas has limited pages; that vast dark matter is left for the readers who truly need it to seek out.
11. Ten Years of a County Town: A Chronicle of an Unnamed Cluster's Growth
Data can identify clusters; it cannot tell the human story inside them. This chapter fills that piece with narrative: the ten-year story of an inland county town. It is fictional — a composite of many real curves we see in the coordinate data. We call it Yunling County. If you have seen a similar story in some inland county, that is no coincidence; it is precisely the universality of these curves.
Years One to Three: A Seed Lands
The story opens without drama. Lao Zhou, a Yunling native who spent fifteen years making plastic molds in Dongguan, decided to move home — for his children's schooling and his parents' old age. He had no grand plans; he shipped a few old machines back, rented a disused grain depot at the edge of the county town, and took the small orders his old customers found too much trouble.
For the first two years, the biggest cost in Lao Zhou's shop was loneliness: a non-standard cutting tool took three days by courier from the provincial capital; when a machine broke, the repairman had to be summoned from three hundred kilometers away; no local hire could run an engraving machine, so he trained apprentices himself. In this essay's language: he was a textbook island factory, every Marshallian externality at zero, surviving on the old Dongguan customer base and the skill in his own hands.
The turn came in year three. Two of Lao Zhou's apprentices finished their training; one stayed, one borrowed money and set up on his own in the yard next door — and Lao Zhou, far from resenting it, passed him the rough machining he could not fit in. The same year, two more townsmen who had been doing injection molding elsewhere came home, for the same reasons: children, parents, housing prices. On the street by the grain depot, the sound of machines began to run together.
Years Four to Six: The Web Weaves Itself
In year five, something happened on that street that Lao Zhou did not think much of at the time but later recognized as a milestone: a repairman specializing in equipment maintenance opened a shop at the corner. He had come following a single job, saw that the street's machines could now feed a full-time repairman, and stayed.
That was the first local fulfillment of "shared intermediate inputs" from cluster theory: when demand density crosses a threshold, specialized service providers appear spontaneously — and this one's arrival dropped every shop's downtime cost a notch at once. Over the following years, the same logic kept cashing in: a hardware and cutting-tool store; a county-level agent for plastic resins; two freight lines running daily to the provincial capital; an accountant who understood molds (every boss wanted him for their books).
At the end of year six, Lao Zhou counted: on this street and the nearby yards, molds, injection molding, and their supports had passed forty firms. County officials came for the first time and asked what they needed. What the bosses wanted was not subsidies — it was upgrading the transformer that kept tripping, and an intersection where a truck could turn around.
Years Seven to Ten: Before and After Being Seen
From year seven, the curve steepened. The trigger was the relentless rise of coastal costs plus the post-pandemic reshuffling of supply chains: Lao Zhou's old Dongguan peers began, in batches, to put "moving inland" on the table — and Yunling, a place that had never existed on anyone's option list, began to circulate at townsmen's dinner tables: forty-some peers there, a repair shop, a resin agent, power enough, roads through, factory rent a fraction of Dongguan's.
Note the transmission mechanism: Yunling's rise ran entirely on the oldest information channel — the hometown network. It works, but slowly, and it has a boundary: a boss not from Yunling would almost never hear of the place. By year nine the cluster had rolled past a hundred firms and the county had duly planned an industrial park — yet in public visibility it remained invisible: in the statistical yearbook it was flattened into one county-level "manufacturing" number; no industrial-belt directory listed it; on the investment-promotion map, its region was still stamped "agricultural county."
This is exactly where coordinate data enters. A cluster like Yunling surfaces in our algorithmic map as a high-location-quotient connected region — no application needed, no media coverage needed; it is enough that those hundred-plus factories are really there, really producing. Of the 223 unnamed clusters in the identification chapter, each hides a similar decade known only to its own townspeople.
In year ten the story entered a new phase: the first firm recruited from outside landed — a mid-sized maker of precision structural parts for appliances, whose owner was not from Yunling but had seen the cluster in the data. He brought automation lines and management systems Yunling had never seen — and new anxieties: he bid up the wage level, and two of Lao Zhou's skilled workers jumped ship. The cluster's life cycle turned to the "late growth" page — dividend and friction coexisting, the next segment of the curve depending on whether these hundred-odd factories can upgrade collectively like the Italians, or grind their margins away in involution like some of their predecessors.
Three Readings of This Story
For the business owner: Yunling in year seven — supports past the passing line, costs still in the lowland, the cluster on its steep segment — is exactly the window most worth betting on in a site-selection model. The catch: through hometown dinner tables you only hear of your own hometown's Yunling. Through data you can see every Yunling in the country, including the ones outside your native network.
For the park: the two things Yunling's county government did right cost almost nothing: it followed the cluster's spontaneous formation (transformer, road, then park), and it did not attempt to "plan" the cluster in year three. The market sows the seed; government's best role is to see it and then loosen the soil around it — and "seeing" is precisely the capability that was missing.
For the observer: Lao Zhou's reasons for coming home — children, parents, housing — remind us that beneath industrial migration lies the most human variable of all: people's willingness to move. The data cannot see Lao Zhou's homesickness; but it can see the results of Lao Zhous voting with their feet. Millions of private decisions aggregate into the steep curves on the coordinate map — industrial geography is, in the end, human geography.
12. Chinese Clusters in the World's Coordinate System: Four International References
China's industrial belts are not unique. Industrial agglomeration is a universal phenomenon of market economies; every industrial nation has grown its own versions and left complete samples of their rise and fall. Setting Chinese clusters in the world's coordinate system clarifies which laws are universal and which endowments are China's own — two judgments that directly affect a site selector's confidence in "how long clusters can still be trusted."
Italy: The Birthplace of Industrial-District Theory
The modern revival of "industrial district" research owes much to economists' observations of north-central Italy in the 1970s and 80s — the so-called Third Italy: Prato's textiles, Sassuolo's ceramic tiles, the Brenta's footwear, where hundreds of family workshops wove flexible networks in small towns and competed globally against big corporations as SME clusters. From this, scholars retrieved Marshall's industrial-district theory and built the "flexible specialization" narrative.
The Italian sample's value for Chinese readers is the completeness of its precedent: over the past three decades, under the twin pressures of globalized competition and generational succession, Italian districts split along two paths — some climbed toward design, brand, and luxury-grade craftsmanship, holding the "Made in Italy" premium; others shrank steadily in cost competition. Where was the divide? In hindsight: districts that kept upgrading their collective assets (craft traditions, regional brand, vocational education) thrived; those that coasted on cost alone were caught, inevitably, from behind. That divide applies almost verbatim to Chinese industrial belts today — the "capability versus product" judgment on Yongkang in the atlas chapter is the same law in Chinese dress.
Japan: Micro-Factory Networks in the City
Tokyo's Ota ward, Osaka's Higashiosaka — Japan's machi-koba clusters are another form: micro-factories of a few to a few dozen people densely embedded in urban blocks, serving big companies' R&D and small-batch needs with extreme machining precision. At the peak, a saying circulated among Ota's thousands of workshops: toss a drawing over the wall, and the part comes back the next day — the world's most extreme rendition of mesh-symbiosis grammar.
Japan's mirror has two faces for China. The bright face: the innovation value of high-density networks — the machi-koba network carried a large share of Japan's "from drawing to prototype" leaps, proving micro-factory webs are not backward capacity but the capillaries of an R&D system. Encouraging, for upgrading Chinese belts. The dark face: the irreversibility of contraction — as masters retired, land prices rose, and successors declined the trade, machi-koba numbers fell steeply over decades, and a network's value decays nonlinearly with density: below a critical threshold, the "drawing over the wall" magic vanishes, and the remaining shops, however excellent, are just islands. A cluster's decline is not gradual; it is a cliff. Sustained net outflow on the time map is the early warning of exactly that cliff.
Germany: The Anti-Agglomeration Distribution of Hidden Champions
Germany offers a counterexample-style reference: Hermann Simon's "hidden champions" — thousands of global leaders in narrow niches — do not cluster spatially. They scatter across small towns nationwide, one per town, deeply bound to local vocational education and family succession. What sustains this anti-agglomeration form is Germany's peculiar institutional infrastructure: the dual vocational-education system turns the skilled-labor pool from a "cluster externality" into a "national public good," and industry associations plus applied-research institutes institutionalize knowledge spillovers — in other words, Germany replicated Marshallian externalities through institutions, partially exempting itself from the necessity of geographic clustering.
For Chinese site selectors this reference reads in reverse: while skilled-labor formation and public technology platforms in China still attach mainly to industrial agglomerations, Chinese firms' dependence on clusters is naturally higher than their German counterparts'. The romantic narrative of "rooting in a small town like a German hidden champion" is moving — but strip away the institutional preconditions, and what awaits you in that small town is not dual-system apprentices; it is a hiring drought. Until the institutional infrastructure fills in, agglomeration remains the main channel through which small and mid-sized Chinese manufacturers obtain externalities.
The United States: Large-Scale Division of Labor and the Reindustrialization Experiment
America's spatial grammar runs at grand scale: the traditional manufacturing belt of the Great Lakes, the automotive corridor of the southern states, West Coast tech manufacturing, the Gulf petrochemical belt — industrial blocks unfold at the scale of states, supplier radii routinely span hundreds of kilometers, digested by dense highway and rail networks and highly standardized supply-chain management. The reindustrialization push of recent years — chips, batteries, strategic industries brought home to new plants — offers a live experiment: when policy tries to "plant" industry where no ecosystem exists, how does it go? The observable answer so far: buildings go up on schedule; ecosystems grow far slower — skilled workers, suppliers, equipment-service networks each arrive more slowly than the subsidies do.
The experiment confirms, from the reverse side, this essay's central proposition: industrial ecosystems are grown, not bought. It also warns park decision makers in China: subsidies can move a firm's landing point, but only ecosystems decide whether firms live — "matching beats persuading," from the reverse-site-selection chapter, holds on the far side of the Pacific too.
Four References, One Conclusion
Italy teaches upgrading; Japan teaches treasuring density; Germany teaches the power of institutions; America teaches the time constant of ecosystems. Returned to the Chinese context, the four lessons compress into one sentence: the density and completeness of China's industrial belts are a world-class scarce asset — but neither eternal nor universally applicable; they must be measured, tracked, and used judiciously. And measuring, tracking, and judicious use are precisely what this essay's toolkit is for.
One aside: China possesses the world's most complete industrial classification span and its densest factory network, yet only recently acquired factory-site-level full-coverage coordinate data — meaning our knowledge precision about our own industrial geography long lagged the sophistication of the industry itself. That gap is now being closed, and the meaning of closing it is written plainly in the rise and fall of the four reference countries: the country that sees its own clusters clearly is the country that keeps them.
13. The Evolution of Tools: Four Eras of Site-Selection Analysis
"Choosing sites with data" is not a new idea. This chapter briskly reviews the evolution of site-selection tooling — what each generation solved and where it stalled — to locate precisely what is new about the "AI plus full-coverage factory-site data" generation, and to answer a common challenge along the way: "hasn't GIS existed for decades?"
Generation One: Maps and Abacuses (the Manual Era)
For most of the industrial age, the tools of site analysis were topographic maps, railway timetables, and abacuses. Weber's location triangle could only be solved by hand in that era: mark the material sources and markets on a map and grind through candidate points against freight-rate tables. Large corporations and state planning agencies could afford teams for such analysis; small and mid-sized firms' site choices ran entirely on the owner's personal knowledge. The bottleneck was obvious: computation and data were both scarce; analysis was a luxury good.
Generation Two: GIS and Commercial Site Selection (the Spatial-Information Era)
In the late twentieth century, geographic information systems turned maps into databases. Layering census, road-network, and land-price data, spatial analysis became batch-computable for the first time. GIS flourished in commercial site selection — retail chains, bank branches, logistics warehouses became thoroughly model-driven; trade-area analysis and gravity models became industry staples.
But industrial site selection never saw an equivalent boom in the GIS era, and the reason was not the tool but the data: the layers commercial selection needs — population, roads, purchasing power — are public or purchasable, while the single layer industrial selection needs most — where the factories are, what they make, how they are doing — never existed. GIS was a powerful engine with no road built for this route. Industrial spatial analysis stayed stuck at the resolution of "provincial statistics plus development-zone directories," and a precise engine idled for decades.
Generation Three: Big-Data Investment Promotion and Enterprise Databases (the Data-Aggregation Era)
Over the past decade and a half, the opening of enterprise credit information spawned a wave of company-data platforms; "big-data investment promotion" and "industry graphs" became buzzwords. The contribution was real: registration, equity, litigation, and operating-anomaly records became batch-queryable for the first time, and due-diligence costs fell sharply.
But for spatial decisions, this generation's ceiling is precisely the theme running through this essay: their spatial anchor is the registered address. Registered addresses are fine for credit checks and systematically wrong for industrial geography — a map of licenses is not a map of factories. Moreover, this generation's industry labels come from registration filings, at a considerable distance from what actually happens on the production line; operating-status updates lag likewise. Together these limits kept "industry graphs" mostly in the role of briefing material — never becoming a working tool that front-line site decisions dared to lean on.
Generation Four: Full-Coverage Factory Sites Plus AI (the Era Now Unfolding)
The fourth generation's recipe has been laid out across this essay: factory-site-level full-coverage coordinates (not registered addresses), attached to continuously verified profiles (not static filings), industry categories aligned with the language of the industrial front line (not registration codes alone) — plus a large language model as the translation layer between human intent and computation.
Worth stressing is the relative scarcity of the recipe's ingredients. The large model is the least scarce — model capabilities converge fast across vendors. GIS-grade spatial computation is mature technology. What is genuinely scarce is the layer that never existed: verified, factory-site-level, full-coverage, continuously updated factory data. That is why this essay spent an entire chapter on "how this data was forged" — the moat of fourth-generation site-selection tooling is not in the algorithm layer but in the data layer. Without it, the most advanced model doing industrial site selection is a genius guessing riddles blindfolded.
No Generation Ever Disappears
A final observation: tool generations do not replace; they stack. A serious site selection today still uses generation one's field visits (measuring the gap between list prices and real prices on foot), still uses generation two's spatial computation, still uses generation three's enterprise due diligence — plus generation four's full-population simulation. New tools never retire old tools; they retire the decision style of "signing off on old tools alone."
The law also runs in reverse: fourth-generation tools will not make site selection fully automatic — they ensure that every minute of your field visits and every face-to-face conversation is spent on the part of the truth that data can no longer approach. The endpoint of tool evolution is not replacing judgment; it is delivering judgment to where it is worth the most.
14. How AI Does Site Selection: One Decision, Five Layers of Computation
The preceding chapters laid out theory, blind spots, and data. This chapter answers the question in the title: how exactly does AI site selection compute?
First, a misconception to dispel. AI site selection is not tossing a request at a large model and letting it name a city from its training impressions — that is divination, not computation. Real AI site selection is a layered computational structure: full-coverage real data at the bottom, interpretable spatial metrics in the middle, and only at the top the model's synthesis and reasoning. The large model's role is to understand the need, orchestrate the computation, and explain the results — not to guess answers from memory. Each layer deserves unpacking.
Layer One: Translating "I Want to Build a Factory" Into a Computational Problem
Site-selection needs never arrive as variable tables. The owner speaks in human words: "I make automotive interior injection parts. My main customers are the automakers in Hefei and Wuhu. My plant is in Kunshan and the costs are killing me. I want to move toward central China, but my key technicians will only follow as far as Anhui."
Inside that paragraph hides a whole constraint set: industry (injection molding, automotive interiors), demand anchors (Hefei and Wuhu automakers), cost motive (land and labor), personnel constraint (relocation radius bounded by Anhui), implicit supplier need (injection molding cannot live without mold repair — recall that 99.7%). AI's first job is to parse this speech into a structured site-selection task: what is the objective function, which constraints are hard, which preferences are soft. This step used to take a consulting adviser a week of interviews; a language model compresses it into one conversational turn.
Layer Two: Generating and Coarse-Filtering the Candidate Space
Traditional site selection evaluates three to five candidates; AI site selection starts from the entire space. Building on the cluster map and ring tools of earlier chapters, the system first coarse-filters: within the geography satisfying hard constraints (here: Anhui and adjacent areas), find all clusters and high-density regions related to injection molding, then filter by a few veto items — reachability of demand anchors (road travel time to Hefei and Wuhu), existence of basic supports (shortest distance to molds and compounding). The coarse filter collapses "anywhere in Anhui" into a dozen candidate areas worth close reading.
The value of this step was covered in the cluster chapter: the candidate set changes from "whoever invited me" to "filtered from the full population." If one of the 223 unnamed clusters happens to match, it surfaces here — whereas in the traditional process it would never appear on anyone's list.
Layer Three: Ring-Based Scoring on Five Dimensions
For each candidate area the system computes ring-layered scores along five dimensions — the modern incarnation of Weber's triangle and Marshall's externalities:
- Supply dimension: the depth of each upstream and outsourced support within ten-, thirty-, and fifty-kilometer rings. For an injection-parts plant: how many mold shops? compounding suppliers? equipment-repair resources?
- Demand dimension: downstream density within serviceable radius. Beyond travel time to the Hefei and Wuhu plants, what other potential customer industries sit within a hundred kilometers — eggs not all in two baskets.
- Peer dimension: the double-edged score of competitor density. Many peers mean a deep labor pool and strong knowledge spillovers, but also order competition and poaching wars. The scoring logic follows the firm's strategy: followers love the crowd; differentiators keep one body-length of distance.
- Factor dimension: the level and supply elasticity of land, labor, and energy costs. This dimension leans partly on public data beyond the coordinate base — the most "traditional" layer of the five.
- Dynamic dimension: the life stage of the candidate's cluster — net firm inflow or outflow, suppliers thickening or thinning. Buying in the growth phase is the plain wisdom site selection shares with stock picking.
Each dimension outputs not an oracular score but a set of checkable facts: 47 mold shops within thirty kilometers; 2 automakers and 311 auto-parts plants within an hour; net peer inflow of 23 firms in three years — every number opens into a roster. Interpretability is not a bonus feature; it is the entry ticket for decisions of this weight: no one moves a factory three hundred kilometers on a black-box score.
Layer Four: Synthesis and Trade-offs — the Model Returns to the Stage
With five dimensions of facts on the table, the large model steps back in to do three things machines-with-tables cannot.
Making trade-offs explicit. Candidates almost never dominate across the board: area A has the deepest suppliers but the fiercest competition; area B is closest to customers but forty kilometers from molds; area C scores seventy on everything. The model's task is not to decide for the firm but to state each candidate's cost structure plainly: choose A, and you save on outsourcing radius while paying a hiring premium; choose C, and you buy balance while betting that suppliers will grow with the cluster.
Scenario simulation. "If my customer moves capacity to Jiangxi in three years, how does each candidate's demand map change?" "If I outsource painting, how much does the supplier constraint loosen?" — each question is one re-run of the five-layer computation, at a cost of seconds. In traditional consulting, each is another billable round of supplementary analysis.
Blind-spot alerts. The model has seen the full cluster archive and can flag what humans would not think to ask: "Your candidates are all in central Anhui, but the data shows an unnamed injection-molding cluster forming in a northern county — clear net inflow over three years, land costs thirty percent below your central candidates. Suggest adding it to the comparison." — pushing the dark matter of earlier chapters proactively in front of the decision maker.
Layer Five: The Verification Loop — the Roster Is the Action
What most separates AI site selection from AI chat is the final layer: conclusions must land on verifiable entities.
The report says "47 mold shops within thirty kilometers." Who are they? What are their names? What do they make? How big? Still operating? — in the Tianxia Gongchang system, behind every statistic stands a roster of firms that can be opened one by one, with contact channels and decision-maker leads attached. The owner can take that roster and start verifying immediately: call, visit, negotiate. The endpoint of site-selection analysis is precisely the starting point of supply-chain construction — and for the first time the two connect seamlessly on the same data.
The Five Layers in One Sentence
Compressed to a sentence: AI site selection = a language model translating human speech into computational tasks, ring-based supply-demand-support scoring over full-coverage factory-site data, the model rendering trade-offs, scenarios, and blind spots back into human speech, and finally a roster of real firms you can verify one by one.
Data at the bottom, the model at both ends, and everything in between is interpretable geographic computation. There is no magic in this structure — only facts that once lay scattered across millions of workshops, finally assembled on one map.
15. Risk and Resilience: Computing Uncertainty Into Site Selection
The chapters so far treated site selection as an optimization problem: finding the best trade-off of cost and network under constraints. But every business owner in 2026 knows the costliest lessons of recent years were not "insufficiently optimized" — they were "insufficiently shock-proof": logistics frozen during the pandemic, production halted by power rationing in extreme weather, an entire line stopped because a sole supplier had an accident. This chapter adds the risk dimension to the framework: a location carries not only expected returns but risk exposures — and exposures, too, can be computed from coordinate data.
Single-Point Dependence: the Commonest and Most Measurable Exposure
The plainest supply-chain risk: a critical input with only one source. Spatially, single-point dependence takes two forms.
The first is firm-level: some outsourced process of yours has exactly one qualified provider within radius. The supplier-depth discussion covered bargaining power and resilience; here is the measurement method: lay out the process list and count eligible providers per radius ring per item; any item scoring one is a red light. A red-light item does not necessarily veto a candidate, but each must map to a contingency — building the capability in-house, locking a long-term contract, or accepting a longer backup radius.
The second, subtler, is area-level: five eligible suppliers within radius — apparently deep — but all five sit in the same industrial park. One park-level event (blackout, lockdown, environmental shutdown, one fire) zeroes all five backups at once. Checking "supplier spatial dispersion" with coordinate data is exactly what registration data cannot do: registered addresses may scatter across five districts while the actual plants sit on one road.
The Cluster-Versus-Dispersion Dilemma, Focused by Data
Agglomeration economics and risk dispersion are natural enemies: Marshallian externalities reward crowding; resilience logic punishes it. Multi-base operation is the standard answer, but inside "multi-base" hides a miscalculation made constantly: two bases sharing one supplier network are, in risk terms, still one base.
True risk dispersion requires the two bases' critical dependencies not to overlap: different outsourcing circles, different logistics corridors, different power grids and water sources, even different extreme-weather zones. This check was near-impossible in the gut-feel era — no one could state the overlap of two candidate areas' supplier networks within fifty kilometers. On full-coverage coordinates it is a precisely executable computation: intersect the two supply maps; the smaller the intersection, the higher the backup value.
Hence a data-driven rule for multi-base layouts: put the primary base where suppliers are deepest and harvest the agglomeration dividend; put the backup base where the supply-network intersection with the primary is smallest and its own supports pass the bar — that is what buying real insurance means. The two objective functions differ, so the chosen locations naturally differ. Picking two bases with one "wherever is cheap" logic mostly buys fake insurance.
The Risk Portrait of the Cluster Itself
Beyond your own exposures, examine the overall risk portrait of the cluster you intend to join. Three signals readable directly from coordinate profiles:
- Customer-structure concentration. A cluster collectively bound to a single downstream — everyone supplying one automaker or one export market — prospers and suffers with it. The product descriptions and industry mix of member firms roughly reveal how deep the binding runs.
- Health of the scale spectrum. A healthy cluster is a forest: canopy, middle story, undergrowth each in place. A dangerous cluster is a lawn with one great tree: when the anchor moves, the whole supplier ring collapses. The recurring script of some inland parks — land a giant, grow a ring of suppliers, giant adjusts capacity, suppliers collectively flatline — keeps validating this signal's weight.
- Inflow-outflow dynamics. Net inflow signals vitality; accelerating deregistration and out-migration is a warning that arrives earlier than any negative headline. Under the risk lens, the time map is not a nice-to-have; it is the emergency-exit lighting.
Climate and Compliance: New Variables Entering the Objective Function
Two more classes of exposure are shifting from "freak accidents" to "variables priced at site-selection time."
One is physical climate risk. Extreme-weather frequency is rising; floods, heat-driven power rationing, and water stress disturb manufacturing ever more routinely. Site elevation, watershed, and grid zone are entering the standard section of multinational site-audit checklists — and writing "the two bases must not sit in the same flood zone of the same river" into a domestic multi-base plan is not excessive caution.
The other is compliance and carbon footprint. Export-oriented firms are being asked downstream to account for product carbon footprints, and the site determines the two largest carbon ledgers: electricity structure and transport distance. Green-power-rich regions' appeal to energy-intensive and export manufacturing is upgrading from "cheap electricity" to "clean arithmetic." This logic only strengthens over the next decade.
Resilience Is Not Free
Honesty requires saying: every hedge above has a price. A backup base is real duplicated capital; dispersed sourcing sacrifices volume discounts; avoiding the densest cluster forfeits a share of Marshallian externalities. Resilience is a premium — whether and how much to pay depends on what one day of stoppage costs your industry and how long an outage your customers tolerate.
What the site-selection framework can do is not decide your coverage level, but put the premium and the payout on the table for the first time: how many single-point red lights this location carries, what the area overlap is, which cluster-portrait signals are flashing yellow. Bearing risk you have seen clearly and bearing risk blindfolded cost the same premium — but they buy two different fates.
16. The Five Maps: The Site Selector's Complete Field of View
Earlier chapters described AI site selection's computational structure. This chapter translates that structure into something more intuitive: five "maps." Every serious site decision should read all five — the reason it never happened before is that at least three of them did not exist.
Map One: the Supply Map
Center on the candidate location, spread out your bill of materials and process list, and interrogate item by item: who can supply me?
The key to the supply map is not "does the province have it" but the ring structure: what exists within ten kilometers (determining the response speed of daily outsourcing), within thirty (the cost of weekly replenishment), within a hundred (the option set for bulk and low-frequency purchases). As established earlier, every input has its own supplier radius — the supply map lights up your entire input list ring by ring.
In the traditional process this map was pieced together from a veteran buyer's address book, its coverage bounded by one career. On full-coverage factory-site data, it is the result of one query — and every point on it can be verified.
Map Two: the Demand Map
Center on the same candidate and draw where your customers are.
For intermediate-goods makers, the demand map is the distribution map of downstream industries' factories — resolvable, as noted, to any of 1,965 industry categories. For consumer-goods makers, it is the overlay of population, channels, and logistics trunk lines. Both share one principle: the demand map sets the ceiling of revenue; the supply map sets the floor of cost — and most site-selection failures come from computing only the floor, never the ceiling.
One frequently missed layer: your customers' customers. A wire-harness maker watches automakers, but automakers' capacity plans follow vehicle sales; a solar-mount maker watches module plants, but module expansion follows power-station installations. Read one layer of the demand map and it is static; read two, and it moves.
Map Three: the Competition Map
Where are your peers, how many, what size, what condition?
The double-edged nature of the peer dimension has been covered; two readings unique to the competition map deserve adding. First, read structure, not totals: two hundred peers within fifty kilometers, all long-tail micro-shops — walk in with scale and technology and you are a category above; three giants holding court — walk in and you are paying tuition into their labor pool. Second, read trends, not stocks: net peer inflow means the market is voting for this location's value; batch deregistrations and relocations mean that however cheap the land, ask why first.
The competition map also has a counterintuitive use: where peers are densest, inspect their suppliers; where suppliers are deepest, inspect the peers — the two maps cross-validate. Deep suppliers with sparse peers often mark a value lowland at a cluster's edge (the cluster-edge arbitrage of earlier chapters); dense peers with thin suppliers may mark a pseudo-cluster propped up by policy.
Map Four: the Factor Map
Land prices, labor costs, energy and water, environmental capacity, logistics trunks — the oldest map, and essentially what investment brochures provide. It still matters in the AI era, but the reading changes: factor data must be read inside the coordinate system of the first three maps.
Reading factors apart from networks is the root of the island-factory tragedy: an island with land at half price repays the savings, doubled, through a decade of operating friction. The correct reading computes network-adjusted factor cost: the same two-hundred-thousand-yuan-per-mu discount is pure profit between two candidates of comparable supplier depth, and a mere prepayment on future friction between candidates whose depth differs by an order of magnitude.
What deserves the closest look on the factor map is actually people: not "abundant labor" in the abstract, but where your industry's skilled workers are. Technicians' distribution follows the industry's historical footprint — which loops back to maps one and three: only where peers and adjacent trades cluster is there a ready-made pool.
Map Five: the Time Map
The first four maps are spatial slices; the fifth adds the time axis: which direction is this area's industrial structure evolving?
The time map's raw material is the coordinate base's continuous updates: registrations and deregistrations, expansions and contractions, the drift of industry composition. It answers: where in its life cycle is this cluster? Are the suppliers here thickening or thinning? How are the peers who landed three years ago doing now? — that last question is close to the highest-value single item in site due diligence: the survival rate of recent entrants is the most honest rating a location can receive. No investment-promotion promise persuades like "nineteen of the twenty firms that came three years ago are still here" — and no risk disclosure stings like "seven remain."
The Five Maps in Concert
Each map answers one question: the supply map asks "can I survive here"; the demand map, "how big can I grow"; the competition map, "with whom do I divide this ground"; the factor map, "what price do I pay"; the time map, "is all of this getting better or worse."
The honest state of traditional site selection: the factor map exists; the supply map lives in address books; the demand map runs on feel; the competition map on hearsay; the time map not at all. The entire meaning of AI site selection compresses into one sentence: all five maps present at once, every point on every map openable and checkable.
As for who needs these five maps most — the coming chapters count them one by one.
17. Space as Strategy: How Location Joins the Competition
The preceding chapters treated site selection as a "find the optimal location" problem. This chapter lifts one level higher: location is not merely a cost item and a convenience item — it is part of competitive strategy itself. From the same industrial map, a cost leader, a differentiator, and a niche specialist should read three entirely different answers.
Location Decides Whom You Compete With
The most overlooked point: choosing a site is also choosing your competitors. Land in the core of an industrial belt, and your quotation will be compared line by line against dozens of peers within ten kilometers — you have automatically entered a game of near-perfect competition. Land at the cluster's edge or in a demand hinterland, and you may face only two or three rivals — but you also lose the cluster's cost baseline: you have entered a game of regional oligopoly. Neither game is superior, but they are played differently: the first is won on operating efficiency and scale; the second on service radius and customer lock-in.
We have seen the mismatch too often: a precision shop that lives on differentiation, lured by cheap rent into a belt famous for high-volume low price, discovers at every customer visit that its craft premium looks "inexplicably expensive" against the neighbors' quotes — the location's context killed its pricing power. Conversely, a standard-parts maker moves into a distant demand hinterland to feast alone, and finds its cost structure defenseless against the courier-delivered prices of cluster-based rivals. Location must be isomorphic with strategy: wherever your competitive advantage comes from, the location should reinforce it — or at minimum not cancel it.
Three Strategies, Three Location Logics
The cost leader's logic is closest to the textbook: enter the cluster, drink fully from the cost baseline of scaled suppliers, and hunt factor lowlands inside the cluster (edge townships, newly opened park extensions). Their use of the time map is the most aggressive — chase clusters in mid-growth, harvest the dividend until maturity, and scout the next stop. For them, site selection is a continuous cost-arbitrage process.
The differentiator's logic is "borrow strength but keep distance": use the cluster's labor pool and suppliers, yet stay a perceptible remove from the cluster's mainstream positioning — physically perhaps ten kilometers, cognitively a full tier. They weigh knowledge-intensive factors more: testing and certification bodies, industrial-design resources, universities and institutes. On their five maps, talent and suppliers outweigh factor costs, and what they watch on the time map is not land prices but whether the cluster as a whole is upgrading toward their tier — upgrading means pursuers.
The niche specialist — the hidden-champion type firm that owns a very narrow category — has the most counterintuitive logic: its customers are national or global, so local demand density hardly matters; its processes are largely self-contained, so dependence on generic suppliers is low; its scarcest asset is a core team that does not turn over for decades. Its optimal location is therefore often "home" — where the founding team is rooted, employee loyalty is highest, and competitors cannot poach. For them, the framework's use is not to relocate but the reverse: to price the opportunity cost of staying, and to design point-fixes for home's shortcomings (say, testing that requires the provincial capital).
Micro-Position Within the Cluster Is Also Strategy
Push the lens closer: inside a single cluster, position still competes. Next to the anchor factory, you conveniently catch spillover orders — and are most easily locked in as a vassal. Next to the wholesale market, information is freshest — and the rent prices that freshness in. The cheap new edge of the park is a bet that the cluster grows your way — and as the atlas chapter showed with Guzhen's lighting, a cluster's growth direction leaves tracks: the contour lines of density gradients are drawn on the coordinate map.
Micro-position has one more underrated dimension: visibility. For trades that live on walk-in customers — molds, prototyping, small batches — "a storefront on the street where the trade clusters" is itself a customer-acquisition channel. This is why some shops pay premium rent to stay on the old street when the new park's buildings are bigger and cheaper: the cost of leaving "the place where you are seen" appears in no financial model, but shows up faithfully in next year's orders.
The Strategic Restatement
Folding this chapter into what came before, the framework's full usage forms three ascending layers: first, compute clearly (the five maps, ring scoring); second, think clearly (industry grammar, risk exposure); third, align with strategy (location isomorphic with competitive advantage). Most site failures happen at layer one for lack of data — but the most expensive failures happen at layer three: choosing your factory's location with someone else's strategic logic.
Data cannot make the layer-three call for you. But it does one precious thing: it rehearses, in advance, the game each candidate location will drop you into — who is there, what playbook they run, where the water level sits. The player who reads the table before sitting down and the player who sits blind are at the same table — with different fates.
18. Who Needs AI Site Selection: Seven Decision-Makers, Seven Usages
The phrase "site selection" tends to evoke only "a company building a new plant." In reality, at least seven kinds of decision makers face essentially the same question — where should production activity happen — in different costumes. This chapter walks through them; if you are one of them, skip straight to your section.
Manufacturers: Building, Expanding, Relocating
The classic scenario, with three trigger types, each with its own emphasis:
- New construction: selecting from zero; all five maps required, the crux being the balance of supply and demand maps — first-time builders most often err by letting the factor map (land, incentives) lead them around.
- Expansion: adding a second base beyond the old plant. The core question is "replicate or complement": copy the old model somewhere cheaper, or plant a forward base beside the customer cluster? The two strategies read the maps entirely differently.
- Relocation: the most painful, because you move with your legacy — how far the veteran technicians will follow, whether the old suppliers come along, how much lead-time slack the old customers tolerate: all hard constraints. The injection-parts case earlier is the archetype: relocation is "optimizing cost and network within the migration radius of your people."
For this class of decision makers, AI site selection's value ranks: candidate-set expansion (seeing positions beyond the invitation list) first, quantified supplier rings second, recent-entrant survival rates third.
Parks and Local Governments: The Science of Investment Attraction
The park is the other side of the site-selection coin. The firm asks "where should I go"; the park asks "who should come to me" — mirror questions on the same data.
Traditional promotion's pain is mismatch: generic incentives, courting whoever appears, landing a jumble of unrelated firms that never become an ecosystem and wither separately years later. Coordinate data gives parks three capabilities. Self-diagnosis: what ecological niche does my location hold on the national map? What can the stock structure within a hundred kilometers support, and what could it never keep alive? Targeted rosters: if my endowment fits a particular link, the national roster of firms doing that link, the cost pressure of their current regions, their decision-maker contacts — promotion shifts from casting nets to point-to-point. Gap-filling diagnosis: where do resident firms' outsourcing needs flow? Which supporting links are the largest gaps worth recruiting for? Turning "chain strengthening" from slogan into a named, addressed gap list.
Brands and Buyers: Laying Out the Supply Base
Brands do not build factories, but they decide "where my supplier base should live." A new category needs contract manufacturers — which cluster? Supply chains need a "China + 1" or in-province backup — which cluster hosts the backup so that risk disperses without sacrificing supplier efficiency?
For them, the cluster archive is nearly bespoke: 1,572 clusters' dominant categories, scale spectra, and supplier completeness laid out in a row — finding a manufacturer becomes matching against the cluster spectrum. Better still, one category usually offers several clusters — Guangdong makes lights, Jiangsu-Zhejiang makes lights, Hebei makes lights — and the scale, cost, and craft gradients between clusters are precisely what purchasing layout decisions need.
Cross-Regional Firms in the Transfer Tide: Where to Receive Yourself
Worth pulling out of the manufacturer class because in 2026 it is the largest cohort: coastal-cost-driven inland moves, the domestic-base reshuffles of firms going overseas, and industry-wide capacity restructuring (the great-migration chapter covers the backdrop).
The cross-regional mover's greatest handicap is the radius of experience: a Pearl River Delta owner is nearly blind to the industrial ecosystems of Hunan, Jiangxi, Guangxi, and must rely on local promotion bureaus' self-descriptions. Here AI site selection plays translator — rendering unfamiliar regions in familiar terms: "this county's hardware supplier depth is roughly your hometown township's ten years ago, but thickening at dozens of net new firms per year." The 223 unnamed clusters benefit this cohort most of all.
B2B Sales and Service Providers: Using the Site Data Backwards
Intriguingly, the same data read backwards serves an entirely different population: know where the factories are, and you know where the customers are.
B2B salespeople selling equipment, materials, software, or logistics to factories practice "reverse site selection": not deciding where factories go, but letting factory distribution decide where their market goes — how to carve sales territories, where to put the branch office, which county fills this quarter's cold-call list. The 100,000+ registered B2B salespeople on the Tianxia Gongchang platform make exactly these spatial decisions daily: circle target factory groups by industry, region, and scale; obtain key-person contacts; turn "working the streets" into working the map. Every map in site selection has a mirror use in sales — the supply map becomes the equipment vendor's customer map; the cluster archive becomes the regional battle map.
Investment Institutions: Space as a Due-Diligence Dimension
Between commerce and research sits another user: manufacturing investors. A fair share of a target factory's value is written into its location — the life stage of its cluster, its dependence on a single regional supply chain, its customer and supplier radii are real assets or real liabilities beyond the balance sheet. The traditional diligence kit holds financial, legal, and commercial workstreams; spatial diligence is becoming the fourth: the target claims "stable supply chain" — coordinate data verifies which radius its suppliers concentrate in and whether an area-level single point exists; the target claims "obvious locational advantage" — the five maps decompose the claim into checkable facts. For investors, this converts stories into evidence; for the invested, a genuinely superior location finally has a language to prove itself.
Researchers and Policymakers: Industrial Geography as an Observable
The last class makes no commercial decisions, but its decisions affect everyone: industrial-policy researchers, regional economists, planning agencies.
For them, full-coverage factory-site data means a generational upgrade in observational precision: the true speed and direction of industrial transfer, the birth, death, and migration of clusters, firm inflows and outflows before and after policy interventions — processes once sensed dimly through provincial aggregates can now be observed directly at coordinate and monthly resolution. Findings like the 88 cross-county clusters are, in themselves, food for thought about the tradition of making industrial policy by administrative unit.
Seven Users, One Map
Seven decision makers, seven phrasings, one dataset and one computation underneath. That is the signature of infrastructure: build one road, and every kind of vehicle drives it. A factory-site coordinate base is to industrial decisions what road-network data is to navigation — there can be a hundred navigation apps, but without the road network there would be none.
Later, a full fictional case walks this toolkit end to end.
19. Reverse Site Selection: Making Park Investment Attraction Scientific
The mirror image of site selection is investment attraction. The seven-decision-makers chapter gave parks one section; this chapter unfolds it into a full method — because in our contact with local parks we find the promotion side hungers for spatial data no less than firms do, and its toolbox is older.
The Traditional Bind: The Economics of Net-Casting
A typical county development zone's promotion team works like this: fix a few "pillar industry" directions (usually derived from higher-level plans plus benchmarking the neighboring county), print a park brochure, then cast the net outward through stationed offices, expos, and referrals. The Achilles' heel is funnel efficiency: contact a thousand firms, and perhaps a few dozen show intent, and a handful land — and those few may share no industrial logic whatsoever, leaving the park, years later, a platter of "a little of everything, a lot of nothing."
The price of the platter park was covered earlier: every resident firm is an island factory, enjoying no agglomeration externality, gone at the first headwind. The team's KPI was met; no ecosystem grew.
The problem is not effort but two information gaps: not knowing what I can nurture, and not knowing whom to seek. Both are exactly what coordinate data fills.
Step One: Niche Self-Diagnosis — Where Does My Land Sit on the Industrial Map
Place the park on the national coordinate map and the first question gains an objective answer: within a hundred kilometers, what is the industrial stock structure? Which industries already have climate here (whose spillover and supplier demand I can receive)? Which have no roots at all (recruited firms would be islands)? What are the neighboring clusters, at which life stage, and where are their supplier gaps?
This step frequently overturns the incumbent "pillar industry" positioning. An inland park's plan proclaims some emerging industry, while the map shows its upstream and downstream nearly zero within two hundred kilometers — no incentive package rows that boat upstream. Conversely, the map may show the park lying in the extension path of a cross-county cluster — building a bridge along the road the market is already walking beats erecting monuments where no road runs. Recall the 88 cross-county clusters: for a park sitting on a cluster's edge, the smartest positioning is often not "founding a new dynasty" but "becoming the spillover-receiving zone of the cluster next door" — sharing its labor pool and reputation while supplying the land and buildings it lacks.
Step Two: Targeted Rosters — Turning "Whom to Recruit" Into a Query
With the niche set, "whom to seek" turns from divination into retrieval: which firms nationwide do this link? Which sit in regions of maximum cost pressure (their willingness to move is highest)? Which scale tiers fit this park's carrying capacity? Which show recent expansion signals?
In a base of 4.8 million profiles and 1,965 categories, this query resolves to a precision that startles traditional promoters — the output is not an industry noun but a targeted roster with firm names, regions, scale signals, and decision-maker leads. Promotion shifts from "waiting for fate at expos" to "customer visits by list," and the funnel's first stage changes magnitude.
The advanced play is gap-filling recruitment: survey resident firms' outsourcing needs, check the coordinate data for links that are "missing locally, thin nearby," and package those links as targeted pitches — "come here, and twenty-seven firms within thirty kilometers are waiting to hand you their outsourcing orders." To a supplier, that sentence outpulls any tax break — because it sells orders, not costs. As noted earlier, suppliers follow order density; gap-filling recruitment simply runs that law in reverse.
Step Three: Delivery and Reputation — the Time Map Is the Park's Report Card
The evidence firms trust most is recent-entrant survival — and for parks this is a mirror with no place to hide: how many of the firms you recruited three years ago remain, and how they fare, is plain in the coordinate data. The existence of this report card forces a shift in promotion logic — from signing-count orientation to survival-rate orientation: better three firms that take root than ten that cannot be kept alive; better the plain truth about the supplier ecosystem than subsidies that cannot be honored, so that matching firms come for real reasons.
Matching beats persuading — the first principle of data-era investment attraction. Mismatched firms leave sooner or later, taking your reputation with them; matched firms grow on their own and recruit others for you.
A Market of Mutual Approach
Set the firm-side and park-side methods side by side and something taking shape becomes visible: a matching market for industrial space. Firms seek positions by the five maps; parks seek firms by ecological niche; both haggle over the same data — the more symmetric the information, the fewer the mismatches, the lower the transaction costs.
Every mature factor market has walked this road: securities on disclosure, housing on listings, hiring on résumé databases. Industrial space — a market far larger — is only now acquiring its matching infrastructure. What its final form looks like is too early to call; the direction is not: when matching efficiency gains an order of magnitude, the beneficiary is not one side — it is the social cost of the entire industrial transfer: fewer empty factory shells, fewer island factories, more clusters growing in the right places.
20. One Complete Simulation: Finding a New Home for a Fictional Injection-Molding Plant
Theory done, tools laid out. This chapter runs a complete sandbox exercise. The case is fictional — the people, firm, and numbers invented for demonstration — but every method and data capability used is real.
The Setup
"Huaheng Precision" (fictional), an automotive-interior injection-molding plant in Kunshan, Jiangsu: two-hundred-odd employees, annual revenue a bit over a hundred million yuan. Customers: automakers and tier-ones in Hefei and Wuhu, seventy percent of revenue; the rest, home-appliance customers around Suzhou. The owner, Mr. Chen, built the plant up from ten second-hand injection machines in 2008.
The trigger is typical: the Kunshan lease has two years left and renewal rents are rising; labor costs climb yearly; and with the main customers in Anhui, daily logistics and response times favor no one. Mr. Chen's plan: move primary capacity west, keep a small Kunshan base for the appliance customers.
His constraints, parsed by the layer-one method:
- Demand anchors: the Hefei and Wuhu automaker groups, ideally within two hours by road.
- Personnel constraint: thirty-plus core technicians, those willing to move mostly Anhui natives — the candidate range locks onto Anhui.
- Hard supplier constraint: injection molding cannot live without mold repair (remember that 99.7%); compounding suppliers ideally within same-day round-trip.
- Cost target: land and labor well below Kunshan — though Mr. Chen adds one clear-eyed line: "Thirty percent cheaper isn't cheap if I wait for molds every day."
Round One: Candidate Generation
In the traditional process, Mr. Chen's candidates would be three: the park where a fellow townsman-entrepreneur sits, plus two development zones that had mailed brochures.
Coarse-filtering on full coordinates paints a different picture. Filtering by "two-hour travel time to Hefei/Wuhu + presence of injection-related industry," eleven candidate areas surface, including: two mature auto-parts agglomerations around Hefei (expected), a growth-stage cluster in Wuhu's Jiangbei (half-expected), and in a central-Anhui county an injection-molding micro-cluster that has never appeared in any promotion narrative — one of the 223 unnamed clusters (entirely unexpected; call it County X).
Round Two: The Five Maps Unrolled
For the four shortlisted candidates (Hefei A, Hefei B, Wuhu Jiangbei, County X), spread the five maps. For demonstration, key differences only.
Supply map — mold-repair depth at thirty kilometers: Hefei A thickest (dozens of options), Wuhu Jiangbei moderate, County X thin but nonzero (a small knot within ten kilometers; thirty kilometers reaches the neighboring city's mold cluster). Compounding: same-day round trips easy from both Hefei areas; County X must reach eighty kilometers out.
Demand map — travel time to automakers: Wuhu Jiangbei best (half an hour to the plant gate), both Hefei areas within an hour, County X at ninety minutes hugging the limit. Second customer ring: the appliance industry within a hundred kilometers of Hefei hands the Hefei candidates a hidden bonus — Mr. Chen's thirty percent appliance revenue need not stay in Kunshan forever.
Competition map — peer density: Hefei A has the most peers and the deepest labor pool, but three peers far larger than Huaheng hold court, and the wage escalation of poaching wars is visible to the naked eye; County X peers are uniformly micro — Huaheng walks in as the leader. On the time axis, all four candidates show net peer inflow over three years; County X's inflow rate, relative to its base, is fastest.
Factor map — land and labor: County X cheapest by a wide margin over Hefei A; Wuhu Jiangbei in between. Recomputed as network-adjusted factor cost, County X's paper advantage shrinks — the radius handicap on molds and compounding, converted into WIP turnover and logistics, eats part of the saved rent every year.
Time map — recent-entrant survival: all four candidates look respectable for peers and suppliers arriving in the past three years; Wuhu Jiangbei's suppliers are thickening fastest — the tier-one group is pulling its outsourcing circle across the river.
Round Three: Trade-offs Made Explicit
Five maps on the table; no dominant candidate — real site selection never has one. AI's product at this stage is not "the answer" but the cost structure of three paths, stated plainly:
- Choose Hefei A = buy the thickest supplier network, at the highest factor cost, as the fourth fish beside three big ones. Fitting strategy: follow and borrow, feed on the ecosystem, forgo regional standing.
- Choose Wuhu Jiangbei = serve the largest customer group at arm's length, betting the growth cluster keeps thickening. Fitting strategy: make response speed the core weapon, bind deeply to vehicle customers.
- Choose County X = trade the lowest factor cost for an "early ambush" position, betting the unnamed cluster grows into climate; the mold radius is an explicit, measurable price, hedged by in-house mold-repair capability or a framework contract with the neighboring city's mold shops. Fitting strategy: cost leadership, and be the local leader.
Note what AI actually changed in this exercise: not picking the "right answer" for Mr. Chen — the three paths map to three corporate strategies only he can choose — but making each path's price fully visible for the first time. In the traditional process, County X never reaches the table; nobody can quote Jiangbei's supplier-thickening rate; Hefei A's poaching risk surfaces only after move-in.
Round Four: From Report to Action
Mr. Chen leans toward Wuhu Jiangbei. The next step is not another meeting but hitting the road with the system's rosters: the full list of mold shops within thirty kilometers (contacts and decision-maker leads attached) — go talk to three; the roster of peers that moved into Jiangbei in the past three years — have a friend arrange two dinners, ask about the real water, power, labor, and government delivery; the compounding-supplier roster — request quotes and compare against Kunshan's current payment terms.
Two weeks later, the first-hand information from those calls and dinners feeds back into the simulation to correct its parameters. Site-selection analysis is not a PDF; it is a compute-verify-correct loop — and what sustains the loop is that behind every number stand real firms you can open one by one.
What the Exercise Shows
This fictional case compresses every point made so far: human speech becoming a computational task, candidate-set expansion revealing an unnamed cluster, quantified supplier radii, the five maps in concert, network-adjusted cost accounting, and the seamless join of analysis to an actionable roster.
If anything remains to add, it is the subject of the great-migration chapter ahead: Mr. Chen is not moving alone. Behind him rolls a migration reshaping China's industrial geography — and site selection is turning from "a rare problem few firms ever face" into "a collective compulsory question for a generation of manufacturers."
21. From Signing to Start-up: The Hundred Days After Site Selection
However handsome the site-selection report, its value is not realized until the factory actually runs. This chapter covers the road from signing to production — the critical moves of landing. It seems to exceed the essay's title, but it is the method's natural extension: the same data gets used three more times during landing.
First Reuse: Cold-Starting the Supply Chain
The most pitfall-ridden phase before start-up is the supply chain's cold start. The old plant's supplier system was honed over a decade and more; the new base's suppliers must build trust from zero — whose quality is stable, whose payment terms flex, whose capacity is real — and every step of trial and error costs real money and delivery risk.
The supply map from the selection phase now becomes the purchasing department's battle map: the candidate-supplier rosters by radius ring were by-products of the analysis all along, with industries, scales, contacts, and decision-maker leads attached. The right cold-start posture is not scrambling after start-up but completing three rounds during construction — screening visits, small trial orders, backup filing. The day the line powers on, every material category should hold a roster of "one primary, two backups." As said before: the endpoint of site analysis is the starting point of supply-chain building — during landing, that sentence is meant literally.
Second Reuse: Settling the People
The second pit is people. The share of the core team willing to relocate and the difficulty of hiring local technicians were "estimates" at selection time; at landing they must become individual human beings.
The underused move here: the distribution of peers and adjacent trades is the distribution of the skilled-labor pool. Which same-trade and adjacent-process factories sit within thirty kilometers of the new base, and their scale spectrum — this directly frames the realistic ceiling of local hiring and marks where to post the recruiting notices. Conversely, if the selection analysis showed a thin local pool, the landing plan must include training systems and mentor-apprentice ladders from day one, rather than being ambushed by labor shortage after opening.
Wage levels, too, can be read from density: where peers are dense, technicians have a market price and poaching has a going rate; where peers are sparse, the first wages you offer become the local price for the trade — set too low, no one comes; set too high, you carry the sedan chair for everyone who follows. All of it hides in that competition map.
Third Reuse: Migrating Customer Trust
Relocation-type landings hold one more underestimated hurdle: migrating customers' trust. Customers care nothing for your handsome new buildings; they ask three things: will supply break during the transition? How long until the new plant's quality consistency climbs back? Does logistics get better or worse?
The demand map's use now is turning answers into visible facts: the travel-time changes to each customer, the newly added serviceable radius, the capacity-allocation plan for the dual-base transition. A practitioner's note: repackage "relocation" to customers as "capacity upgrade plus closer service" — and the best prop for that message is the map showing shortened travel times, provided you truly computed demand proximity into the selection.
The Fourth Thing, Easily Undervalued: Turning Promises Into Paper
One more landing-phase item unrelated to data yet essential to the method: reduce every verbal promise from the promotion phase — power prices, hiring subsidies, permit assistance, the road-completion timetable — into signed, sealed writing. This is not distrust of anyone; it is respect for the objective law that officials rotate and administrations change. Seasoned landing managers know the line: the enthusiasm at the negotiating table belongs to that moment; black ink on white paper belongs to the future. However precise the site analysis, it cannot withstand promises no one honors three years later — and the cost of this insurance is merely a few more meetings before signing.
The Feedback Loop of the Hundred Days
The landing period carries one hidden value: it is a full-scale validation of the site analysis. The analysis said forty-seven mold shops within thirty kilometers; purchasing's legwork found nine usable — that delta is itself data: it calibrates the conversion rate between "profile count" and "qualified-supplier count," so the next simulation (second base, third base) runs on truer parameters. The analysis estimated local wage levels; HR's three months of actual hiring produce the real curve — another calibration point.
Keep feeding landing-period measurements back into the model, and the firm's own "site-selection knowledge base" starts compounding. For multi-base companies the compound interest is striking: the first selection simulates from zero; by the third, you hold complete measured parameters from two live bases. Site-selection capability itself is becoming an organizational asset of the manufacturer — its carrier being data plus judgment trained by data.
Do Not Let the Last Mile Ruin the First Ten Thousand Meters
This chapter compresses into one warning: half of site-selection success is selecting; the other half is landing. We have seen the story too many times — a beautifully chosen location, a sloppy cold start, and six months after opening the firm is ground down by supply-chain and labor friction, concluding bitterly that "this place is no good." The place did not fail them; the landing failed the place.
Data can light every step of the landing. The walking still has to be done step by step.
22. Down to the Actual Plot: A Morphology of Land and Buildings
With the macro location fixed, the last mile holds another set of intensely practical decisions: land or building? Lease or buy? Standard factory or custom-built? These look like minutiae, yet they bind directly to capital structure and exit flexibility, and they interlock deeply with the spatial analysis above. This chapter runs them through one framework.
Lease Versus Buy: Pricing Flexibility
The temptation of buying land and building is tangible: asset on the books, loan collateral, freedom to modify, and the security of "no landlord's face to read." Its hidden price is locking the enterprise onto one coordinate — this essay has argued throughout that the industrial map is accelerating its changes, and owned land and buildings are the heaviest anchor in the face of change.
An operational rule: first use the time map to classify the cluster. If the cluster is in mid-growth and your confidence rests on verifiable trends — buy, and collect the region's appreciation along the way. If the cluster is past maturity, or your entry is essentially cost arbitrage — lease, and keep the option of leaving in hand. The most trapped firms of the transfer era are precisely those that built heavy assets a decade ago in places that have since lost their economics: leaving means fire-sale prices; staying means costs that climb every year. The weight of assets must match the certainty of the location — the more the location resembles a bet, the lighter the assets should be.
Standard Factory Versus Custom: Trading Time for Fit
The standard factory building buys time: move the machines in, produce within months — especially apt for the dual-base parallel phase of a relocation. Its price is fit: ceiling height, floor loading, column spacing, power capacity — something always pinches, and heavy equipment or special processes (constant temperature and humidity, vibration isolation, cleanrooms) often cannot compromise.
Custom construction is the reverse: perfect fit, but start-up slips a year or more, and it demands confidence about "what the line needs three years from now." The prudent path is often two-stage: lease standard buildings to stabilize the business first, spend a year or two validating the location judgment (recent-entrant survival rate — this time you are the entrant), then custom-build once confirmed. The path pays one extra move; it buys capping the maximum loss of a wrong location at the lease term — against the cost of wrong-location-plus-heavy-assets, that premium is usually cheap.
Inside the Park Versus Outside: Services Bundled or Unbundled
Same location, but landing inside a formal park versus on a plot outside differs not in distance but in how services are organized. The park bundles the high-friction affairs — environmental-permit channels, hazardous-waste collection, steam supply, fire-code acceptance — and you pay for the bundle through management fees and higher rent. Outside the park, everything unbundles to your own legs — cheaper land, but every item is time and uncertainty.
The criterion again returns to industry grammar: for environment-sensitive, utility-heavy trades (surface treatment, chemical intermediates), the park is practically the only option — as the atlas chapter noted, these industries' spatial distribution is permit distribution. For general machining and assembly, an existing building outside the park is often the value play — provided property rights, planning use, and fire compliance are checked clean: with a defect in its papers, no compensation will stand on your side when the cheap building is cleared.
One Sentence to Close
Every land-and-building option answers the same question: how much will you pay for flexibility, and how many years will you lock in for certainty. And the quality of that answer rests on your confidence in the location itself — which loops back to this essay's main line: the more fully you see, the more boldly you lock; when you cannot see clearly, stay light.
23. The Site-Selection Self-Check: Thirty Questions Before You Sign
Much methodology has been laid out; at the operating level, the most useful form is a checklist. Below are thirty questions in seven blocks, covering every point made. Suggested use: answer each for every candidate location — every question you cannot answer is a due-diligence gap. The list's value is not scoring full marks; it is showing you how many blanks you still hold.
Block One: Demand and Hinterland
- What is the travel time from my core customers to the candidate site — better or worse than today?
- Within serviceable radius, how many potential customers beyond current ones (counted by industry category, not by feel)?
- Where are my customers' customers moving? What does this demand map look like in three years?
- If the largest customer left or relocated, could this site still sustain me?
Block Two: Supply and Support
- Spread the process list: for every outsourced step, how many options within ten, thirty, fifty kilometers?
- Any "only one option within radius" red-light items? What is the contingency for each?
- What are the supply radius and payment-term ecology of main materials?
- When a machine breaks, where is the nearest person who can fix it, and how fast can they arrive?
Block Three: Peers and Talent
- Peer density, scale spectrum, and operating condition at the candidate — do I enter as leader or apprentice?
- The real depth of the local skilled pool: how many trained workers do peers plus adjacent trades sustain?
- What is the local wage level for my trade — and will my arrival itself raise it?
- Has the core team's willingness to relocate been surveyed? For those not coming, can local hiring fill the posts?
Block Four: Factors and Costs
- Have I obtained both the list price and the real price of land or rent?
- What is the present value of the incentives — and if they all vanished tomorrow, would I still come?
- Power, water, gas, environmental capacity: enough for the capacity plan three years out?
- Recompute with network-adjusted factor cost: will the cheap part be eaten back by supplier-radius friction?
Block Five: Risk and Resilience
- Are my critical suppliers over-concentrated in one park or corridor?
- What is the supply-network overlap between this site and my existing bases — real backup or fake?
- Is the candidate cluster's customer structure bound to a single downstream?
- Have I checked the history of extreme weather, power rationing, and environmental crackdowns?
Block Six: Cluster and Timing
- Where in its life cycle is the candidate's cluster? Net firm inflow or outflow?
- The survival rate of peers who moved in over the past three years — and have I spoken face-to-face with two of them?
- Are the cluster's suppliers thickening or thinning? In which direction is it growing?
- Am I entering in the window, or paying full price for a dividend already priced in?
Block Seven: Strategy and Landing
- What game does this location drop me into? Does the prevailing playbook reinforce or cancel my competitive advantage?
- Can I state each candidate path's cost structure in one sentence?
- Is the cold-start roster ready — one primary and two backups per material category?
- Is the customer-migration communication plan in place? How is transition capacity scheduled?
- The last question, which is also the first: does this decision point the same way from all three witnesses — the data, the site visit, and the veteran — or is only one of them talking?
Answer all thirty and a healthy outcome usually appears: no candidate scores full marks. That is not the checklist failing — it is the checklist working: it reduces "which place" to "which bundle of costs I accept," which is exactly what a major decision should look like. What remains was said long ago: fill the blanks, think the trade-offs through — then you yourself place the stone.
24. The Great Migration Era: Why Site Selection Suddenly Became a Compulsory Question
If industrial geography were static, site selection would be a one-time problem for newly founded firms, unworthy of data and computation this heavy. The reality of 2026 is the opposite: Chinese manufacturing is in its most intense phase of spatial restructuring in decades. This chapter lays out that backdrop — it explains why "AI site selection" has turned, right now, from an interesting technical proposition into an urgent commercial one.
Three Forces Pushing at Once
Force one: the persistent tilt of the cost gradient. The gap in land, labor, and environmental-capacity costs between coastal cores and the inland persists and continues widening. The story is not new — "gradient transfer" has been told for twenty years — what is new is its depth: transfers once led by labor-intensive final steps now move entire ensembles, with molds, surface treatment, and precision machining — the "body-following" support links — migrating together. Ensemble migration means receiving regions' ecosystems thicken at visible speed; a fair share of the 223 unnamed clusters were quietly piled up by this force over recent years.
Force two: the security-driven rebuild of supply chains. Whether externally driven "China + 1" layouts or firms' own multi-base backups, "eggs in several baskets" has moved from big-company luxury to mid-size standard thinking. Domestically, that means second and third bases across provinces; internationally, building abroad while reorganizing the domestic bases' division of labor. Every "multi-basing" is a multiplicative site-selection demand: a firm once chose a site once in a lifetime; now it may be choosing for three bases at once.
Force three: industry's own metabolism. New energy, storage, robotics, the low-altitude economy — new industries plan capacity with no historical baggage, selecting nationwide from day one; meanwhile traditional industries' consolidation, swaps, and exits redraw the map from the other side. Every act of new-old succession lands on the ground as changed coordinates.
The three forces stacked yield one sentence: the refresh rate of China's industrial map has jumped. In the static-map era, a five-year-old industrial-belt directory still served; today, whole regions' supplier depth has changed shape within five years.
Going Abroad and the Re-division of the Domestic Base
Within force two, one branch deserves its own subsection: firms building factories overseas are undergoing an "outside-determines-inside" redo of domestic site selection.
When a company lands assembly or finished-product capacity abroad, its domestic bases change roles: from "produce everything" to "produce what the overseas base cannot" — core components, molds, precision links needing deep supplier ecosystems, plus technical support and material assurance for the overseas lines. With the role changed, the site logic changes: the domestic base's evaluation weights slide from "labor cost" toward "supplier depth and engineer availability" — precisely the deepest moat of China's industrial belts. Hence a counterintuitive phenomenon: the more aggressively a firm goes abroad, the more it needs its domestic base planted in the thickest cluster. The full picture of industrial transfer was never the word "leaving" — it is a re-division of labor across borders, and each side of the division is a site-selection question.
The Information Asymmetry of the Migration Era Cuts Both Ways
The great migration magnifies a structural problem: senders and receivers cannot see each other.
Firms cannot see the receiving regions: pushed outward by costs, Pearl River Delta and Yangtze Delta owners perceive the interior at province-level resolution — "Jiangxi is cheap," "Hunan has policies" — impressions that cannot support a decision specific to coordinates. The experience-radius problem hits hardest exactly here.
Receivers cannot see the firms: inland parks know the coast holds masses of firms seeking exits, but not which ones, in which links, squeezed by which costs, needing which supports. So they broadcast themselves with the crudest instruments — land, buildings, taxes — precisely the promotion language that (as covered) systematically dodges the ecosystem.
Two-way blindness produces mass mismatches: firms land where they do not belong; parks recruit what they cannot sustain. The social bill is enormous — idle plants, empty promises, and saddest of all, clusters that might have grown into climate but never formed an ecosystem because the first cohort chose each other wrongly.
Full-coverage factory-site data, in this context, is the mirror that lets both sides see: firms see each candidate region's real ecosystem (not the brochure's rhetoric); receivers see who nationwide genuinely fits (not whoever walks in). Information symmetry cannot erase the pain of migration, but it can sharply reduce the mismatches born purely of not seeing.
The Matter of the Window
One more time-critical point deserves saying straight: the window of agglomeration dividends closes.
Krugman's self-reinforcement logic holds in receiving regions too: as an inland cluster matures from "showing promise" to "fully supported," land and wages ride the maturation upward. The earliest movers capture the widest price gap and bear the largest supplier risk; by the time the cluster is famous and the brochures eloquent, the dividend has been priced. That is why the cluster chapter called those 223 unnamed clusters possibly the most commercially valuable information in this essay: they mark where the window still stands open. Identifying them requires no prophecy, only observation — the pace of net firm inflow, the progress of supplier gap-filling, all readable month by month in coordinate data. In the migration era, seeing half a year earlier means land prices others cannot get and positions others cannot take.
From Individual Decisions to Collective Phenomenon
Pull the lens to its widest: hundreds of thousands of individual siting decisions, summed, are the next decade of China's industrial geography. The final pattern of this round of restructuring — which clusters rise, which shrink, where the belts' center of gravity drifts — is not yet settled; it is being voted on daily by every relocation, expansion, and landing.
For a single firm, this means site selection has shifted from "a once-in-a-lifetime bet" to "a continuously tracked discipline." For observers, it means something thrilling: rarely in history has one been able to watch, at this resolution and in real time, a great manufacturing nation rearrange its own spatial structure. The daily flicker of 3.45 million coordinate points is that restructuring, live.
Of course, however clear the broadcast, there are places it cannot illuminate. The next chapter speaks honestly about this method's boundaries.
25. Boundaries and Honesty: What AI Site Selection Cannot Compute
An essay that speaks only of capabilities is advertising; one that delimits its boundaries is research. This chapter lists what AI site selection cannot do — not as boilerplate disclaimers: every item is a pit that real usage must steer around.
It Cannot Compute the "Real Transaction Price" of Factors
Coordinate data can compute supply, demand, competition, and support in fine grain, but the most decisive numbers on the factor map — the actual closing price of land, the actual delivery rate of policies, the actual difficulty of environmental approval — live in no database. Between listed and closing land prices, between policy text and policy delivery, between the service guide and the service experience lies a distance measurable only by face-to-face negotiation and site visits. The factor costs AI site selection reports are always "list prices"; the gap between list and real must be closed on foot.
It Cannot Compute Human Willingness
In the case study, Mr. Chen's thirty core technicians willing to follow him to Anhui — that constraint was interviewed out, not computed out. Whether the veteran masters will move, whether they stay after moving, how the family's schools and hospitals arrange themselves — for relocation cases these variables are often veto-grade, and they live entirely outside the data. Also outside: the temperature of local government-business relations, township-level labor customs, the friction costs of dialect and management culture. Site selection is finally a question of where people settle their homes; data draws the candidate set, and human hearts cast the deciding vote.
It Cannot Compute Policy Turns
Industrial policy, environmental standards, energy quotas, the trade environment — top-down variables that can rewrite a region's site logic overnight. Coordinate data is bottom-up observation: it reads the consequences of a policy turn quickly from firm inflows and outflows after the fact, but it cannot predict the turn itself. Whoever uses "model simulation" as "policy prophecy" will fall at the next bend.
Three Known Limits of the Data Itself
The largest limitation of our own data was disclosed early — the village-center-point merging of township addresses and the corresponding dual-metric discipline (company count and distinct-location count reported together). Two more:
- Profile lag. Registrations and deregistrations have official records to follow, but a lag exists between "actually stopped production" or "actually moved" and the profile update. We compress the lag with multi-signal cross-validation, but it is not zero — for a single firm, the profile is a lead, not a verdict.
- Category edge cases. However fine 1,965 categories cut, some firms straddle boundaries, or have pivoted their product mix faster than their labels. In ring statistics, individual label errors wash out in large numbers; but if your analysis hinges on "the precise count of one micro-category in one small area," read the result as an interval, not a point.
Algorithmic Discovery Is Not Commercial Judgment
The 1,572 clusters and the 223 unnamed ones are this essay's brightest numbers — all the more reason to pour cold water here: the algorithm identifies spatial agglomeration, not commercial opportunity. An unnamed cluster may be a rising value lowland, or a huddle of low-end capacity squeezed between environmental rules and costs; net firm inflow may signal a thriving ecosystem, or merely the suction of a short-lived subsidy. From "there is agglomeration here" to "this is worth going to" lies industrial judgment, field verification, and timing — three things every chapter has stressed, restated here one final time: the output of AI site selection is a better question list and a more complete candidate set, not an answer exempt from inspection.
A Note in Passing: How to Cite This Essay's Numbers Correctly
These numbers will be quoted, and quotation erodes precision, so the citation rules go on record here. 4.8 million is the total factory archive the platform covers; 3.45-plus million is the subset with valid factory-site coordinates; 3.14-plus million is the in-operation subset of those — three different calibers, not interchangeable. The 1,572 clusters are the identification result under one method and one set of thresholds; different parameters would yield a different count — trust the magnitude, not the last digit. The two co-location ratios — beverage plants 70.3%, mold shops 99.7% — are bound to their radius calibers (twenty kilometers and ten, respectively); quoted without the radius they mean nothing. All density figures should travel with their dual metrics. We have seen too many studies stripped of their calibers in circulation until only one naked large number remains — if this essay's numbers are destined to travel, we hope they at least travel with their luggage.
Why We Insist on Writing This Chapter
Because site selection is a heavy decision. Light decisions tolerate over-promising tools — recommend the wrong song and three minutes are lost; choose the wrong factory site and a decade is. For those who build tools for heavy decisions, exaggerating capability injures people.
And because honesty is precisely this methodology's competitive edge. The root disease of the traditional site-selection information ecology (as covered) is that every party states selectively: promoters report the good news, brokers speak only of perfection, veterans generalize from fragments. Only data that writes its own limits on its face deserves to become the neutral reference point in that game. The rules the Tianxia Gongchang Industry Research Institute set for itself — density always dual-metric, numbers always traceable, uncertainty always labeled — are not moral vanity; they are the foundation of this business.
Boundaries stated. The remaining chapters return to ourselves: what Tianxia Gongchang has actually done here, and what it will do.
26. Twelve Hard Questions About AI Site Selection
Before finalizing, we walked this method past friends of different backgrounds — owners, park promoters, investors, supply-chain professionals, academics. Their sharpest and most frequent challenges deserve a chapter of answers. Some were foreshadowed above; here they are retold from the asker's seat.
Q1: My industry is peculiar — does a generic framework apply?
The framework generalizes; the parameters do not. The five-map structure holds for all manufacturing, but each map's weights, each support's radius, each dimension's passing bar swing wildly by industry — in the atlas chapter, e-commerce-coupled clusters and permit-bound clusters read as two different worlds. A serious simulation therefore always begins with "understand your process list and customer structure," never with a generic score. And for "peculiar" industries, full-population data is worth more, not less: however few your peers, among 3.45 million coordinates they can be found one by one.
Q2: How often does the data refresh? Am I looking at a stale map?
Profiles and coordinates update continuously; registrations, deregistrations, and status changes roll in. The honesty chapter said it: "actually stopped" beyond official records carries a lag — treat a single firm's profile as a lead, verify on site. But what matters to a site decision is trend-level freshness — a cluster's inflow and outflow, its suppliers thickening or thinning — and aggregate signals are quite insensitive to that lag. In short: for a single point, the profile may run months late; for the tide, this map is newer than any alternative on the market.
Q3: Won't AI send everyone to the same "optimal spot," which then stops being optimal?
A good question — the classic composition fallacy worry about recommender systems. Three layers of answer. First, the objective function is intensely personal: industry, customer anchors, personnel constraints, strategic posture — different inputs, naturally scattered outputs. Second, the data carries negative feedback: as firms pour into a location, the time map faithfully shows rising competition and factor prices, and later simulations mark it down — the same mechanism as word-of-mouth, with the feedback cycle cut from years to months. Third, even granting local convergence: the firms "sent to the same place" are one another's upstream, downstream, and peers — their crowding is precisely what creates agglomeration externalities. Manufacturing is not musical chairs; most of the time, "everyone coming" is not congestion but ecosystem.
Q4: Can a small firm afford this, or is it a big-company luxury?
Consulting-style site selection was indeed a luxury — fees in the hundreds of thousands and beyond, never consumable by SMEs, which is exactly why their siting ran on hometown word-of-mouth. What data plus AI changes is the cost structure: one simulation's marginal cost approaches one conversation. Of the 100,000+ registered salespeople on the Tianxia Gongchang platform, the overwhelming majority serve small and mid-sized factories — this data grew from day one in the shape of "affordable to ordinary businesspeople." The democratization of site-selection capability benefits not the giants (they could always buy consultants) but the small factories that used to run on luck.
Q5: How do park incentives enter your framework?
Incentives belong on the factor map, discounted twice before booking. The first discount is the delivery rate: as the boundary chapter said, the distance between policy text and policy delivery cannot be measured by data — measure it on foot. The second is duration: tax breaks have expiry dates; supplier ecosystems do not. Incentives are a one-time entry bonus; the network is an annuity. Our suggested arithmetic: discount the incentives to present value, set them beside network-adjusted factor cost in one table, then ask one question — if this incentive vanished tomorrow, would I still come? If the answer is no, you are siting for the subsidy, not for the business — and history has buried enough capacity in the graveyard of expired subsidies.
Q6: Doesn't the data itself carry bias — say, worse coverage in some regions?
Every data asset has coverage boundaries; our principle is disclosing the known ones: township center-point merging (the origin of the dual-metric rule), profile lag, category edge cases — all detailed in the main text. As for regional coverage: the coordinate base was built by one nationwide pipeline, with no structural tilt toward developed regions; if anything the reverse — the never-named clusters of inland counties are precisely this data's most exclusive holdings.
Q7: How does this relate to official industrial plans? Will they conflict?
Complementary, with different jobs. Plans answer "where policy hopes industry goes"; coordinate data answers "where industry actually is, and where it is actually heading." When the two align, sail with the wind. When they diverge, the divergence itself is information: where policy pushes but the market has not moved, ask what is missing; where policy is silent but the market clusters spontaneously (say, those two-hundred-odd unnamed clusters), the plan's next revision is often hiding. The smart usage is overlaying both maps, not choosing one.
Q8: Why not just tell me the best answer? I want one place-name.
Because "best" depends on who you are. In the case study, three candidates mapped to three strategies; the data priced each path clearly, but "what kind of company do I want to be" is a question no model on earth has standing to answer for you. Any site-selection service that names one answer on the spot is either selling you its own inventory or hiding the complexity so you can step in the holes yourself. We treat "no single answer" as professional ethics, not incapacity.
Q9: I'm not moving or building — what's here for me?
Site selection is only this data's most dramatic use, not its only one. As the seven-decision-makers chapter showed: B2B salespeople use it to find customers and carve territories; buyers to find suppliers and compare clusters; brands to lay out contract manufacturing; researchers to watch industry shift. Factory coordinates are the base map of "where production happens" — any business touching factories touches this map.
Q10: Does this method help with building factories abroad?
The methodology transfers fully — five maps, supplier radii, cluster life cycles hold in any country; the data asset currently cultivates mainland China. For firms going abroad, today's use is "mapping inward to project outward": the first step of an overseas layout is deciding what the domestic base keeps and what travels — exactly the home game of domestic coordinate data. As for the destination country's industrial geography: our methodology plus local data sources is a direction we watch — no boasting today.
Q11: Privacy and compliance — can your data be used this way?
Coordinates and profiles come from publicly verifiable, compliant sources; contact channels are de-identified and tiered by authorization. More fundamental is the nature of the use: this data serves productive firm-to-firm connection — salespeople finding customers, factories finding suppliers, parks finding projects — the classic use of commercial information infrastructure. Our investment in compliance runs at the same order of magnitude as our investment in the data itself, because the premise of this business is being trusted, sustainably, for the long term.
Q12: Bottom line — AI site selection versus a seasoned old master: who wins?
Each owns a segment; together they win. The old master owns the parameters — which park keeps its word, which county's hands are skilled, what discount each policy promise deserves: the gap between list and real that data cannot see. The data owns the coverage — no master's experience radius spans 3.45 million coordinates; he does not know the unnamed cluster growing in northern Anhui, nor can he state the overlap of two candidates' supply networks. The ideal combination was demonstrated in the case chapter: data generates candidates and trade-offs; people verify and decide. What gets eliminated is neither — it is the decision style that has neither data nor an old master, which is to say, the way most site selection was actually done.
27. Factory Discovery and Site Selection: One Dataset's Twin Flywheel
This essay cast "AI site selection" as the protagonist, but in Tianxia Gongchang's product landscape it has a symbiotic twin — "AI factory discovery." This chapter clarifies their relationship, because the relationship itself is the key to where this data asset goes next.
Two Questions on One Map
Factory discovery asks: "where are the factories that match my criteria?" — given conditions, search the stock. Site selection asks: "where should my factory be?" — given yourself, simulate the position. The two questions share one base map (4.8 million profiles, 3.45 million coordinates, 1,965 categories) but run in opposite directions: discovery reads out of the map; selection projects yourself into it.
Opposite directions, mutual reinforcement. Every day of the discovery business maintains the selection capability's foundations: every call a salesperson places, every factory a user verifies, is crowdsourced feedback into the verification stage — dead numbers, moved plants, pivoted product lines flow back into the data layer and raise the map's refresh rate. Conversely, as the selection capability matures, it brings new user groups onto the map — builders, park promoters, brand buyers — whose usage generates new verification and demand signals.
Search feeds the data, data feeds the simulation, simulation brings new users, new users feed the data again — a textbook twin flywheel, and it spins only because both businesses genuinely share one underlying asset rather than each erecting scenery.
One more cog in the flywheel deserves note: content and research. The industrial-belt studies, industry inventories, and deep reports the Institute keeps publishing — this essay included — are themselves an outlet of the data asset: they translate the map's findings into public knowledge, and public knowledge walks new questioners back to the map. One dataset feeding product, research, and public discourse at once, the three calibrating one another — that may be the best footnote to the word "infrastructure."
What It Means for Users
For users, the flywheel's meaning can be said plainly. The salesperson using AI factory discovery gets roster quality boosted by the selection side's deep digging into clusters, supports, and status signals; the owner using AI site selection leans on data freshness polished by the discovery side's millions of daily real uses. Use either end, and you enjoy the positive externalities of the other end's users — which is, logically, the very Marshallian externality this essay spent tens of thousands of characters on: density produces quality. Having written so much on agglomeration economics, we find our own product lives inside one — this essay's last and most sincere footnote.
What It Means for the Industry
Look one step further out. When the precision and freshness of the "where production happens" base map cross a threshold, it can carry far more than discovery and selection: supply-chain finance's asset verification, evaluation of regional industrial policy, layout optimization under dual-carbon goals, even stress tests of industrial-chain security — all need the same map as their foundation. This essay will not unfold them; it only notes: the destiny of infrastructure is to be used by more applications than its builders foresaw. Build the road, and the vehicles come on their own.
And for the reader standing before a site decision today, the flywheel means one simple thing: this map is already good enough today — and it will be more accurate tomorrow than it is today. You do not need to wait for it to be perfect; it perfects itself through being used.
28. What Tianxia Gongchang Is Doing: From Finding Factories to Reading Industrial Geography
Having read this far, a natural question: how much of this capability actually exists today? This chapter states the platform's present tense — what already runs daily as product, and what is being laid down.
The Foundation Already Running
Tianxia Gongchang (www.tianxiagongchang.com) is in the business of helping B2B salespeople and buyers find the right factories in Chinese manufacturing. The data foundation under that business is the asset this essay has cited throughout:
- 4.8 million Chinese factory profiles, covering 1,965 industry categories and 1,000+ industrial belts;
- of these, over 3.45 million carry valid coordinates of their actual production sites, with over 3.14 million in operation;
- over 3 million factories carry direct contact channels to owners or decision makers, with de-identified key-person mobile numbers in the tens of millions;
- 1.08 million factories with export-business characteristics filterable by trade dimension;
- 100,000+ registered B2B salespeople using the platform daily.
As product, AI factory discovery is live: describe the need in natural language — "Guangdong precision-stamping factories with export experience, fifty-plus staff" — and AI parses intent, runs the search, and returns a verifiable factory roster with contact paths. This "human speech in, roster out" loop is the production-grade implementation of layers one and five of the five-layer structure: the language layer processes real users' phrasing every day; the roster layer gets carried into real sales calls every day.
Beyond end-user products, the data is also open to developers and enterprise systems through the Tianxia Gongchang open platform — factory search, company details, and contact reach delivered as standard interfaces, so AI clients can wire "search real factories by industry and region" straight into their own workflows. For teams wanting to embed this essay's spatial analysis into their own site-selection, promotion, or supply-chain systems, that channel is open today.
The Research Layer: Where This Essay's Numbers Came From
All the spatial analysis cited above — the 3.45-million-coordinate inventory, the supplier co-location measurements, the identification of 1,572 clusters, the discovery of 223 unnamed and 88 cross-county clusters — comes from the industrial-geography research the Tianxia Gongchang Industry Research Institute completed in 2026. The research had one direct purpose: to answer how far a data asset built for "finding factories" can walk on the larger question of "reading industrial geography."
The findings are written throughout this essay. For ourselves, they confirmed one thing: factory discovery and site selection are two outlets of one dataset. Discovery answers "where are the qualifying factories"; selection answers "where should mine be" — the former searches the map, the latter simulates on it. Search is a mature product; every data precondition for simulation is in place.
What Is Being Laid Down
From search to simulation, the work under way runs in three layers.
Productizing the cluster archive. Turning the 1,572 cluster profiles — spatial extent, dominant categories, scale spectrum, supplier completeness, growth signals — from research output into directly queryable product capability, so each of the seven decision-maker types gets the cluster view from its own seat.
Self-service ring analysis. Making "any point as center, any industry, any radius" supply-demand-competition ring analysis an external capability rather than an internal research tool. The goal for the five maps: an owner who knows no spatial analysis pulls up their own five with one plain-language sentence.
Conversational site simulation. The final form is the loop the case chapter demonstrated: describe constraints in conversation, the system generates candidates and trade-offs, people verify with rosters in hand, verification feeds back to correct the simulation. Bringing the threshold of "a site selection like Mr. Chen's" down from a consulting engagement to a conversation.
A Longer-Term Judgment
One closing thought beyond product.
We believe factory-site-level industrial-geography data is becoming a new class of infrastructure for manufacturing decisions — as road networks are to travel, as credit records are to finance. While it did not exist, every decision depending on it — site selection, investment attraction, supply-chain layout, regional policy — ran on low-resolution approximation. Now that it exists, those decisions will be redone, one after another. The process will not be fast, but the direction is hard to reverse — because once high resolution has been seen, no one willingly returns to blur.
Tianxia Gongchang happens to stand at this spot not because we foresaw it all, but because doing the humble business of "helping salespeople find factories" well left us no choice but to figure out 4.8 million factories one by one — who they are, what they make, whether they are still alive, and where. When that unglamorous work had accumulated 3.45 million coordinates, we looked up and found the spatial structure of Chinese manufacturing already glowing on the map.
The lamp was lit to find factories. Only after it was lit did we see it illuminating all of industrial geography.
29. Action Guides for Different Readers
The long essay nears its end. If the preceding chapters have persuaded you that site selection deserves to be redone with data, this chapter answers the last question: starting today, what exactly do you do? By reader type.
If You Are an Owner Considering Building, Expanding, or Relocating
Step one is not looking at land — it is writing yourself down clearly: customer anchors, process list (in-house and outsourced separated line by line), your people's migration radius, cost targets. The quality of a site simulation is set by the honesty of this self-description. Step two: fill the candidate set from the full population — do not evaluate only the parks that came knocking; run every cluster and region that satisfies the hard constraints through the filter, and above all do not miss the positions that have no name yet but are climbing steeply. Step three: take the five maps to the field — the data's job is to sharpen the questions ("this place has only six mold shops — how will you cope?"), the field's job is to extract the answers. The Tianxia Gongchang AI factory-discovery entrance works for this today: pulling rosters of suppliers, peers, and potential customers around each candidate is simultaneously simulation and due diligence.
If You Run Investment Attraction for a Park or Local Government
First run the niche self-diagnosis, then set promotion directions — the industrial stock structure within a hundred kilometers of your location decides what you can keep alive, and that diagnosis is worth completing before the next revision of the industrial plan. Then swap net-casting for targeted rosters: circle the firms nationwide that most belong in your park and visit them one by one — bringing your real supplier data to the table, not just the incentive clauses. Finally, run recent-entrant survival as your first KPI: resident firms that thrive are stronger promotion material than any brochure.
If You Are a B2B Salesperson or Supply-Chain Service Provider
Run this essay's logic backwards: the distribution of factories is your market map. Circle target customer groups by category and region; rank them by cluster life stage — newly arrived firms in growth-stage clusters are rebuilding their purchasing relationships, the most valuable cohort to visit. On the Tianxia Gongchang platform, this circle-rank-reach motion is already the daily routine of a hundred thousand salespeople; if you are still sweeping provinces page by page, your competitor may already be fighting cluster by cluster.
If You Are a Researcher, Investor, or Policy Observer
The industrial-geography research cited here is only this data asset's first harvest. The birth and death of clusters, the migration of industries, the evolution of supplier networks — processes once confirmable only in hindsight can now be observed in real time. The Tianxia Gongchang Industry Research Institute will keep publishing research built on full-coverage coordinates; for specific research questions or collaboration, reach us through the official site.
If You Just Want to Test the Water
Each guide above has its threshold, but one zero-threshold starting point is open to everyone: open Tianxia Gongchang and look up an industry you know in a place you know — your hometown's industrial belt, the county where your customers cluster, the town where your own plant sits. Compare the counts, density, and rosters on the map against the map in your head. The bigger the gap, the more this essay is worth to you; if the gap is small, congratulations — your mental map still leads. Just remember: the map updates. Minds do not always.
The One-Sentence Version
If you carry away a single line, carry this one: the essence of site selection is placing a bet on a map you cannot fully see — and now, the map can be seen in full. What remains different is only who starts looking first.
30. Epilogue: Let Every Siting Decision Stand on the Full Picture
Return to the owner in the prologue, hesitating three months between two plots of land.
What saved him twenty million yuan was one remark from an old supplier over dinner. Behind that remark lay a map that exists only in the minds of the old masters — who can do heat treatment, whose anodizing can be trusted, which county's hands are skilled. For decades, the site-selection wisdom of Chinese manufacturing has been stored in millions of such mental maps: real, precious, and fragmentary — leaking away with every master's retirement, going stale with every acceleration of industrial migration, and forever covering only the radius one person has walked.
Everything this essay describes is, at bottom, turning that mental map into a public one: 3.45 million real factory sites, 1,572 clusters lit up by algorithm, supplier radii that can be measured, rosters that can be verified firm by firm. Two hundred years of location theory has finally met data worthy of it; a craft finally has the chance to grow into a science.
But what deserves the final emphasis is not that the machine replaced the dinner-table remark — rather the opposite: what lived inside that remark — the understanding of craft, the judgment of people, the instinct for timing — remains the most expensive part of any siting decision. Data illuminates the invisible precisely so that human judgment can be spent where judgment is truly needed: which of the three paths to take depends on what kind of company you intend to build.
One more width of lens before closing. The meaning of scientific site selection does not stop at each firm's saved costs: hundreds of thousands of less-mismatched siting decisions, summed, mean fewer empty factory shells, fewer island factories, fewer half-abandoned parks — the great migration that must happen, completed at lower social cost. When every factory grows in the right place, the beneficiary is not that factory alone — it is the efficiency of whole supply chains, the jobs each county town gets to keep, and the quality of this manufacturing nation's foundation for the decade ahead.
China has 4.8 million factories. Every one of them once faced the question "where to build" — and in the coming decade, a good share will face it again. Our hope is that when the next owner stands hesitating before the map, what lies in front of them is no longer two investment brochures and one remark caught by luck at dinner, but a complete, honest, fully lit panorama of the industry —
and then, that they themselves make the decision only they can make.
Appendix: Glossary of Key Concepts
This essay introduced or borrowed a set of concepts. For reference and retelling, they are collected here in order of appearance — each with a one-line definition and a one-line usage note.
- Island factory: a plant landed in a blank of the supporting ecosystem, enjoying no agglomeration externality. Usage note: islands are defined not by distance but by "the count of each high-frequency support within effective radius."
- Factory-site-level data: enterprise data spatially anchored to actual production locations rather than registered business addresses. Usage note: use registered addresses for credit checks; industrial geography demands factory sites.
- Dual-metric reporting: reporting spatial density as both company count and distinct-location count. Usage note: township addresses merge toward village and town center points; a bare company count overstates micro-density.
- Supplier radius: the market-evolved typical distance between an industry and each category of its supports. Usage note: estimate from interaction frequency, transport economics, and service indivisibility; it varies enormously across industries.
- Supplier depth: the count of alternatives per support category within a given radius. Usage note: depth determines bargaining power, resilience, and evolutionary headroom; "exists" is only a passing grade.
- Unnamed cluster: a real industrial agglomeration that has not entered public narrative. Usage note: usually means "the dividend remains and the cost has not risen" — high-value information amid industrial transfer.
- Cross-county cluster: a cluster whose spatial extent crosses county-level boundaries. Usage note: any administrative-unit statistic chops it up; only the coordinate view sees it whole.
- Cluster life cycle: the stage sequence from emergence through growth and maturity to contraction. Usage note: judge the stage from dynamic signals — net firm inflow, supplier thickening; the same cluster is a different environment for newcomers at different stages.
- Cluster-edge arbitrage: sharing a mature cluster's labor pool and supplier ring from the direction of slowest density decay, at lower factor cost. Usage note: first confirm the decay direction on the coordinate map, then check the factor discount along it.
- Industry grammar: the spatial organization pattern of an industry's supply chain (hub-and-spoke, mesh symbiosis, process-anchored, quick-response, knowledge-intensive). Usage note: diagnose the grammar before computing the space; wrong grammar means wrong weights means everything wrong.
- Network-adjusted factor cost: factor prices restated after folding in the friction cost of supplier radii. Usage note: cheap land and a cheap business are different things — the difference is the network's price.
- Supply-network overlap: the degree of intersection between two bases' critical supply sources. Usage note: high-overlap dual bases are fake backups — in risk terms still one base.
- Survival rate of recent entrants: the share of firms that moved into a location in recent years and remain. Usage note: the most honest rating a location can receive, above any promotional promise.
- The five maps: the spatial views of supply, demand, competition, factors, and time. Usage note: all five must be present at once; reading any one alone drifts systematically off course.
- The list-real gap: the distance between public quotations (land, policy, service promises) and actual transactions and delivery. Usage note: data cannot measure it — only feet can; this is why field visits cannot be replaced.
- Reverse site selection: the promotion method by which parks and local governments start from their own ecological niche and match firms via coordinate data. Usage note: matching beats persuading; survival rate beats signing count.
- Gap-filling investment attraction: targeting recruitment at resident firms' outsourcing gaps, attracting suppliers with order density rather than subsidies. Usage note: first turn the gap list into named entries, then talk policy.
- The composition-fallacy worry: the concern that data sends all users to one spot, which then stops being optimal. Usage note: siting objectives are intensely personal and the data self-corrects; in manufacturing, "everyone coming" mostly creates agglomeration ecosystems rather than congestion.
Concepts are not coined for their own sake. Behind each stands a class of recurring decision error — the name's job is to let the next discussion start from shared ground.
Data Sources and References
All data in this essay concerning factory counts, coordinate coverage, cluster identification, and supplier co-location measurement comes from the data assets of the Tianxia Gongchang industry platform and the 2026 industrial-geography research of the Tianxia Gongchang Industry Research Institute; the location-theory sections draw on the classical literature of economic geography. Principal sources:
- Tianxia Gongchang industry platform — Chinese factory database and industry-chain data (4.8 million factory profiles, 3.45 million factory coordinates, 1,965 industry categories)
- Johann Heinrich von Thünen, The Isolated State in Relation to Agriculture and Political Economy (1826)
- Alfred Marshall, Principles of Economics (1890)
- Alfred Weber, Theory of the Location of Industries (1909)
- Walter Christaller, Central Places in Southern Germany (1933)
- Paul Krugman, "Increasing Returns and Economic Geography", Journal of Political Economy (1991)
- The Royal Swedish Academy of Sciences, statement on the 2008 Nobel Prize in Economics (new economic geography)
- National Bureau of Statistics of China, the national standard Industrial Classification for National Economic Activities
Cover photo: aerial view of the Longchuan County industrial park, Yunnan (photograph by 瑞丽江的河水, Wikimedia Commons, CC BY-SA 4.0).