
Part One: Industrial Chain and Manufacturing Processes
Chapter 1 From Substrate to Luminaire: Why the Four Segments Differ So Much in Concentration
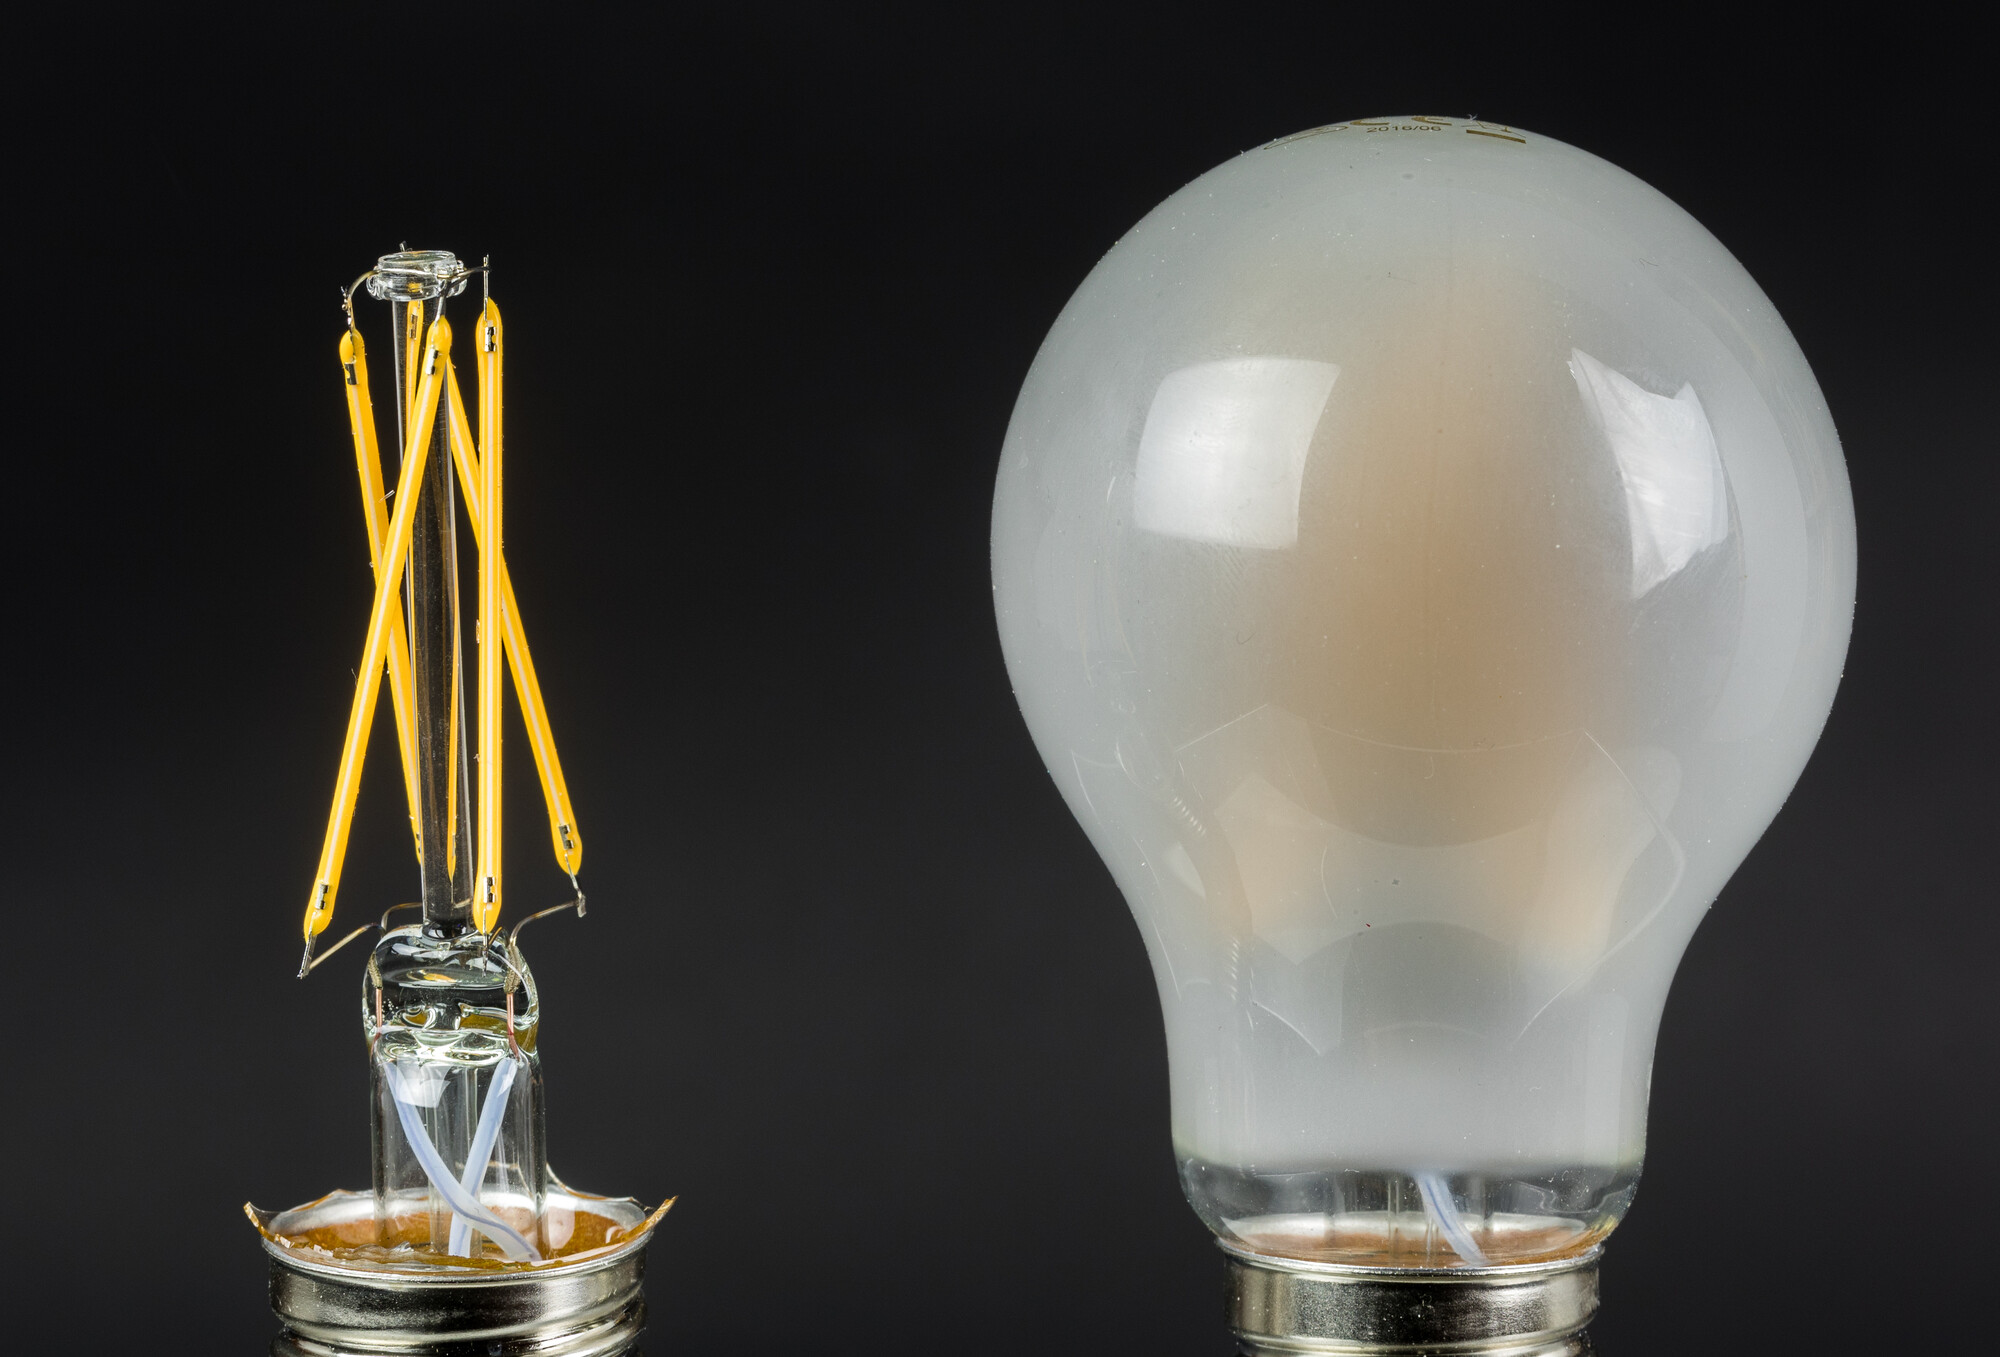
An LED bulb bought off the shelf at a hardware store opens up into an LED package, a driver, an aluminium substrate, a plastic housing and a lamp cap. Tracing upstream, the package comes from a packaging plant, the packaging plant buys chips, the chip maker buys epitaxial wafers, and the epitaxial wafer is grown on a substrate. The whole chain can be divided into four segments: substrate and epitaxy, chip fabrication, packaging, and application. Across the four, output value, number of enterprises and concentration differ so widely that describing them with a single set of terms would misrepresent them.
In 2024, upstream epitaxy and chip output value was RMB 32.4 billion (324 亿元), midstream packaging RMB 78.4 billion, and downstream applications RMB 514.2 billion, a total of RMB 625 billion. the Blue Book as cited in a listed company's annual report Upstream accounted for 5.2%, packaging for 12.5% and applications for 82.3%. Output value grows moving down the chain, the number of enterprises increases moving down the chain, and concentration falls moving down the chain.
The three sum exactly to the total, which shows that this is an aggregation of segment-level output and that there is double counting between segments: the downstream figure of RMB 514.2 billion includes purchased LED packages, drivers and structural parts. The set can be used to read structural proportions, but not as a value-added decomposition, nor to derive the profit margin of each segment.
Table 1-1 Output Value and Concentration of the Four Segments
| Segment | Main products | 2024 output value (RMB 100 million) | Share of semiconductor lighting output | Concentration | Main barriers |
|---|---|---|---|---|---|
| Substrate and epitaxy | Substrates, epitaxial wafers | Counted together with chips | — | Combined with chips | Equipment, process, yield |
| Chip | Epitaxial wafers, chips | 324 | 5.2% | Top six account for over 80% of capacity | Equipment, yield, customer qualification |
| Packaging | LED packages, modules, COB | 784 | 12.5% | Global top five about 41% | Equipment precision, batch consistency |
| Application | Luminaires, light sources, modules | 5,142 | 82.3% | More than 30,000 business entities in Guzhen alone | Channel, style, delivery |
Table compiled from public data. Output value and shares are from the Blue Book as cited in a listed company's annual report (2024); the concentration figures are from TrendForce and CSA Research as cited in a prospectus, from GEP Research and from CCTV reporting respectively. The bases differ, so the figures serve only for order-of-magnitude comparison.
Upstream concentration can be summed up in one sentence: the top six enterprises account for more than 80% of capacity. TrendForce and CSA Research as cited in a prospectus The top three account for about 55%—58%; in 2021 San'an held 31.68%, HC Semitek 14.28% and MLS 12.42%, a total of 58.38%. industry research report The Mini LED sub-segment is more concentrated: in 2024 San'an, MLS and HC Semitek together held 87%. ibid.
Midstream is a different picture. The global top five in LED packaging hold about 41% in total, or 8.2% each on average. GEP Research basis Within manufacturing, 41% counts as moderate concentration: much lower than upstream, much higher than downstream. The Chinese packaging market was about RMB 78.4 billion in 2024 (Blue Book basis); another institution gives RMB 86.5 billion, a difference of RMB 8.1 billion, or about 10.3% of the former. Huajing Industry Research Institute basis
Downstream, the figure is more than 30,000. Guzhen in Zhongshan covers less than 50 square kilometres and gathers more than 30,000 lighting business entities; its lighting sales account for 70% of the domestic market and 50% of the international market for comparable products, and its products are exported to more than 130 countries and regions. CCTV economic report, 24 November 2024 On a footprint of less than 50 square kilometres, that is more than 600 business entities per square kilometre.
Set the three groups of figures side by side and an inverse relationship appears: the segment with the highest concentration has the smallest share of output value, and the segment with the largest share has the lowest concentration. Six enterprises hold 80% of capacity behind 5.2% of upstream output value, while 82.3% of downstream output value is spread among tens of thousands of entities. This inverse relationship does not conflict with "chips account for 20% to 40% of the cost of a finished lamp"; the two have different denominators: the first is a segment's share of total industry output value, the second is the cost structure of a single lamp. industry reference
Why such large differences arise can be examined from six aspects.
The first is the capital threshold. Epitaxy and chips are asset-heavy: MOCVD equipment, cleanrooms, special gases and exhaust treatment systems make up the main investment, equipment depreciation occupies an important place in cost, and each step down in capacity utilisation moves unit cost up a notch. Downstream assembly is much lighter: the equipment needed for surface mounting, assembly, ageing and packing is far below upstream levels, plant can be rented, and lines can be added or removed with orders.
The second is the yield curve. The wavelength uniformity, defect density and forward voltage of an epitaxial wafer all depend on long-term process accumulation. The chips cut from one epitaxial wafer are binned by wavelength, brightness and voltage; effective output equals the number of dies multiplied by yield and then by the bin hit rate, and each improvement in yield is measured in years. Assembly has a short yield curve: a new product usually goes from trial production to volume production in weeks.
The third is customer qualification. Chips must enter a packaging plant's approved supplier list, and packages must enter a luminaire maker's incoming inspection system; qualification cycles are long and switching costs are high. For an end user, switching the brand of a light bulb costs close to nothing. Qualification barriers lock in upstream and do not lock in downstream.
The fourth is the dimension of differentiation. Chips are standard products traded by bin and price, with few dimensions of competition; scale and consistency decide the outcome. Downstream products face style, channel, installation method, project service and lead time; with more dimensions of differentiation, a small plant can survive on one style, one region or one class of project.
The fifth is the shipping radius. Luminaires are bulky, fragile and low-priced per unit, so freight accounts for a high share of delivered cost, and tooling, hardware, electroplating, packaging and logistics must be nearby, which produces clusters. Chips are small and dense in value and can be flown to any packaging plant in the world. The shipping radius means downstream must cluster while upstream can supply over long distances.
The sixth is the exit barrier. Upstream is asset-heavy, and in overcapacity equipment is hard to repurpose, so enterprises can only hold on through price and utilisation; the industry clears slowly and a few players remain. Downstream is asset-light: when orders fall, lines can stop, staff can be cut and the plant can switch to other styles; entry and exit are free, and the number of entities stays at a very high level.
Taken together, the six points support one judgement: upstream concentration comes from a few enterprises deciding supply, while downstream fragmentation comes from demand itself being fragmented. Competition upstream revolves around capacity utilisation and yield; competition downstream revolves around style, channel and delivery. The two kinds of competition are not on the same plane.
Differences in concentration carry through to the bargaining structure. A few upstream enterprises face midstream packaging plants, and midstream faces tens of thousands of downstream luminaire makers. Concentration declining along the chain usually means upstream has stronger bargaining terms with midstream, and midstream with downstream; but this article has no segment-level profit margin data, so this is a description of a mechanism, not an empirical conclusion. In 2025 several sets of data appeared at the same time: capacity utilisation in the packaging segment exceeded 85% and more than 60% of enterprises grew revenue; the general lighting market fell 11% year on year; and total profits of industrial enterprises above designated size fell 16% year on year (January—October). China Association of Lighting Industry association data as cited elsewhere These figures do not directly establish causation, but they point to the same place: the pressure of falling prices lands on the most fragmented end of the chain.
Nor can a segment be captured by a single concentration figure. Packaging as a whole has a global top five at 41%, but within fine-pitch LED packaging SMD (including IMD) accounts for 78.7% of sales and COB for 21.0%; the two product lines have different structures. RUNTO Technology basis Upstream as a whole has the top six above 80%, and the Mini LED sub-segment has the top three at 87%. Concentration must be read at product level; a segment average loses these differences.
The output value data used in this Part are on the semiconductor lighting basis, which includes displays and backlighting and differs from the lighting equipment basis. In 2025 the lighting equipment industry was worth about RMB 580 billion, and total semiconductor lighting output was RMB 609.3 billion, down 1.1% year on year. China Association of Lighting Industry The two figures come from different sources; they are not added together and not converted into each other. The RMB 625 billion of 2024 and the RMB 609.3 billion of 2025 come from different years and different sources; the decline obtained by subtracting one from the other does not agree with the published year-on-year rate, and this Part does not derive a growth rate from them.
Chapter 2 Upstream: Substrates, Epitaxy, Chips
Upstream divides into three stages: substrate preparation, epitaxial growth and chip fabrication. All three can be completed within one park, and statistically they are combined as epitaxy and chips. In 2024 this block had an output value of RMB 32.4 billion, up about 10% year on year (search-summary basis), accounting for 5.2% of semiconductor lighting output value. Blue Book as cited industry media summary
The substrate is the template for epitaxial growth; its material and crystal orientation determine the defect density of the epitaxial layer. Sapphire (aluminium oxide) is the mainstream substrate for blue and white LEDs: insulating, heat-resistant and controllable in cost, its drawback is poor thermal conductivity and a lattice mismatch with gallium nitride. A patterned sapphire substrate carries microstructures on its surface that reduce total internal reflection inside the crystal and extract more light.
Silicon substrate is another route, developed by Jiang Fengyi's team at Nanchang University; the silicon-substrate high-efficacy gallium-nitride-based blue light-emitting diode won the first prize of the National Technological Invention Award. Phoenix Jiangsu Silicon's advantages are compatibility with large-diameter wafers, low cost and integration with integrated-circuit processes; the difficulty is a large lattice mismatch and thermal mismatch, which makes the epitaxial layer prone to cracking and requires buffer layers and stress control. This route has formed an industrial cluster in Nanchang, discussed later in this chapter.
Epitaxial growth uses MOCVD, metal-organic chemical vapour deposition. Trimethylgallium, trimethylaluminium, trimethylindium and ammonia are fed into the reactor and decompose and react at high temperature, growing in sequence a buffer layer, n-type gallium nitride, indium gallium nitride/gallium nitride multiple quantum wells and p-type gallium nitride on the substrate. The light-emitting region is the multiple quantum well, where wavelength is determined by indium composition and well width. The wavelength uniformity, brightness, forward voltage and reverse leakage of the epitaxial wafer determine the yield and binning outcome of the subsequent chip process.
MOCVD is the core equipment of the epitaxy stage; the temperature field, flow field and showerhead design of the reactor determine large-area uniformity. MOCVD equipment from Nanchang High-tech Zone holds more than 80% of the global market (local media basis). Phoenix Jiangxi Equipment concentration means the pace of epitaxy capacity expansion is constrained by the delivery cycles of a few suppliers. A company sample shows MLS Semiconductor shipping about 35,000 epitaxial wafers a day. Economic Daily
The chip fabrication sequence is: cleaning, photolithography, etching to form mesas, deposition of a transparent conductive layer (indium tin oxide), formation of p-type and n-type electrodes, passivation, thinning, dicing, and test and sorting. Structurally there are three types: lateral, flip-chip and vertical. Lateral chips are simple to process and low in cost but suffer current crowding and only average heat dissipation; flip-chip mounts the electrodes face down for good heat dissipation and suits high currents; the vertical structure suits high power and high voltage. Light extraction relies on patterned substrates, surface roughening, distributed Bragg reflectors and transparent electrodes to bring light that would otherwise be totally internally reflected inside the crystal out to the surface.
Test and sorting divide chips into a number of bins by wavelength, brightness and forward voltage; chips cut from the same epitaxial wafer fall into different bins and carry different prices. The finer the binning, the more flexible downstream packaging's bin mix, and the more complex the chip maker's inventory management. Yield and binning capability are the core metrics of an upstream enterprise: they determine how much the same epitaxial wafer can be sold for.
The answer to why upstream concentration is high lies in the superposition of three thresholds: equipment, process and customer qualification. Equipment investment is large and depreciation heavy; yield ramps take years; entry into a major customer's approved list requires long-cycle qualification. A new entrant must cross all three at once, and any one of them can exhaust its capital. Top six above 80% of capacity, top three at 55%—58%, top three in Mini LED at 87%: the three figures are one mechanism showing up in different products.
Regionally, Xiamen and Nanchang are two representatives. On 13 April 2004, the Ministry of Science and Technology designated Xiamen a National Semiconductor Lighting Engineering Industrialisation Base, the country's first national LED base and one of two Class A bases. In 2023, Xiamen's direct optoelectronic semiconductor output was RMB 209.8 billion, of which flat-panel displays accounted for RMB 101.3 billion, integrated circuits RMB 33.9 billion and the LED industry chain cluster RMB 42.4 billion; the city had more than 100 LED enterprises and 132 high-tech optoelectronic semiconductor enterprises, and positions itself as the country's largest LED epitaxy and chip manufacturing base. Xiamen Investment Promotion Bureau Direct optoelectronic semiconductor output grew from RMB 3.5 billion in 2003 to RMB 209.8 billion in 2023, about 60 times the 2003 level.
Nanchang follows the silicon substrate route. In 2024 the LED cluster in Nanchang High-tech Zone recorded revenue of RMB 20.6 billion, up 43% year on year, gathering more than 70 enterprises across the chain and covering base materials, chip packaging, key equipment and end applications; its target for 2026 is for the city's LED industry to reach RMB 50 billion in scale. Nanchang Daily report Phoenix Jiangxi province as a whole recorded LED revenue of RMB 71.59 billion in 2023, up 9.9% year on year. Hubei Daily as cited
Upstream cost items are substrates, metal-organic sources, high-purity gases, electricity, equipment depreciation and labour. Chip unit prices vary by size, power and bin, differing by multiples, so describing this segment with an average unit price would misrepresent it. Upstream output value is only 5.2% of the whole chain; that is a segment's share of total industry output value. In the cost of a single lamp, chips account for 20% to 40%. The two shares have different denominators, cannot substitute for each other, and neither directly establishes upstream's technological position. Segment-level gross margin data were not obtained, and this Part makes no judgement on upstream profitability.
For a luminaire maker, chips are usually not purchased directly; what is bought is the packaged LED. But the source and bin grade of the chip determine the consistency of the package. Change the chip supplier for a package of the same model and both the wavelength distribution and the forward voltage distribution change, so the luminaire maker's optical design and driver parameters must be matched again. This is why material substitution is more sensitive in lighting than in most industries.
Chapter 3 Midstream Packaging: The Division of Labour among SMD, COB and COG
Packaging does four things: it brings out the chip electrodes and completes the electrical connection; it separates the chip from the outside world and provides mechanical and environmental protection; it converts blue light into white light, completing the optical conversion; and it conducts heat away from the chip, completing thermal management. A single LED package is a small system whose performance is determined by all four together; if any one is done badly, the package will cause problems in the finished luminaire.
The process has eight steps: wafer expansion, die bonding, wire bonding, dispensing, baking and curing, dicing, binning by colour and brightness, and tape-and-reel packing. LEDinside process description government EIA document Wafer expansion stretches the whole wafer film evenly so that die spacing is uniform and the die bonder can pick them up. Die bonding attaches the chip to the lead frame or substrate with silver adhesive or insulating adhesive; the amount of adhesive and the void rate affect thermal resistance. Wire bonding uses gold or copper wire in thermosonic bonding to connect the chip electrodes to the frame; loop height, ball shear and pull strength are the key control items. Dispensing applies epoxy or silicone; for white products phosphor is added to the compound, the compound must be deaerated, and phosphor settling and coating uniformity determine colour temperature consistency. Baking, dicing, binning by wavelength and brightness, and tape-and-reel packing follow.
The equipment mix, on a brokerage estimate, is: die bonders 28%, wire bonders 28%, binning machines 20%, tape-and-reel machines 12%, dispensers 6% and baking equipment 4%, a total of 98% for the six, with the remainder auxiliary equipment. Tianfeng Securities estimate basis Die bonding and wire bonding together account for 56%; packaging's asset centre of gravity is precision assembly, and equipment precision and speed determine yield and cost.
SMD is the surface-mount device. The chip is fixed in a lead frame with a cup, phosphor compound is dispensed, a lens is fitted, and the result is a device that can pass through reflow soldering. Its advantages are standardisation, compatibility with SMT lines, easy repair and replacement, and a mature supply chain; its limits are that the lead frame takes up space, density cannot rise, and thermal resistance is higher than with direct bonding. It is used mainly in light strips, tubes, bulbs, panel lights and fine-pitch displays.
COB is chip-on-board. Multiple chips are fixed directly on the substrate, a dam is formed and compound is dispensed, and the whole board emits light. Its advantages are high density, no lead-frame obstruction, uniform light output and low thermal resistance, with unit cost falling as area increases; its limits are that a single failed chip is hard to repair, it places high demands on the substrate, die-bonding precision and dispensing consistency, and colour tolerance is harder to control than with SMD. It is used mainly in displays with smaller pitch, downlights and spotlights, panel lights and photographic lights.
COG is chip-on-glass. Chips are bonded directly to a glass substrate for liquid-crystal backlighting and transparent displays. Glass is transparent and thin, but conducts heat poorly, and the bonding process and reliability requirements are demanding. COG is almost never seen in lighting products; it belongs to the packaging routes of displays and backlighting. It is included here because LED packaging in industry statistics covers both lighting and displays, which share the front-end process and separate at the back end.
Table 3-1 The Division of Labour among the Three Packaging Routes
| Item | SMD | COB | COG |
|---|---|---|---|
| Full name | Surface-mount device | Chip-on-board | Chip-on-glass |
| Structure | Chip fixed in a lead-frame cup, sealed with dispensed compound | Multiple chips fixed directly on the substrate, dam and dispense | Chips bonded directly to a glass substrate |
| Light output | Constrained by the lead frame and lens | Whole-surface emission, uniform | Emitted through the glass |
| Thermal resistance | Relatively high | Relatively low | High; glass conducts heat poorly |
| Repair | Individual devices replaceable | Individual chips hard to repair | Not repairable |
| Typical applications | Light strips, tubes, bulbs, panel lights, fine-pitch displays | Fine-pitch and micro-pitch displays, downlights and spotlights, photographic lights | Liquid-crystal backlighting, transparent displays |
| Market position | 78.7% of fine-pitch packaging sales, including IMD | 21.0% of fine-pitch packaging sales | Essentially unused in lighting |
Table compiled from public data. Shares are from RUNTO Technology's 2024 fine-pitch LED packaging data; process definitions follow LEDinside and common industry usage.
In fine-pitch LED packaging in 2024, SMD (including IMD) accounted for 78.7% of sales and COB for 21.0%; the average COB price was RMB 24,400 per square metre (2.44 万元/平方米), down 37.5% year on year. RUNTO Technology These two shares are shares of sales value; shares by volume will differ: COB has a high unit price, and a share calculated by area or by unit count follows a different method. The average COB price fell 37.5% in a year, which shows that this product line is in a phase of simultaneous capacity expansion and price competition.
Packaging concentration is moderate. The global top five hold about 41%, or 8.2% each; the Chinese packaging market in 2024 was RMB 78.4 billion (Blue Book basis) or RMB 86.5 billion (Huajing basis). Moderate concentration has three "moderate" causes: equipment investment is moderate, the process can be learned, and customers are fragmented with many models. Large plants win large customers through scale and batch consistency; small plants win small and medium customers through niche models and price. In 2025 capacity utilisation in the packaging segment exceeded 85% and more than 60% of enterprises grew revenue. China Association of Lighting Industry High capacity utilisation shows that demand has absorbed part of this round of expansion.
Packaging occupies a special position. Upstream chips are supplied by bin, and packaging plants build products to a bin mix; with upstream concentrated, packaging plants have weak bargaining power and the bin structure they receive is allocated by the chip maker. Downstream luminaire makers are fragmented, so a packaging plant can serve many customers and the loss of a single customer has limited impact. This position gives packaging plants both an incentive to expand capacity and an incentive to extend downstream. COB modules, light strips, and light engines that put the driver and the light source on one board are each a step towards the finished luminaire. The movement of this boundary is taken up in Chapter 7.
Chapter 4 Downstream: General Lighting, Commercial Lighting, Outdoor, Automotive, Horticultural Lighting, UV
Downstream applications had an output value of RMB 514.2 billion in 2024, 82.3% of semiconductor lighting output value, down about 7.6% year on year (search-summary basis). Blue Book as cited The application mix is: general lighting 44.1%, landscape lighting 16.6%, displays 15.6%, backlighting 8.2% and automotive lighting 1.5%, a total of 86.0% for the five, with the remaining 14.0% other applications not listed separately. Bosi Data
This structure table must first be taken apart. Displays and backlighting together account for 23.8%, and they belong to the display industry chain, not to lighting. Industry statistics put the whole of LED downstream under "semiconductor lighting"; when reading them, the display part must be set aside: lighting applications in the proper sense are general, landscape and automotive, plus categories not listed separately such as commercial, outdoor, horticultural and UV. The 44.1% covers general lighting only and cannot be taken as lighting's share of LED applications.
General lighting products are bulbs, tubes, downlights, spotlights, ceiling lights, panel lights and light strips. Their characteristics are standardisation, channel-driven sales and intense price competition. In 2025 the general lighting market fell 11% year on year. China Association of Lighting Industry Export unit prices show the price level: in 2025 LED bulbs fetched USD 0.46 each, down 16% year on year; LED tubes USD 1.57 each, down 12%; fixed luminaires USD 5.91 each, down 17%; and portable luminaires USD 10.57 each, down 26%. association data as cited elsewhere General lighting is the segment where prices are falling fastest along the whole chain, and the segment with the largest number of business entities.
Commercial lighting serves shops, offices, hotels, supermarkets and educational premises. It requires colour rendering, glare control, light distribution, dimming compatibility and appearance design; delivery is project-based and requires lighting design, samples and on-site commissioning. Customer stickiness is higher than in general lighting, and certification and test reports are the entry threshold. This segment has fewer enterprises than general lighting, and brand and engineering service capability matter more than capacity.
Outdoor and landscape lighting includes street lights, tunnel lights, floodlights, garden lights and landscape illumination. It requires ingress protection, anti-corrosion, lightning protection, lumen depreciation and warranty; procurement is by tender, qualifications and test reports are hard thresholds, and payment cycles are long. Landscape lighting accounts for 16.6% of the application mix and is closely tied to the municipal investment cycle. Two clusters represent this segment. Zouqu in Changzhou was awarded the title "China Lighting City" by the China Association of Lighting Industry in 2007; it has more than 600,000 square metres of operating area, more than 5,000 lighting merchants, annual transactions of more than RMB 12 billion, online sales of more than RMB 5 billion in 2024, equivalent to more than 40% of transaction value, and more than 1,300 lighting manufacturers, and it is one of the country's largest production bases for outdoor lighting. Xinhua Finance Yuyao has more than 250 lighting exporters, which exported RMB 3.95 billion in 2023 and RMB 2.59 billion in January—July 2024, up 12.9% year on year; the products are mainly garden lights, solar lights and smart garden lights. China Media Group International Online
Automotive lighting had a market size of RMB 85.8 billion in 2025. China Association of Lighting Industry The segment divides into original equipment and aftermarket: original equipment enters the vehicle maker's supply system, with long qualification cycles, high reliability requirements and stable supplier relationships; the aftermarket serves modification and repair, and is fragmented and price-sensitive. Automotive concentration is clearly higher than in general lighting, for reasons of qualification thresholds and the cost of failure.
Horticultural lighting had a market size of USD 1.317 billion (13.17 亿美元) in 2024, up 6.8% year on year (TrendForce basis, cited second-hand). second-hand citation Customers are growers, who care about spectrum ratio, photon flux density, energy efficiency and reliability; the appearance of the luminaire does not matter. Products must work with cultivation practice and control systems, so the service element is strong.
UV LED was about RMB 2.8 billion in 2024, up about 23% year on year (CSA Research basis, cited in a listed company's annual report). Blue Book as cited It divides into UVA curing and UVC sterilisation; deep UV has separate technical thresholds in epitaxy, packaging, quartz lenses, lifetime and lumen depreciation, and safety protection requirements are high. This segment has few enterprises and higher concentration than general lighting.
Table 4-1 Scale, Concentration and Thresholds of Downstream Sub-markets
| Sub-market | Figure | Period and basis | Concentration | Key threshold |
|---|---|---|---|---|
| General lighting | 44.1% of the application mix; -11% year on year in 2025 | Bosi Data 2024; association 2025 | Most fragmented | Channel, cost |
| Landscape lighting | 16.6% of the application mix | Bosi Data 2024 | Moderate | Engineering qualifications, payment collection |
| Displays | 15.6% of the application mix | Bosi Data 2024 | Moderate to high | Pixel pitch, consistency |
| Backlighting | 8.2% of the application mix | Bosi Data 2024 | High | Customer qualification |
| Automotive lighting | RMB 85.8 billion | association 2025 | High | Automotive-grade qualification |
| Horticultural lighting | USD 1.317 billion | TrendForce 2024, second-hand | Moderate | Spectrum and energy efficiency |
| UV | RMB 2.8 billion | CSA Research 2024 | Relatively high | Epitaxy and packaging |
Table compiled from public data. The units and statistical periods differ from row to row; the percentages come from the same application-mix table, while the absolute amounts come from different sources and cannot be added together.
Dividing downstream into six segments, concentration from low to high runs roughly: general lighting, commercial lighting, outdoor and landscape, horticultural lighting, automotive, UV. What determines this order is qualification thresholds and the cost of failure. Replacing a bulb costs close to nothing; replacing a street light means digging up the road; replacing a set of vehicle lights can involve a vehicle recall. The higher the cost of failure, the fewer the customers, the longer the qualification and the more concentrated the suppliers. Downstream "fragmentation" applies only to the general lighting segment; summing up the whole of downstream in one phrase would misread half the market.
Chapter 5 Drivers and Optics: Two Underestimated Segments
One teardown sample gives the cost of an LED bulb as: light source 37.7%, driver 21.7% and structural parts 18.5%, a total of 77.9%, with the remaining 22.1% not itemised in the original, where labour, packaging, manufacturing overhead, testing and losses may all sit. teardown sample from an electronics engineering forum Another set, given as ranges: chips 20%—40%, driver 15%—25%, heat dissipation 10%—20%, housing 10%—15%, optics 5%—15% and assembly 5%—10%. industry reference The two sets cannot be added together or used to check each other, but both point to the same fact: the driver is the cost item second only to the light source.
The driver does four things: it converts AC mains into a constant direct current, performs power factor correction, suppresses harmonics, and provides a dimming interface and protection. Topologies divide into non-isolated and isolated. Non-isolated is efficient and low-cost, with safety depending on the luminaire structure; isolated uses a transformer to separate input from output, giving a larger safety margin at higher cost and volume. Dimming must be compatible with interfaces such as TRIAC, 0-10V, DALI and PWM; poor compatibility produces flicker and dimming dead zones.
Harmonics and power factor are hard metrics for drivers. GB 17625.1-2022 took effect on 1 July 2024, is a modified adoption of IEC 61000-3-2:2020, and classifies lighting equipment as Class C. Within Class C, for equipment with active power above 25 W, the 3rd harmonic shall not exceed 30×λ, the 5th shall not exceed 10%, the 7th shall not exceed 7%, the 9th shall not exceed 5%, and the 11th to 39th shall not exceed 3%; equipment from 5 W to 25 W follows alternative limits, with the 3rd harmonic not exceeding 86% and the 5th not exceeding 61%; equipment below 5 W received a new exemption in the 2022 edition. standard interpretation Common engineering requirements for power factor are: not less than 0.50 at 5 W or below, and not less than 0.90 above 5 W; an interpretation of GB/T 50034-2024 proposes that the power factor of LED luminaires should not be lower than 0.9. tender technical requirements standard interpretation
Sampling inspection data make the driver's position very clear. In 2024, 231 batches of fixed general-purpose luminaires were inspected offline and 46 batches failed, a non-conformity rate of 19.9%; among the failed items, harmonic current accounted for 38 batches, disturbance voltage 27, radiated disturbance 16, protection against electric shock 18, external wiring 8, construction 2 and colour rendering index 1. China Lighting Network citing a SAMR notification In 2025, 197 batches of recessed general-purpose luminaires were inspected and 84 batches failed, a non-conformity rate of 42.6%; among the failed items, harmonic current accounted for 37 batches, disturbance voltage 33, external wiring 33, protection against electric shock 22, construction 15, resistance to heat 9, energy efficiency 16 and colour rendering index 11. State Administration for Market Regulation notification No. 24 of 2026 The itemised batch counts sum to more than the number of failed batches because one sample can fail several items at once.
Harmonic current, disturbance voltage, radiated disturbance, protection against electric shock and external wiring: these five classes of problem concentrate in the driver and the internal wiring. The efficacy and colour rendering of the finished luminaire are determined by the light source; its compliance is mainly determined by the driver. The driver is where a luminaire maker can cut cost most easily, and where sampling inspection most often finds problems.
Driver lifetime is determined by its internal components. A driver contains electrolytic capacitors, optocouplers, MOSFETs and transformers; electrolytic capacitor life shortens as ambient temperature rises, and the driver is often installed close to the light source, where the ambient temperature is high, so its life is the first to be eroded. LM-80 and TM-21 cover only LED light source components, not drivers, optics or solder joints. US Department of Energy The long-life figure printed on the packaging is therefore usually lumen maintenance data for the light source component; the actual life of the finished luminaire is set by whichever part fails first.
Optics divides into primary and secondary. Primary optics happens inside the package and refers to the shape and thickness of the lens and phosphor layer on the chip. Secondary optics happens in the finished luminaire and refers to lenses, reflectors, light guides, diffusers, louvers and anti-glare films. Secondary optics determines the light distribution curve, beam angle, glare and light output efficiency; the same LED package with different secondary optics can produce luminaires a grade apart.
Choosing optical materials is a set of trade-offs. PMMA (acrylic) has high transmittance and only average weathering resistance; PC (polycarbonate) withstands temperature well but yellows under prolonged UV exposure; silicone withstands temperature but its surface collects dust easily; glass weathers well but is heavy and fragile. Lenses and reflectors require tooling, and tooling cost and minimum order quantity determine whether a small plant can have its own light distribution. This explains a phenomenon in the industry: many styles but few light distributions, with most small plants sharing common tooling.
Table 5-1 Control Points for Drivers and Optics
| Component | Control point | What to require in procurement | Consequence of failure |
|---|---|---|---|
| Driver | Topology, power factor, harmonics, dimming compatibility, protection | Model and certification, power factor and harmonic reports, surge rating, warranty | Flicker, dead lamp, harmonic non-compliance |
| Primary optics | Phosphor coating, encapsulation | Colour temperature bins, bin mix | Colour difference, uneven light spot |
| Secondary optics | Lens, reflector, diffuser | Light distribution curve, material grade, tooling ownership | Glare, efficiency loss, yellowing |
| Heat dissipation | Substrate, thermal interface, structural parts | Thermal resistance, junction temperature estimate, ageing data | Lumen depreciation, shortened life |
Table compiled by this Part from public process references and product technical requirements.
In procurement these two items can be separated out. The driver should be qualified as an independent component: brand and model, certificates, power factor, harmonic report, surge rating, warranty period. Optics should be qualified as an independent capability: light distribution curve files, glare calculation, material grade, tooling ownership. In a finished-luminaire quotation the driver accounts for about 20% on its own and optical parts for another 5%—15%; negotiating these two separately is more effective than discussing only the unit price of the finished luminaire.
Chapter 6 Luminous Efficacy, Colour Rendering Index, Glare: What the Three Metrics Actually Mean in Procurement
Luminous efficacy answers whether a luminaire is economical with electricity, the colour rendering index answers whether colours are accurate, and glare answers whether it is comfortable to look at. The three constrain one another: raising efficacy often means sacrificing colour rendering, controlling glare often means sacrificing light output efficiency, and doing all three well pushes cost up. Procurement must choose a balance among the three: first establish where the luminaire will be used, then discuss parameters.
Luminous efficacy is measured in lumens per watt, total luminous flux divided by input power. In 2024, mainstream LED packages achieved about 130—160 lm/W in mass production and finished luminaires about 100—150 lm/W; the highest efficacy among all product categories published by leading enterprises reaches 255 lm/W; mass-produced street lights reach 125—140 lm/W as finished luminaires and high-bay industrial lights 135—145 lm/W; the International Energy Agency's 2023 figure was that the best products had reached 230 lm/W. industry media company announcement industry reference brokerage compilation IEA There is a loss between package and finished luminaire: to achieve 160 lm/W at luminaire level, the package needs 190—210 lm/W, the difference coming from temperature, lens and driver losses. industry reference
The measurement method for efficacy is LM-79. It applies to finished luminaires and luminaires, not to chips, packages or arrays. Measurement uses an integrating sphere or a goniophotometer; for compact lamps the integrating sphere must be at least 1 metre in diameter, for larger luminaires at least 1.5 metres, and for units above 500 W at least 2 metres; light distribution is measured by the 2π method or the 4π method; the sample must be lit until temperature stabilises before measurement, usually 30 minutes to 2 hours for large luminaires. LM-79 text published by the DOE The total luminous flux, input power, efficacy, colour temperature and colour rendering index in a report are products of the same test batch; remove one and the credibility of the rest must be discounted.
The efficacy threshold is written into energy efficiency standards. GB 30255-2019 sets three energy efficiency grades, and for products whose colour rendering index Ra is not below 90 the efficacy requirement is lowered by 10 lm/W; it applies to LED downlights (rated power not less than 2 W), directional integrated LED lamps and non-directional self-ballasted LED lamps (2—60 W). National Standards Full-Text Public System standard interpretation GB 37478-2025 covers road and tunnel lighting, takes effect on 1 June 2026, and sets three grades by colour temperature band: colour temperature not above 2500 K is 140/130/110 lm/W, 2500—3500 K is 165/145/120 lm/W, 3500—5000 K is 175/155/130 lm/W, and above 5000 K there are only three grades at 150 lm/W; the colour rendering index requirement for road lighting is not less than 70. standard text GB 38450-2019 covers LED panel lights for general lighting. National Standards Full-Text Public System
The colour rendering index must be read in parts. Ra is the average of the eight standard colour samples R1 to R8; R9 is saturated red, and white LEDs often have a low R9. Energy Star Luminaires V2.2 (terminated at the end of 2024) required Ra not below 80 and R9 greater than 0; GB 50034 requires Ra not below 80 for office lighting; GB 55016-2021 requires Ra not below 80, R9 not below 0 and colour tolerance not exceeding 5 SDCM for rooms where people work or stay for long periods, and Ra not below 90 in places where colour discrimination is critical. Energy Star Luminaires V2.2 (terminated) GB 50034 clauses Ministry of Housing and Urban-Rural Development announcement The threshold for road lighting is Ra 70 and for office lighting Ra 80, a difference of 10 units: different uses, different thresholds.
Colour temperature and colour tolerance must be specified together. Colour temperature describes how warm or cool white light is; colour tolerance describes how far a batch of products deviates from the target colour temperature. ANSI C78.377 defines the permitted range for each colour temperature with seven-step quadrangles; GB 55016-2021 writes 5 SDCM into its clauses, and 5 SDCM has therefore become a common acceptance line. Energy Star Luminaires V2.2 (terminated) Ministry of Housing and Urban-Rural Development announcement In procurement it is not enough to write "4000K"; write "4000K, within 5 SDCM" and require the colour difference within a batch to stay within the agreed range. Colour tolerance above the limit is more visible in project acceptance than insufficient efficacy: with dozens of luminaires on one wall, the colour difference can be seen at a glance.
The glare metric is the unified glare rating, which evaluates the discomfort caused to an observer by indoor lighting and depends on luminaire luminance, background luminance, room dimensions and observer position. In GB 50034-2013, general offices have UGR not greater than 19 and service halls not greater than 22, and both require Ra not below 80 (the standard has been replaced by GB/T 50034-2024, effective 1 August 2024; the old values are still common in existing contracts, and the version should be stated when cited); GB 55016-2021 stipulates UGR not greater than 19 for long-term visual tasks. GB 50034 clauses Ministry of Housing and Urban-Rural Development announcement UGR is a room-level calculation; a luminaire's "anti-glare design" alone proves nothing, and the supplier should be asked to provide the calculation conditions: room dimensions, ceiling and wall reflectance, mounting height and observer position.
Flicker and blue light hazard are two separate reports. Flicker is evaluated under NEMA 77 and IEEE 1789; procurement specifications often write "no visible flicker", and the supplier can be asked to provide the flicker percentage and the SVM value. Blue light hazard is graded RG0, RG1 and RG2 under GB/T 20145 (corresponding to IEC 62471); GB 7000.1-2015 further requires, in line with IEC/TR 62778, that portable luminaires for children shall not exceed RG1 at 200 millimetres. standard interpretation
Table 6-1 Thresholds, Reports and Common Misleading Claims for the Three Metrics
| Metric | Definition | Common threshold | What report to read | Common misleading claim |
|---|---|---|---|---|
| Luminous efficacy | Total luminous flux divided by input power | Finished luminaire 100—150 lm/W; road lighting in three grades by colour temperature | LM-79 | Using package efficacy in place of luminaire efficacy |
| Colour rendering index | Ra is the average of R1—R8; R9 is saturated red | Ra≥80 and R9>0; Ra≥90 where colour discrimination is critical | LM-79 itemised data | Reporting Ra only, not R9 |
| Glare | UGR, a room-level calculated value | Office≤19; service hall≤22 | UGR calculation | Using shielding angle in place of UGR |
| Colour tolerance | Degree of deviation from the target colour temperature | ≤5 SDCM | LM-79 chromaticity data | Specifying colour temperature only, not tolerance |
| Power factor | Active power divided by apparent power | ≤5 W≥0.50; >5 W≥0.90 | Electrical test report | Confusing power factor with harmonics |
| Harmonics | Share of each harmonic current | GB 17625.1-2022 Class C | Harmonic test report | Testing the finished luminaire only, not the driver |
Table compiled by this Part from public standards and testing requirements.
Ask the following seven questions in procurement and most of the vagueness in the parameters will be squeezed out. First, is there an LM-79 report, do the model, power and luminous flux on the report match this delivery, and is the testing body accredited? Second, is the efficacy that of the finished luminaire or of the package; if the package, what is the measured efficacy of the finished luminaire? Third, what are Ra and R9, and can the itemised values for R1 to R15 be provided? Fourth, what are the colour temperature and the colour tolerance in SDCM, and how is colour difference within a batch controlled? Fifth, what are the calculation conditions for UGR, and can the calculation be provided? Sixth, were power factor and harmonics tested to GB 17625.1-2022 Class C, and can the report be supplied with the goods? Seventh, is the lifetime data from LM-80 or from TM-21 extrapolation, does the extrapolation factor exceed 6, and does the report state clearly that this is light source component data and not the life of the finished luminaire?
Chapter 7 The Boundary between Luminaire Makers and Device Makers
A luminaire consists of a light source, a driver, optical parts, structural parts, fasteners and packaging. Which of these stages a luminaire maker performs determines what kind of plant it is: assembly only, or optical and thermal design as well, or the driver made in-house too.
An assembly-type luminaire maker buys in the LED packages, drivers, housings and optical parts and does its own surface mounting, assembly, ageing and packing. Investment is small, new models come quickly and quotations are low; quality depends on incoming material and process discipline. A design-type luminaire maker does its own optical design, thermal design and structural tooling, buys in the light source and driver, can supply light distribution curves and thermal design documentation, and can take on project work. A vertically integrated luminaire maker develops its own drivers, does its own LED packaging and may even hold a stake in a chip maker; investment is large and the cycle long, and batch consistency and cost control are the best of the three.
Table 7-1 The Division of Work among the Three Types of Luminaire Maker
| Type | Done in-house | Purchased | Investment and new models | Quality capability | Typical orders |
|---|---|---|---|---|---|
| Assembly type | Surface mounting, assembly, ageing, packing | LED packages, drivers, housings, optical parts | Small investment, fast new models | Depends on incoming material and process discipline | General lighting, wholesale, e-commerce |
| Design type | Optical design, thermal design, structural tooling, assembly | LED packages, drivers | Moderate investment | Can provide light distribution and thermal design | Commercial lighting, project work |
| Vertically integrated type | Drivers, packaging, optics, structure, assembly | Chips or some components | Large investment, long cycle | Best consistency and cost control | Large customers, export, automotive |
Table compiled by this Part from the division of work in the industry; in practice the boundaries between the three often overlap in individual enterprises.
The boundary of the division of work is moving. Packaging plants are moving downstream into modules, light strips and light engines, putting the driver and light source on one board and selling directly to luminaire makers; chip companies are moving downstream into packaging, MLS's packaging business being one example; driver makers are making light engines, bundling driver and light source. Luminaire makers are moving upstream into drivers and optics. The direction of movement is the same: towards the end closer to the customer and higher in added value.
Certification and responsibility must be looked at together. A luminaire's CCC certificate is applied for in the name of the luminaire maker, on the basis of luminaire safety standards and the accompanying performance standards; the GB 7000 series became recommended GB/T standards in 2023, and the specific changes are set out in Chapter 16. Key components such as drivers and LED packages carry voluntary certification. The luminaire maker is responsible for the finished luminaire, but failures may originate in components: lumen depreciation from the chip and heat dissipation, colour difference from packaging binning and phosphor, flicker from the driver, yellowing from optical materials. The contract must allocate responsibility for these four classes of problem; see Chapter 29.
Procurement should ask four questions: who supplies the LED packages, who supplies the driver, who designs the optics, and in whose name the certification is held. The four answers determine three things: the boundary of responsibility, the room for negotiation and the freedom to substitute. If both the LED package and the driver are specified brands, the luminaire maker has little room to substitute and its quotation is firm; if the luminaire maker holds alternatives, there is more room to negotiate.
Judging a luminaire maker's capability means looking at four hard conditions and two soft capabilities. The hard conditions are: whether it has an integrating sphere or goniophotometer and can measure light itself; whether it has an ageing line and can screen out early failures; whether it has incoming inspection and can stop non-conforming LED packages and drivers; whether it has reliability testing covering high and low temperature, damp heat, lightning surge and vibration. The soft capabilities are: whether it can provide light distribution curves and thermal design documentation; whether it has stable component suppliers and fixed bin grades.
Small plants survive for good reasons. The minimum efficient scale is low: one assembly line, a few workstations and an ageing rack are enough to start. Cluster support is complete: tooling, hardware, electroplating, packaging and logistics can all be found within the same town. There are many niche styles: one hit product can feed a plant for a year. Project service is flexible: local projects, fast response and negotiable payment terms. The more than 30,000 business entities mentioned in Chapter 1 are the result of this industrial organisation; summing them up with the single word "fragmented" would miss the position each of them occupies.
The boundary has its costs. Information asymmetry exists between device makers and luminaire makers: the luminaire maker does not know the true bin distribution of the LED packages, and the device maker does not know the thermal conditions and driver parameters of the finished luminaire. The two unknowns compound, and the result is a sample that passes the test and a production run that drifts. Closing this gap depends on four things: incoming inspection, sealed reference samples, batch traceability and on-site supplier audits. The four are not costly, provided the luminaire maker has a quality system.
The boundary of the division of work shifts with scale, certification and customer structure, and no single model suits every order. What procurement should examine is whether this plant does well within its own boundary; scale is only a reference, and capability within the boundary is the basis for the quotation.
Part Two: Scale, Exports and Geography
Chapter 8: The 107,000 Lighting Entities in This Database (Keyword Basis)
The industry field in the Tianxia Gongchang enterprise database only goes down to the major category of the Industrial Classification for National Economic Activities. Lighting fixture manufacturing sits under electrical machinery and apparatus manufacturing and is a medium category; the database has no corresponding code field, so figures cannot be taken directly by industry code. To obtain the supply-side scale of this sub-industry, the Institute switched to keyword matching: entities whose company name, product and service summary or business scope contains any of the terms "lighting", "luminaire", "decorative lighting", "light pole", "light source", "LED", "light-emitting diode", "street light", "floodlight", "downlight" or "light strip" are counted. Any hit is counted, with no secondary screening by main business.
This basis covers four types: finished-luminaire and assembly plants; supporting plants making LED packaging, drivers, lamp holders and sockets; trading and project-installation entities whose main business is lighting; and device companies with "optoelectronics" or "semiconductor lighting" in their names. At the same time it misses four types: contract manufacturers that only process supplied materials and use no lighting term in either name or business scope; supporting plants registered as "metal products" or "plastic products" that actually make lamp housings and frames; pure trading companies; and self-employed businesses. The figure of 107,040 should be read as "operating entities identified by lighting as their business label", which is not the same thing as "lighting fixture manufacturing enterprises" in the statistical definition.
The gap between the two can be shown by a comparison. A notice from the China Association of Lighting Industry reports that in 2024 there were more than 3,600 lighting fixture manufacturing enterprises above designated size; 107,040 divided by 3,600 is about 30 times. Enterprises above designated size are classified by industry code and subject to an operating revenue threshold; they are the top of the industry pyramid, while the keyword entities in this database cover the body and the base. Using the number of enterprises above designated size to estimate the scale of industry entities would understate it by an order of magnitude.
The table below is compiled on the "4-Lighting LED" keyword basis of this database, with data as of October 2026.
| Indicator | Value |
|---|---|
| Entities matched by keyword | 107,040 |
| Total insured persons | 3,689,501 |
| Entities with insured persons greater than zero | 70,254 |
| Share with insured persons greater than zero | 65.6% |
| Entities with zero or undisclosed insured persons | 36,786 |
| Average insured persons per entity (all entities) | 34.5 |
| Average insured persons per entity (entities above zero) | 52.5 |
The two per-entity averages differ by 18 persons, and the whole difference comes from the 36,786 entities with no insurance record. Calculated on entities with an insurance record, the average is 52.5 persons, corresponding to a finished-luminaire or supporting plant with a few hundred square metres of floor space, two or three assembly lines and several dozen workers. This scale is consistent with the dispersed structure of downstream applications described in Chapter 1: the entry threshold at the finished-luminaire assembly stage lies in equipment and orders, not in capital.
The 34.4% of entities with zero or undisclosed insured persons requires three explanations used together. Newly established entities have not yet begun to hire, and their annual reports disclose zero; trading and project-installation entities hire by project, and their social insurance relationship sits elsewhere; annual reports are filed by agencies and the social insurance data is not synchronised. All three situations look like zero, and reading every one of them as a shell company would misjudge the most active group of small entities in the industry.
The first layer of the provincial distribution is three dominant provinces; the second layer is a long tail.
| Province | Entities | Share of this database sample | Cumulative share |
|---|---|---|---|
| Guangdong Province | 34,488 | 32.2% | 32.2% |
| Zhejiang Province | 14,582 | 13.6% | 45.8% |
| Jiangsu Province | 13,055 | 12.2% | 58.0% |
| Shandong Province | 7,447 | 7.0% | 65.0% |
| Hebei Province | 4,814 | 4.5% | 69.5% |
| Fujian Province | 3,845 | 3.6% | 73.1% |
The top six provinces total 78,231 entities, or 73.1%. Adding Anhui with 3,112 and Henan with 2,755, the top eight provinces account for 78.6%, and the remaining provinces total 22,942 entities, or 21.4%. Guangdong alone has 34,488, which is 6,851 more than the 27,637 of Zhejiang and Jiangsu combined, or 24.8% more.
Two points in this table need to be retained. Hebei ranks fifth with 4,814 entities, ahead of Fujian; public evidence contains no output value or export data for a Hebei lighting cluster, so only the entity count is recorded here; the keyword list includes "light pole", so street-light pole and steel-structure pole companies may be counted as a result, and the existing fields cannot verify this. Shandong's 7,447 entities likewise lack cluster data.
Within provinces, lighting entities are further concentrated in a small number of districts and counties: Zhongshan alone accounts for 25.4% of Guangdong, and Yuyao alone for 10.5% of Zhejiang. Nationally, however, the leading share at county level is much lower than at provincial level, with the top six places together accounting for only 19.5%.
| County, city or district | Located in | Entities | Share of the provincial sample |
|---|---|---|---|
| Zhongshan | Guangdong | 8,760 | 25.4% |
| Dongguan | Guangdong | 4,283 | 12.4% |
| Bao'an District | Shenzhen, Guangdong | 3,030 | 8.8% |
| Nanhai District | Foshan, Guangdong | 1,880 | 5.5% |
| Yuyao | Ningbo, Zhejiang | 1,538 | 10.5% |
| Shunde District | Foshan, Guangdong | 1,333 | 3.9% |
The six places total 20,824 entities, or 19.5% of this database sample. Of these, the five Guangdong districts and cities account for 19,286, or 92.6% of the six, and 55.9% of the Guangdong sample in this database. Zhongshan alone has 8,760, or 8.2% of the sample, 2.05 times the second-placed Dongguan; Yuyao's 1,538 is equivalent to 17.6% of Zhongshan.
Placing the provincial and county levels side by side, the lighting industry shows a dual concentration: between provinces it concentrates in Guangdong, Zhejiang and Jiangsu (58.0%), and between counties in the five districts and cities of the Pearl River Delta plus Yuyao in Zhejiang. This mirrors the concentration gradient described in Chapter 1. The top six upstream companies hold 80% of capacity (prospectus, as cited), which is concentration by capacity; nearly one fifth of the hundred thousand or so downstream entities fall in six county-level units, which is concentration by geography. The two mechanisms differ: the former rests on capital and technology thresholds, the latter on the radius of the supporting supply chain and specialised markets.
This explains why both statements — "the lighting industry is highly fragmented" and "the lighting industry is highly concentrated" — can hold. Fragmentation refers to the number of entities and to the finished-luminaire assembly stage; concentration refers to capacity, export orders and industrial clusters. When citing figures from either side, first establish which layer it describes; mixing the two layers yields completely opposite conclusions.
Chapter 9: Zhongshan Guzhen: From Decorative Lighting to LED
In October 2002, the China Association of Lighting Industry reviewed and approved, and conferred on Guzhen Town in Zhongshan City, the title "China's Capital of Decorative Lighting" (association chronology). The association was founded in Tianjin in 1989 and thereafter gradually established a mechanism for naming and re-evaluating characteristic regions of the lighting industry. Other materials state that the title was jointly assessed by the China National Light Industry Council and the China Association of Lighting Industry; this article follows the record in the association's chronology.
Lining up the years in which the three clusters received their titles shows the order of this naming mechanism: Guzhen in 2002, Yuyao in 2005, and Zouqu in Changzhou in 2007. The wording of the three titles also differs — "Capital of Decorative Lighting", "Lighting Fixture Manufacturing Base", "China Lighting City". The wording distinguishes three forms: origin, manufacturing, market.
The wording "Capital of Decorative Lighting" deserves attention. Decorative lighting refers to finished luminaires whose main selling point is form, material and decorative effect, and it belongs to a different stage from light sources and devices. This positioning describes Guzhen's place in the chain: what gathers in the town is the design, hardware, glass, electroplating, assembly and exhibition trade of finished luminaires; chips, epitaxy and packaging are all outside the town.
According to a CCTV report, Guzhen covers less than 50 square kilometres and gathers more than 30,000 decorative lighting business entities; decorative lighting sales account for 70% of the domestic market and 50% of the international market for comparable products, and products are exported to more than 130 countries and regions. The four figures have distinct roles: the first two answer "how large", the last two answer "how deep". Calculated at 50 square kilometres, that is more than 600 business entities per square kilometre, a density produced by a specialised market and an origin town in the same place.
The denominators of 70% and 50% need to be stated clearly. 70% is the domestic share of decorative lighting sales, 50% is the share of the "international market for comparable products", and both denominators are confined to decorative lighting; they cannot be generalised into "Chinese lighting accounts for half of the world". The same report places these two ratios alongside "more than 30,000 business entities", and together they form the three figures most often cited in external statements.
On output value, public materials give figures at three different orders of magnitude. Annual cluster output value exceeds RMB 100 billion — this is the cluster basis, covering all business entities in Guzhen and the surrounding towns and sub-districts; the total output value of the decorative lighting industry within Guzhen town was RMB 14 billion (140 hundred million yuan) in 2020 — this is the town basis, and the year is earlier; and the 558 industrial enterprises above designated size in Zhongshan achieved a total output value of RMB 37.5 billion in 2024 — this is the above-designated-size basis. The denominators of the three figures are, in order, "Guzhen and the surrounding towns and sub-districts", "Guzhen town" and "Zhongshan's above-designated-size enterprises", and the years also differ; placed in the same paragraph they appear contradictory, but separately each holds.
Dividing RMB 37.5 billion by 558 entities gives an average total output value of about RMB 67.2 million (6,720 ten thousand yuan) per entity; if output value is taken as an approximation of operating revenue, this is more than three times the operating revenue threshold for enterprises above designated size (RMB 20 million). Total output value and operating revenue are not the same indicator, so this serves only as an order-of-magnitude reference. This per-entity average indicates that Zhongshan's above-designated-size lighting enterprises are mainly medium-sized plants, forming two layers with the many small and micro enterprises in Guzhen town. The Zhongshan figures above come from the Zhongshan Yearbook 2025; direct retrieval encountered a certificate error and only the search abstract was obtained, so citation should note the source and the method of access.
The same yearbook contains two further statements that need handling. "Self-owned brand products hold more than 70% of the national market, and export value ranks first in the country" is very close to Guzhen's "70% domestic", possibly a citation from the same origin; this article does not stack the two into 140% or "two seventies". In "30,000 decorative lighting-related enterprises, 200,000 persons employed, 5 large specialised markets and decorative lighting transaction value of RMB 50 billion", the 30,000 enterprises differ from the 8,760 in Zhongshan in this database because the statistical objects differ: the former includes self-employed businesses and market vendors, while the latter includes only corporate legal entities and business entities and requires a keyword match.
A set of figures illustrates the division of work among the towns and sub-districts within Zhongshan. Guzhen has 4,065 LED enterprises, Henglan 4,436 and Xiaolan 2,621. Henglan has more than Guzhen, an order that indicates Guzhen's role leans towards exhibition trade, branding and design, with production spilling over into neighbouring Henglan and Xiaolan. The difference between Guzhen's more than 30,000 business entities and its 4,065 LED enterprises consists mainly of market vendors, shops and supporting services.
The transition from decorative lighting to LED in Guzhen takes the form of changing the light source without changing the process. The process sequence for decorative lamps is design, mould making, die casting, polishing, electroplating, assembly and inspection; LED replaces the light source and driver within it, while the upstream hardware and surface treatment and the downstream assembly and exhibition trade pattern remain unchanged. This explains how the number of LED enterprises in the town could grow rapidly within a dozen years while the spatial structure of the industrial cluster remained essentially stable.
Chips and epitaxy are not in Guzhen, and neither is packaging. What Guzhen buys are lead frames, LED packages, drivers and optical components. The concentration gradient described in Chapter 1 appears here as a bargaining relationship: the top six upstream companies hold 80% of capacity, and Guzhen's more than 4,000 LED enterprises face a small number of suppliers, while their own customers are distributors and contractors dispersed across the country. Guzhen's 70% is a share of domestic decorative lighting sales and has nothing to do with the national lighting industry share; when citing this figure, the denominator must be stated alongside it.
Chapter 10: Other Guangdong Clusters: Dongguan, Shenzhen, Foshan
The four figures for Guangdong Province as a whole belong to different bases, so each is listed first. In 2024, the province's industrial enterprises above designated size in lighting fixture manufacturing recorded operating revenue of RMB 177.146 billion and export delivery value of RMB 54.92 billion (Nanfang News Network), with about 1,875 enterprises above designated size, and output of luminaires and lighting devices accounting for 71% of the country (Jinan Times). The four figures belong to four bases — revenue, delivery value, number of enterprises and output — and their sources are not entirely consistent.
Only one of them can be verified internally. The 1,875 enterprises are 52% of the country's more than 3,600, consistent with the statement "more than half of the country". The other three cannot be cross-checked against each other.
Revenue of RMB 177.146 billion does not match "about 70% of the country". The association's notice states that in 2025 revenue of enterprises above designated size "exceeded RMB 380 billion", and that in 2024 it was "broadly flat on the previous year"; on that basis, national above-designated-size revenue in 2024 was roughly between RMB 370 billion and RMB 380 billion. Guangdong's RMB 177.146 billion is about 47% of that, less than half. If the denominator is instead the output value of the entire lighting industry, RMB 589 billion, Guangdong's share is about 30%. Neither calculation reaches 70%. The 70% more likely corresponds to a basis of "luminaire output" or "export value". This article lists the two sets of figures side by side and does not write "70%" as a revenue share.
Export delivery value of RMB 54.92 billion likewise cannot coexist with "export value accounting for more than half of the country" on the same basis. National exports of lighting products in 2024 were USD 56.1 billion (561 hundred million USD), equivalent to about RMB 398.3 billion to RMB 403.9 billion at 7.1 to 7.2; RMB 54.92 billion is only 13.6% to 13.8% of that. A possible source of the difference is that export delivery value counts only the self-operated deliveries of industrial enterprises above designated size, whereas national export value includes all business entities and traders. The report gives no explanation.
There is another small inconsistency in the output share. The same report writes "output of luminaires and lighting devices accounts for 71% of the country" and also "two of every three decorative lighting products in the country are made in Guangdong". The latter is about 66.7%, roughly 4 percentage points away from 71%. The former is a statistical value, the latter an approximation; when citing, take the former.
The distribution of entities within the Pearl River Delta is shown in the table below; the data follow the keyword basis of this database.
| City and district | Entities | Share of Guangdong |
|---|---|---|
| Zhongshan | 8,760 | 25.4% |
| Dongguan | 4,283 | 12.4% |
| Bao'an District, Shenzhen | 3,030 | 8.8% |
| Nanhai District, Foshan | 1,880 | 5.5% |
| Shunde District, Foshan | 1,333 | 3.9% |
| Total of the four cities | 19,286 | 55.9% |
The four cities total 19,286 entities, or 55.9% of Guangdong, with the remaining 15,202 dispersed across other prefecture-level cities. Guangdong's lighting entities thus form two spatial segments: Zhongshan and Foshan on the west bank of the Pearl River estuary, and Shenzhen and Dongguan on the east bank. The west bank is dominated by finished luminaires, the east bank by electronics manufacturing and export contract manufacturing.
Foshan's materials are relatively complete. In January 2024 the Nanhai District Lighting Association disclosed 262 members and 127 above-designated-size lighting enterprises. The 127 represent 6.8% of Guangdong's 1,875 above-designated-size enterprises. Nanhai has the full chain of upstream chips, midstream packaging and downstream applications, and in 2023 applied for designation as a Guangdong semiconductor lighting industrial cluster. This structure is complementary to Zhongshan's: Zhongshan is strong in finished products and exhibition trade, Nanhai in a complete chain. Earlier public materials show that Foshan's electric light source output value already exceeded RMB 10 billion in 2009, with more than 400 upstream and downstream enterprises (investment materials); this is a historical basis and cannot be directly connected to the 2024 figures.
Foshan's luminaire exports saw one sharp fall in 2023. In 2023 Foshan exported about USD 2.08 billion of luminaires, down about 40.8% year on year (21st Century Business Herald). In 2023 national exports of lighting products were USD 58.2 billion (the association's basis for listed-company analysis). Foshan's -40.8% and the national figure belong to different years: the former is the 2023 decline against 2022, the latter the 2024 level against 2023, and the two cannot be directly divided for comparison. Public reports do not explain the cause of Foshan's decline; it may involve adjustment of the statistical basis, capacity relocation by leading enterprises or a change in order structure. This article does not attribute it.
Dongguan and Bao'an in Shenzhen have 4,283 and 3,030 entities respectively in this database, totalling 7,313, or 21.2% of Guangdong. Public evidence did not obtain output value or export data for lighting in these two places, so only entity counts are recorded here. Judging from the general pattern of division of labour in the national industrial chain, lighting enterprises in Shenzhen and Dongguan overlap heavily with the electronics manufacturing base: LED packaging, drivers, displays and smart controllers have an independent industrial base in these cities, and lighting is one application direction within it. This judgement requires industry-specific data for the two cities, and the available evidence is insufficient to confirm it.
Shunde has 1,333 entities, and together with Nanhai 3,213, or 9.3% of Guangdong. The number of lighting entities in Foshan as a city is smaller than in Dongguan as a city, an order that does not match Foshan's reputation in finished luminaires; one reason is the keyword basis: Foshan's home-appliance supporting enterprises and metal-structure enterprises do not enter the statistics if they use no lighting term.
The three forms can be summarised as follows: Zhongshan is finished decorative lighting plus specialised markets, with the most entities and the smallest individual size; Shenzhen and Dongguan are an electronics manufacturing base plus export contract manufacturing, with larger individual entities; Foshan is a complete chain plus home-appliance supporting, with a higher density of above-designated-size enterprises. The three forms share the same upstream supply and face different sources of orders.
Chapter 11: Zhejiang: Yuyao, Ningbo, Wenzhou
Zhejiang has 14,582 entities, 13.6% of the country, second only to Guangdong. Zhejiang's position on the two sides of "luminaire" and "electric light source" is not the same. In 2024 Zhejiang produced about 3.7 billion electric light sources, 32% of the country, making it the largest producing region for electric light sources; in the same year Guangdong produced about 5.8 billion luminaires and lighting devices, 71% of the country (China Lighting Network). The division of labour between the two sides is thereby established: Zhejiang leans towards light sources and outdoor luminaires, Guangdong towards indoor finished luminaires.
These two sets of ratios can be cross-validated with absolute values. National output of electric light sources is about 11.6 billion units; 3.7 divided by 11.6 is 31.9%, consistent with 32%. Guangdong's 5.8 billion luminaires corresponding to 71% implies a national total of about 8.17 billion; this is in the same order of magnitude as the association's "more than 8.2 billion", and given the rounding interval of 5.8 billion the two can be reconciled, though this is not grounds for asserting exact equality. Ratios and absolute values corroborating each other is not common among the data cited in this article.
Yuyao's titles have two layers. According to town information and industry media, it received the title "China's Home Town of Luminaires" from the Ministry of Agriculture in 2001; one account puts the conferral in 2002, and the original conferring document was not obtained. In April 2005, the China National Light Industry Council and the China Association of Lighting Industry jointly named it "China Lighting Fixture Manufacturing Base" (industry media). The first title comes from the agricultural system, the second from the light industry and lighting industry associations, and the assessing bodies and the years both differ. In the main text it is appropriate to write "received the Ministry of Agriculture's title 'China's Home Town of Luminaires' in 2001 (original document not obtained)" and to retain the possibility of the other account.
Yuyao's product structure and export data are relatively clear (CRI Online). The locality currently has more than 250 luminaire export enterprises of various kinds, exporting RMB 3.95 billion of luminaires in 2023 and RMB 2.59 billion in January to July 2024, up 12.9% year on year. It positions itself as one of the country's and the world's luminaire distribution centres and export bases, with products mainly garden lights, solar lights and smart garden lights, and launches 30 to 60 new products each year.
The full-year figure for 2024 has not been published, so one estimate by ratio can be made, with the inputs and formula stated. Exports in January to July 2023 were about 2.59 divided by 1.129, that is RMB 2.29 billion; January to July accounted for 58.1% of the full-year RMB 3.95 billion. If the monthly distribution in 2024 is similar to that in 2023, full-year exports are about 2.59 divided by 0.581, that is RMB 4.46 billion. This is an estimate, suitable for judging order of magnitude and not to be cited as a statistical figure.
Yuyao has 1,538 entities in this database, 10.5% of Zhejiang. Set against the 250 export enterprises, export enterprises account for about 16%, and the rest are domestic-sales, supporting and service entities. The two figures have different bases and can only be compared in order of magnitude; export dependence cannot be calculated from them.
Garden lights and solar lights are two segments of outdoor lighting. The technical threshold for this type of product concentrates on structure, waterproofing, and the matching of solar panels with batteries. Yuyao's position therefore differs from Guzhen's: Guzhen makes decorative indoor lighting, relying on styles and exhibition trade; Yuyao makes functional outdoor luminaires, relying on export orders and project supporting. The two places buy the same batch of LED packages and drivers upstream, and face completely different customers downstream.
Ningbo's lighting entities are mainly in Yuyao. Yuyao is a county-level city administered by Ningbo; among the top eight counties in this database, Zhejiang has only Yuyao with 1,538 and Yueqing with 1,208, and all other districts and counties in Ningbo are below 1,208. It can therefore be judged that lighting entities within Ningbo municipality are highly concentrated in Yuyao, with the remaining districts and counties scattered. The boundary of this judgement is that the database counts only entities matched by keyword; Ningbo's trading and foreign trade entities that do not use lighting in their names are not included.
Yueqing is a county-level city administered by Wenzhou, with 1,208 entities in this database, 8.3% of Zhejiang. Public evidence did not obtain output value, export or title data for a Wenzhou lighting cluster; this article records only the entity count and makes no judgement on scale. It should be noted that Yueqing's manufacturing strength is electrical machinery, which belongs to the same major category — electrical machinery and apparatus manufacturing — as lighting; "LED" is not rare in the business scope of electrical enterprises, and the count for Yueqing may include the lighting-related business of electrical enterprises. This cannot be verified within the existing fields and should be treated with reservation when cited.
Zhejiang's 14,582 and Guangdong's 34,488 differ by 2.4 times, yet Zhejiang accounts for 32% of electric light source output and Guangdong for 71% of luminaire output. The positions of the two provinces are thereby distinguished: Guangdong is strong in finished luminaires and exports, Zhejiang in light sources, outdoor luminaires and supporting products. To judge a province's position in the lighting industry, look separately at the two lines of "luminaire" and "electric light source"; merging them into a single "lighting" total flattens the division of labour.
Chapter 12: Jiangsu and Fujian: Zouqu in Changzhou, Xiamen
Jiangsu has 13,055 entities, 12.2% of the country, ranking third. Jiangsu's lighting entities are distributed differently from Guangdong's and Zhejiang's: it has no finished-luminaire origin that holds a national share, but in the circulation stage it has a national market node — Zouqu in Changzhou.
In 2007, the China Association of Lighting Industry awarded Zouqu the title "China Lighting City" (China Financial Information Network), and it passed re-evaluation in 2011, 2015 and 2020. Total operating area exceeds 600,000 square metres, luminaire merchants exceed 5,000, annual transaction value exceeds RMB 12 billion, and there are more than 1,300 luminaire manufacturers. In 2024, online sales of luminaires in Zouqu exceeded RMB 5 billion. In the field of outdoor lighting it is one of the country's largest production bases; the report did not give a share.
The five figures belong to three levels: 600,000 square metres, 5,000 merchants and RMB 12 billion of transaction value are the circulation basis; more than 1,300 manufacturers are the manufacturing basis; RMB 5 billion of online sales is the channel basis, and the three levels cannot be divided directly. If the RMB 5 billion online is included in the RMB 12 billion transaction value, it accounts for 41.7%; if it is an additional basis, the total is RMB 17 billion and it accounts for 29.4%. The report does not state which applies, so this article lists both.
More than 1,300 manufacturers are equivalent to 10.0% of Jiangsu's 13,055 entities in this database, but the two figures cannot be compared directly. If all these 1,300-odd were independent corporate legal entities mainly engaged in lighting, Changzhou should have a district or county among the top eight counties in this database, where the eighth place is Yueqing with 1,208; in fact it does not. Three explanations are possible: self-employed businesses and branch companies are included; some enterprises are registered as "metal products" or "plastic products" and were not matched by keyword; the statistical scope crosses districts and counties and does not fall within a single one. All three point to the same conclusion: market-type clusters are counted by "merchants" and origin-type clusters by "legal entities", and the two figures must be converted to the same basis before being placed in one table.
Zouqu's role is circulation. Its 5,000 merchants face the more than 1,300 manufacturers in the surrounding area and a national distribution network; Guzhen's market and origin are in the same town, while Zouqu's market reaches further than its local capacity.
Fujian's direction is entirely different. On 13 April 2004, the Ministry of Science and Technology designated Xiamen as a National Semiconductor Lighting Engineering Industrialisation Base; Xiamen was the country's first and is one of two Class A bases (Xiamen Investment Promotion Bureau). This timing precedes the point at which LED lighting replaced incandescent lamps on a large scale in China, indicating that Xiamen's starting point was on the device side.
Xiamen's scale figures are listed by three sub-clusters. Direct output value of optoelectronic semiconductors rose from RMB 3.5 billion in 2003 to RMB 209.8 billion in 2023, about 60 times. In 2023, the LED industry chain cluster recorded RMB 42.4 billion, flat panel display RMB 101.3 billion and integrated circuits RMB 33.9 billion; the three total RMB 177.6 billion, or 84.7% of direct optoelectronic semiconductor output value. LED enterprises in the city grew from more than 20 at the outset to more than 100, and there are 132 optoelectronic semiconductor high-tech enterprises. Xiamen positions itself as the country's largest LED epitaxial wafer and chip manufacturing base.
The proportions of the three sub-clusters deserve separate mention: the LED chain cluster accounts for 20.2%, flat panel display 48.3% and integrated circuits 16.2%. Xiamen's lighting-related output value is less than a quarter of this structure, the main body being displays and integrated circuits. This affects the way Xiamen's data should be cited — writing RMB 209.8 billion as "Xiamen's lighting output value" would overstate it by nearly five times.
Xiamen and Nanchang can be viewed together. In 2024 the LED cluster in Nanchang High-tech Zone recorded revenue of RMB 20.6 billion, up 43% year on year (Nanchang Daily); on that basis 2023 was about RMB 14.4 billion. Nanchang's technology marker is the silicon substrate: the "high-efficiency GaN-based blue light-emitting diode on a silicon substrate" by Jiang Fengyi's team at Nanchang University won a first prize of the National Technological Invention Award (Phoenix), and more than 70 chain enterprises, including MLS, AMEC and Lianchuang Optoelectronics, have gathered around Lattice Power (Phoenix). Jiangxi Province recorded LED revenue of RMB 71.59 billion in 2023 (Jingchu Network); Nanchang High-tech Zone's RMB 20.6 billion is 28.8% of that, the two figures belong to different years, and the comparison serves only as an order-of-magnitude reference. A secondary source states that Nanchang High-tech Zone holds more than 80% of the global market for MOCVD (metal-organic chemical vapour deposition) equipment; no primary statistic was seen, so citation requires attribution.
Xiamen and Nanchang represent two technology routes. Xiamen is a national LED base positioned in epitaxial wafer and chip manufacturing; Nanchang's marker is the silicon substrate. The difference between the two routes lies in the substrate material, with process details given in Chapter 2. By scale, Xiamen's LED chain cluster is RMB 42.4 billion and Nanchang High-tech Zone's RMB 20.6 billion, so Xiamen is about 2.06 times Nanchang. The two figures belong to 2023 and 2024 respectively, and their statistical scopes also differ; the comparison serves only as an order-of-magnitude check.
Fujian has one further piece of data that needs separate mention. In 2024, Fujian was one of the main producing regions of electric light sources, and its output fell 75% year on year; in the same year Hunan rose 95% (association notice). In the same association notice, five main producing regions rose and fell, and Fujian's decline cannot be explained on the demand side. A single province falling by three quarters within one year is more likely related to enterprises ceasing production, relocating or an adjustment of the statistical basis; the association notice gives no explanation. Placed alongside this output decline, Fujian's 3,845 keyword entities can show only one thing: entity counts are a stock and output is a flow, and the two can move in opposite directions in the same year.
Chapter 13: Export Structure: Main Markets and Recent Changes
For the 2024 export value there are two statements, both from within the China Association of Lighting Industry system. An export bulletin published in January 2025 gives USD 56.1 billion, down 0.3% year on year; a listed-company analysis published in May 2025 gives USD 56.3 billion, down 3.3%. The two absolute values differ by USD 200 million and the growth rates by 3 percentage points, with four months between the publication dates. This article lists both and does not choose one.
The difference may come from statistical scope and timing: the January bulletin usually relies on preliminary customs data, the May analysis has been revised, and the commodity scope may also have been adjusted. The evidence did not obtain the basis statements of either original text; the above is only a conventional inference.
For 2025 there is only one set: total exports of lighting products for the year were about USD 49.9 billion, down about 11% year on year, accounting for about 2.2% of the export value of mechanical and electrical products (association notice, reproduced). In 2024 this proportion was about 3% (secondary basis), consistent in direction with the -11% in export value.
The commodity structure is examined separately for the two years. In 2024, exports of luminaire products were about USD 42.4 billion, 76% of all lighting product exports; electric light source products were about USD 6.3 billion, down 8.5% year on year, with export volume of 22.8 billion units, up 35%. The two together total USD 48.7 billion, 86.8% of the USD 56.1 billion, with the remaining USD 7.4 billion accounted for by LED modules, photovoltaic lighting devices and other categories.
In 2025, luminaire exports were about USD 37.2 billion, down 12%, accounting for 74%; electric light sources about USD 5.5 billion, down 12%, with export volume of 25.4 billion units, up 11%. The two together total USD 42.7 billion, 85.6% of the USD 49.9 billion. By category, fixed luminaires were about USD 8.6 billion (-21%) and portable luminaires about USD 2.6 billion (-25%); the two total USD 11.2 billion, 30.1% of luminaire exports (NetEase, reproduced).
Two sets of data on the degree of LED conversion contain a basis trap and need to be separated. The 2024 bulletin states that exports of LED electric light sources were about 12.4 billion units, up about 78% year on year, accounting for 90% of China's exports of electric light sources for general lighting. Total electric light source exports that year were 22.8 billion units, and 12.4 divided by 22.8 is 54.4%. 90% and 54.4% cannot both hold; either their denominators differ or one of them is wrong. In 2025, exports of LED electric light sources were 14.8 billion units, 58.3% of the 25.4 billion units of total electric light source exports, while the association's statement is "about 63%"; the ratio calculated on export value is higher than that calculated on export volume, consistent with the fact that LED unit prices are higher than those of incandescent lamps, so 63% is more likely a share of export value.
In two years of data from the same association, LED's share of electric light source exports moves from "90%" to "63%"; this change comes from a change of denominator and has nothing to do with the substitution rate. When citing, it must be stated whether the share is by export volume or by export value.
LED modules are the category with the most pronounced divergence between volume and price. In 2024 export volume was about 5.9 billion units, up about 488% year on year (association basis; the growth rate is abnormally high and may include tariff-line adjustments); in 2025 it was about 9.8 billion units, up 66%, with an average price of USD 0.058 per unit, down 28%. Back-calculating from the 2024 export volume, the 2025 average price and the decline, the 2024 average price was about USD 0.081 per unit and export value about USD 475 million; in 2025 it was about USD 568 million, up about 19.6%. These are estimates, with inputs taken from data published by the association.
Price declines are a phenomenon across the board. Average prices of the main categories in 2025: LED modules USD 0.058 per unit (-28%), LED bulbs USD 0.46 per unit (-16%), LED tubes USD 1.57 per unit (-12%), fixed luminaires USD 5.91 per unit (-17%), portable luminaires USD 10.57 per unit (-26%), photovoltaic lighting devices USD 2.95 per unit (-16%). None of the six categories rose. The overall average price of electric light sources can be obtained by dividing USD 5.5 billion by 25.4 billion units, giving USD 0.217 per unit, and for 2024 by dividing USD 6.3 billion by 22.8 billion units, giving USD 0.276 per unit, a decline of 21.6%, consistent with the range of declines for individual products.
Data by market are available for 2025 only.
| Market | 2025 export value | Year on year | Share |
|---|---|---|---|
| Asia | USD 17.5 billion | -12% | 35.1% |
| Europe | USD 13 billion | -3% | 26.1% |
| of which the European Union | USD 9.9 billion | -1% | 19.8% |
| North America | USD 10.8 billion | -22% | 21.6% |
| of which the United States | USD 9.7 billion | -23% | 19.4% |
| Latin America | USD 3.8 billion | -5.2% | 7.6% |
| Africa | USD 3.4 billion | +4.6% | 6.8% |
| Oceania and others | USD 1 billion | -19% | 2.0% |
| Total of the six regions | USD 49.5 billion | — | 99.2% |
The six items total USD 49.5 billion, 99.2% of the USD 49.9 billion, with the remaining USD 400 million not allocated by region; Asia, Europe and North America together account for 82.8%. The European Union's USD 9.9 billion is 76.2% of Europe's USD 13 billion.
The United States is the single market with the largest decline. In 2025 exports to the United States were USD 9.7 billion, down 23% year on year, 19.4% of all exports; the United States accounts for 89.8% of North America's USD 10.8 billion, and North America's overall -22% is almost identical to the United States' -23%, so the decline consists mainly of the United States.
Africa is the only growing market: in 2025 exports to Africa were USD 3.4 billion, up 4.6% year on year, 6.8% of all exports. Latin America fell 5.2%, Europe 3% and the European Union only 1%; the declines in these three markets are all smaller than in Asia (-12%) and North America (-22%). The geographic centre of gravity of exports shifted slightly towards Europe and Africa in 2025.
One further figure on a customs basis can serve as a cross-check. A secondary citation gives 2024 exports under HS 9405 (luminaires, lighting devices and parts thereof) as RMB 300.116 billion, the original tariff page not obtained (Tonghuashun, reproduced). At 7.1 to 7.2 this converts to USD 41.7 billion to USD 42.3 billion, broadly consistent with the association's luminaire export figure of USD 42.4 billion, within 2%. This check supports the association's luminaire export figure and shows that the two statistical systems can be aligned in total; it does not support directly equating USD 56.1 billion with RMB 300.116 billion, since the latter covers only HS 9405 and excludes electric light sources under HS 8539.
The 2025 export decline is the combined effect of three factors: prices falling across the board, with declines of 12% to 28% in six categories; a 22% decline in the North American market; and the high base of 2024. Among the categories already published, export volumes mostly grew — electric light sources +11%, LED modules +66%, LED electric light sources +37%; export volumes by luminaire category were not obtained. Reading the -11% of 2025 as the disappearance of demand would be a misjudgement: shipment volumes are growing, and what is falling is unit prices and North American orders.
Chapter 14: Domestic Sales and the Structural Difference of Project Channels
For 2024 domestic sales there are two sets of figures. The association's listed-company analysis gives RMB 189 billion, down 10.3% year on year; the Great Lighting Top 100 list, citing the association's estimate, gives RMB 180 billion, down 6.25% year on year (Great Lighting). The corresponding industry output value for the same year is RMB 589 billion (-4.9%) and RMB 580 billion (-4% or -3.33%). Exports correspond to USD 56.3 billion (-3.3%) and USD 56.1 billion (-0.3%).
The six figures form groups of their own; converting domestic sales and exports at the exchange rate and adding them allows a check of whether each group is internally consistent. At RMB 7.1 to 7.2 per US dollar, the results are as in the table below.
| Basis group | Industry output value (RMB 100 million) | Domestic sales (RMB 100 million) | Exports (USD 100 million) | Total (RMB 100 million, at 7.1) | Difference | Total (RMB 100 million, at 7.2) | Difference |
|---|---|---|---|---|---|---|---|
| Association listed-company analysis | 5,890 | 1,890 | 563 | 5,887 | -0.05% | 5,944 | +0.9% |
| Great Lighting, reproduced | 5,800 | 1,800 | 561 | 5,783 | -0.3% | 5,839 | +0.7% |
Both groups close within the exchange rate range of 7.1 to 7.2, with differences all within 1%. This shows that the difference between the two bases comes from statistical scope — for example, whether a certain category of product is included, whether certain business entities are included — and that none of the individual figures is miscalculated. Each basis is internally consistent, and choosing either does not affect the judgement that "exports account for about 70% and domestic sales about 30%"; it is mixing individual items from the two that produces contradictions.
The shares are calculated accordingly: in the RMB 580 billion group, domestic sales account for 31.0% and converted exports 68.7%, totalling 99.7%; in the RMB 589 billion group, 32.1% and 67.9%, totalling 100.0%. The structures of the two groups are almost identical.
One stable fact for 2024 is that domestic sales fell more than exports. Domestic sales were -6.25% or -10.3%, exports -0.3% or -3.3%; all four figures support this direction, with the smallest ratio about 1.9 times and the largest over 30 times. This is consistent in direction with the weakening of domestic demand from real estate and commercial lighting that year; the association notice gives no attribution.
The product structure of domestic sales is divided by application. In 2024 the semiconductor lighting application structure was: general lighting 44.1%, landscape lighting 16.6%, displays 15.6%, backlighting 8.2%, automotive lighting 1.5%, the five totalling 86.0%, with the remaining 14.0% other applications (Bosi Data). This set of data comes from a research institution's estimate rather than association statistics, and is used to read structural proportions, not absolute scale.
Automotive lighting contains an obvious conflict of bases. In 2025 the association's notice states that the automotive lighting market reached RMB 85.8 billion; by the 2024 application structure, automotive lighting accounts for 1.5% of downstream applications of RMB 514.2 billion, about RMB 7.7 billion. The two figures differ by 11.1 times. The former may include conventional lamp assemblies and original-equipment supply for complete vehicles, while the latter counts only the automotive portion of semiconductor lighting; the scopes differ, so they can neither be subtracted from each other nor used to refute each other. This article lists the two sets of figures side by side and does not merge them.
In 2025 the general lighting market fell 11% year on year, and smart lighting is expected to exceed RMB 50 billion. General lighting accounted for 44.1% of the application structure in 2024, corresponding to about RMB 226.8 billion. Smart lighting's RMB 50 billion and general lighting's RMB 226.8 billion are not on the same classification dimension and overlap, so it cannot be judged from them whether the increment can offset the decline.
Domestic sales channels fall into three types: specialised markets, project channels, and retail and e-commerce. Specialised markets are based mainly on spot goods, sample viewing and small-lot wholesale. Guzhen has 5 large specialised markets and decorative lighting transaction value of RMB 50 billion; Zouqu has more than 5,000 merchants, annual transaction value exceeding RMB 12 billion, and online sales exceeding RMB 5 billion in 2024. What these markets have in common is that the market and the place of origin are in the same town or adjacent, so buyers can view samples, compare prices and place orders within a day; competitiveness lies in a full range of categories and spot turnover, with transparent prices and small individual amounts.
Project channels face clients, design institutes and general contractors; procurement decisions rest on drawings, luminaire schedules and test reports, and the requirements for documents are higher than those for styles: China Compulsory Certification (CCC) certificates, energy efficiency label filing, LM-79 (electrical and photometric measurement of integrated luminaires) and LM-80 (lumen maintenance testing of light sources) reports, and harmonic current and disturbance voltage test data. The standards and access requirements discussed in Chapters 15 to 21 of Part Three mainly constrain this channel. Project orders are large in batch and long in cycle, and once a bid is won, the supplier's capacity is occupied by a single large customer.
Retail and e-commerce face individual products and best-sellers, with decisions based on price, style and reviews. In 2024 the non-conformity rate of national supervision sampling inspections of online-sold luminaires was significantly higher than offline: for fixed luminaires sold online, 80 batches were inspected and 42 failed, a non-conformity rate of 52.5% (State Administration for Market Regulation); for portable luminaires sold online, 74 batches were inspected and 22 failed, a non-conformity rate of 29.7%. Over the same period, offline fixed luminaires were inspected in 231 batches with a non-conformity rate of 19.9%, and offline portable luminaires in 123 batches with 13.8% (China Lighting Network). For the same category of product, the non-conformity rate online is more than double that offline.
The difference in payment terms across the three channels is directly reflected in profit: specialised markets are mostly cash on delivery, e-commerce has platform payment terms, and project channels pay by progress, with the balance settled after completion acceptance and warranty retention counted separately.
Industry efficiency data corroborate this. In 2024 total profit fell about 7% year on year, the operating revenue margin was about 5.1%, the number of loss-making enterprises grew about 13%, and the loss ratio was about 24% (China Lighting Network). In January to October 2025, operating revenue fell about 0.3%, total profit fell 16%, and the margin was about 4.3%; the relative decline from 5.1% to 4.3% is 15.7%, consistent with -16%, indicating that the profit decline comes almost entirely from the margin, with the revenue scale broadly flat.
Output and structure moved in different directions over the same period. In January to October 2025, output of luminaires and lighting devices rose 0.5% year on year, output of electric light sources fell 9%, export delivery value fell 4.1%, and the cumulative growth of industrial value added was about -0.5%, with the single month of October at about -5.7% (NetEase, reproduced). Luminaires edging up, light sources cutting output and profits falling sharply appear simultaneously, and the industry is in a phase of trading price for volume.
The pressure on domestic sales is therefore concentrated in two places: price and collection. Output has not contracted substantially, yet profit has fallen by 16%, and the profit per unit of product is narrowing; the long payment terms of project channels further amplify financing costs. Output edging up, unit prices falling and the profit margin dropping from 5.1% to 4.3% point in the same direction: the pressure on domestic sales lies at both ends, price and collection, and total demand has not yet contracted by a comparable margin.
Part Three: Standards, Energy Efficiency and Market Access
Chapter 15 The Incandescent Lamp Phase-Out Roadmap: The Five-Stage Timetable and Its Implementation
On 1 November 2011, the National Development and Reform Commission (NDRC), the Ministry of Commerce, the General Administration of Customs, the State Administration for Industry and Commerce and the General Administration of Quality Supervision, Inspection and Quarantine jointly issued Announcement No. 28 of 2011, promulgating the phase-out roadmap for general-purpose incandescent lamps. The announcement cites the Energy Conservation Law (《节约能源法》) and states the policy objective as "improving energy efficiency, protecting the environment and actively responding to global climate change". The text of the announcement is not long, yet over the following fifteen years it has continually reshaped the domestic sales structure of China's lighting products, and has indirectly shaped the production capacity pattern of finished LED luminaires and drivers seen today.
The announcement defines the products to be phased out more narrowly than is usually quoted. The products covered are "general-purpose incandescent lamps" designed for supply voltages of 200 to 250 volts, inclusive of both the 200 volt and 250 volt endpoints. Reflector incandescent lamps and special-purpose incandescent lamps are not covered; the latter category spans applications in scientific research and medical care, trains, ships and aircraft, motor vehicles, and household appliances. The way the voltage range is written means that the announcement governs conventional products connected to China's civil and industrial grids; low-voltage luminaires below that range, and products manufactured for markets with other voltage systems, fall outside the scope of the announcement by definition.
The timetable for the five stages is as follows.
The table is compiled from the original text of Announcement No. 28 of 2011.
| Stage | Timing | Measure |
|---|---|---|
| First stage | 1 November 2011 to 30 September 2012 | Transition period |
| Second stage | From 1 October 2012 | Import and sale prohibited for general-purpose incandescent lamps of 100 W and above |
| Third stage | From 1 October 2014 | Import and sale prohibited for general-purpose incandescent lamps of 60 W and above |
| Fourth stage | 1 October 2015 to 30 September 2016 | Mid-term review period |
| Fifth stage | From 1 October 2016 | Import and sale prohibited for general-purpose incandescent lamps of 15 W and above, or adjustment in the light of the mid-term review results |
The design of the timetable follows a clear sequence: high wattage first, low wattage later. Incandescent lamps above 100 W are bright, draw heavily and consume much electricity per unit per year, so replacement products have the shortest payback period and prohibition first carries the lowest social cost. Low-wattage incandescent lamps above 15 W have low unit prices and low annual consumption per unit, so replacement is least economical and they are placed last. A one-year mid-term review period is inserted as the fourth stage, and the fifth stage retains the wording "or adjustment in the light of the mid-term review results"; these two arrangements show that when the policy was formulated there was no full confidence in the readiness of substitute prices and the supply chain, and the final step was drafted as an adjustable provision.
Using wattage as the sole variable also reflects enforcement considerations. Wattage is printed on the lamp cap and on the packaging, so it can be read directly during enforcement without sending samples to a laboratory; consumers standing before a shelf can also judge from the wattage whether a lamp falls within the scope of the sales ban. Each stage adjusts only one power threshold, so manufacturers can withdraw models one by one rather than reconstructing an entire product line at once.
The verbs used in the announcement deserve separate comment: what is prohibited is "import and sale"; production is not prohibited. This legal construction means that domestic incandescent lamp capacity can continue to exist as long as products do not enter the domestic market. In 2025, in the export structure of China's electric light source products, incandescent lamps still accounted for about 29%, tungsten halogen lamps for about 4%, fluorescent lamps for about 1% and LED light sources for about 63% (reprint of China Association of Lighting Industry export data). In the same year, exports of electric light sources amounted to about 25.4 billion units (254 亿只), up 11% year on year, with an export value of about USD 5.5 billion (55 亿美元), down 12% year on year. Fourteen years after the sales-ban roadmap took effect, incandescent lamps remain a substantial category in China's lighting exports, a result determined directly by the jurisdictional boundary of the announcement.
The background figures at the time the policy was formulated come from the energy authorities of that period and from media relay: in 2010 China produced 3.85 billion incandescent lamps and sold 1.07 billion domestically; lighting accounted for about 12% of total electricity consumption; and the phase-out was expected to save 48 billion kWh (480 亿千瓦时) of electricity and reduce carbon dioxide emissions by 48 million tonnes (4800 万吨) a year (reprint on the National Energy Administration website). These figures do not appear in the text of the announcement and belong to the supporting publicity framing at the time of release. A 2012 article from another energy authority gave the figures as: total annual lighting electricity consumption of about 500 billion kWh, 13% of total electricity consumption and 6% of energy consumption (National Energy Administration).
Implementation has proved more complicated than the timetable. In October 2016, the month in which the fifth stage took effect, a media investigation found incandescent lamps still on sale on e-commerce platforms and in hardware and general merchandise stores, with shopkeepers mostly explaining them as inventory (The Paper). Production can stop after a given date; stock already in the distribution channel needs longer to clear, and the fragmentation of retail outlets determines enforcement costs. This item reflects a media investigation and cannot be used to estimate a national enforcement gap.
Reading the roadmap together with the output data requires distinguishing the effect of policy from the effect of substitute technology. In 2024 China's output of electric light sources fell by more than 16% year on year, and in January to October 2025 it fell a further 9%; over the same period output of luminaires and lighting devices grew by nearly 20% in 2024 (China Association of Lighting Industry, reprint of industry operating data). The structural shift — more luminaires, fewer light sources — is consistent in direction with the fall in replacement demand caused by longer service life of finished LED luminaires; the association's public statement offers no decomposition, and this article does not list service life as the primary cause. The phase-out roadmap cannot explain this change on its own; its role was to fix the direction of substitution as early as 2011, so that capacity investment would exit along a defined path.
Chapter 16 Safety Standards: The Impact of the GB 7000 Series Becoming Recommended Standards
The core of luminaire safety standards is the GB 7000 series, structured in two layers: GB 7000.1 sets out general requirements covering the safety principles common to all luminaires; GB 7000.2xx sets out type-specific requirements according to installation method and use scenario. GB 7000.1-2015 was published on 31 December 2015 and took effect on 1 January 2017, identically adopting IEC 60598-1:2014, and has long served as the technical basis for China Compulsory Certification (CCC) of luminaires (testing body's summary of the key points of the 2015 edition). One substantive addition in the 2015 edition is the classification of blue light hazard: products are divided into RG0, RG1 and RG2 under IEC/TR 62778, and stricter requirements apply to movable luminaires for children, which must not exceed RG1 at 200 mm.
The blue light hazard classification is easily understood as an inherent property of a product. In fact it is determined jointly by radiance and viewing distance, and the same lamp does not carry the same risk class when viewed directly at close range and when used for diffuse lighting at a distance. The standard sets an assessment distance of 200 mm for children's luminaires on the basis of the typical posture of a child using a desk lamp or night light. The practical meaning of this requirement is that movable luminaires for children must not enter RG2 even under the most unfavourable close-range conditions.
On 28 December 2023, GB/T 7000.1-2023 was published and took effect on 1 January 2026 (National Public Service Platform for Standards Information). This revision brings two structural changes. First, the nature of the standard changes from a mandatory national standard (GB) to a recommended national standard (GB/T). Second, the method of adopting the international standard changes from identical adoption to modified adoption (standard information service page). The type-specific standards were revised in step: GB/T 7000.201-2023 (fixed), GB/T 7000.202-2023 (recessed) and GB/T 7000.204-2023 (movable) all took effect on 1 January 2026 (testing body regulatory notice).
Another set of standards was replaced on the same day. GB 24906-2010, Safety requirements for self-ballasted LED lamps for general lighting services above 50 V, was published on 30 June 2010 and took effect on 1 February 2011, with a date of withdrawal of 1 January 2026; it is superseded by GB/T 24906-2023, published on 28 December 2023 by Announcement No. 20 of 2023 and effective on 1 January 2026 (standard details, standard text). The performance standard that accompanies the safety standard is GB/T 24908-2014, Performance requirements for non-directional self-ballasted LED lamps for general lighting (China Quality Certification Centre).
The phrase "mandatory standards becoming recommended standards" easily invites misreading; standards and market access need to be viewed separately. The compulsory constraint on luminaires entering the Chinese market comes from China Compulsory Certification; lighting electrical appliances are listed as the ninth major category in the certification catalogue, with luminaires under catalogue number 1001 and ballasts under 1002 (CNCA announcement on catalogue revision). The luminaire types covered by certification include fixed, movable, recessed, aquarium, night light, ground-recessed and children's movable luminaires; lighting equipment below 36 V is not included. Announcement No. 9 of 2024, issued on 7 April 2024, added explosion-proof luminaires and control gear (number 2318) to the catalogue (reprint by a local regulator). Standards supply the technical content; the certification system supplies the compulsory force of market access; the two divide the work over the same set of technical clauses.
The difference between modified adoption and identical adoption has direct operational implications for exporting firms. Identical adoption requires the national standard and the international standard to correspond one to one in technical content and clause structure, with no substantive national differences permitted; modified adoption permits technical adjustments while retaining the correspondence, and these adjustments usually take the form of national difference clauses. A product designed and tested to IEC 60598-1 therefore cannot be assumed to satisfy GB/T 7000.1-2023 at the same time; the difference clauses introduced by the modified adoption must be checked one by one. This judgement follows directly from the definitions of the two adoption methods; the specific difference clauses are to be determined by the text of the standard itself.
Beyond the standards system there is a separate compulsory line: engineering construction codes. GB 55016-2021, General code for built environment, is a mandatory engineering construction code; it stipulates a unified glare rating (UGR) of not more than 19 for long-term visual work areas, and for rooms in which people work or stay for long periods a colour rendering index Ra of not less than 80, a special colour rendering index R9 of not less than 0 and a colour tolerance of not more than 5 SDCM, with Ra of not less than 90 required in areas where colour discrimination is demanding (Ministry of Housing and Urban-Rural Development announcement). Product standards govern whether a lamp may be sold; engineering construction codes govern whether a space can be accepted, and both apply at the project handover stage.
In the same year, the safety standard became recommended while the harmonics standard remained mandatory (see Chapter 18). Taken together, the two show a division of labour within the standards system: technical requirements for product safety are left to the certification system for enforcement, while requirements for electrical performance and environmental compatibility retain the form of mandatory national standards. For finished-luminaire manufacturers, certificates and technical documentation become more important, and version management of standard texts becomes routine compliance work.
Chapter 17 Energy Efficiency Standards and Energy Efficiency Labels: Four Milestones
Energy efficiency management for LED lighting consists of two instruments. One is the energy efficiency standard, which sets the minimum allowable values and energy efficiency grades and constitutes the technical threshold for market access; the other is the energy efficiency label, which requires products to display an energy efficiency grade and to complete filing, and constitutes an information disclosure system. The former determines whether a product may be sold; the latter determines whether consumers can compare.
The energy efficiency standard currently in force for indoor LED products is GB 30255-2019, published on 4 April 2019 and effective on 1 November 2020, covering LED downlights (rated power not less than 2 W), directional integrated LED lamps and non-directional self-ballasted LED lamps (2 to 60 W) (National Public Service Platform for Standards Information). The standard sets three energy efficiency grades. For products with a colour rendering index Ra of not less than 90, the energy efficiency index may be reduced by 10 lm/W (China National Institute of Standardization).
The concession clause for Ra of not less than 90 deserves separate comment. Raising the colour rendering of a white LED usually requires increasing the proportion of red phosphor on the blue chip, which broadens the spectrum while lowering luminous efficacy. Writing the 10 lm/W difference into the limit amounts to acknowledging that high-CRI products may accept lower luminous efficacy at the same grade. This rule affects purchasing judgements: of two downlights both marked grade 2, the actual luminous efficacy of an Ra 80 unit and an Ra 90 unit may differ by more than 10 lm/W.
The 2 to 60 W range defines the coverage. Household bulbs, commercial downlights and integrated ceiling lights fall within the range; high-bay luminaires, road luminaires and floodlights above 60 W are governed by other standards. In the three-grade structure common to national energy efficiency standards, grade 3 is the minimum allowable value, and products below grade 3 may not be produced or sold; grades 2 and 1 correspond respectively to the energy-saving evaluation level and the top-runner level. The requirement "grade 2 or above" often found in procurement documents in effect raises the industry average one notch above the minimum.
A revised edition of GB 30255 has been published. GB 30255-2026 was published on 27 February 2026 and takes effect on 1 September 2027, with the status "pending implementation" (National Public Service Platform for Standards Information). Key points of the revision include the addition of downlights and spotlights with small beam angles, high-bay luminaires, replacement double-capped LED lamps and dimmable and tunable products, together with new standby power requirements (Economic Daily). The direction of expansion is clear: from replaceable light sources to integrated luminaires, from conventional light distributions to narrow beams and high bays, and from power when switched on to power when switched off. The standby power clause responds to the spread of smart lighting: luminaires with wireless modules must maintain standby consumption when switched off, and this consumption was previously outside the scope of assessment.
Outdoor lighting has a separate standard. GB 37478-2025 was published on 30 May 2025 and takes effect on 1 June 2026, applying to LED luminaires for road and tunnel lighting (National Public Service Platform for Standards Information). The standard sets three energy efficiency grades, with limits banded by correlated colour temperature: 140, 130 and 110 lm/W at a colour temperature not above 2500K; 165, 145 and 120 lm/W from 2500K to 3500K; 175, 155 and 130 lm/W from 3500K to 5000K; and above 5000K only the grade-3 level of 150 lm/W. The colour rendering index requirement is not less than 70 (standard text).
The colour temperature bands write the trade-off between colour temperature and luminous efficacy into the limits. Low-colour-temperature sources rely on a larger share of red phosphor and have lower luminous efficacy, so the standard sets a correspondingly lower threshold; high-colour-temperature sources have a clear efficacy advantage, and the threshold rises accordingly. The provision that only one grade exists above 5000K has the practical effect of excluding high-colour-temperature products from grades 1 and 2. The text of the standard does not explain the motive for this arrangement; what can be confirmed is that numerically it suppresses high-colour-temperature road lighting.
Panel lights have a separate standard. GB 38450-2019 was published on 31 December 2019 and took effect on 1 January 2021, applying to LED panel lights for general lighting (National Public Service Platform for Standards Information). Panel lights are a mainstream form in office and commercial spaces, with a large luminous surface and low glare; their energy efficiency is directly related to the transmittance of the light guide plate and the diffuser, which is why a separate standard was set rather than merging them into the downlight scope.
The rollout of energy efficiency labelling proceeded through four milestones, whose rhythm runs broadly in the same direction as the expansion of the energy efficiency standards.
The table is compiled from the implementation rules and catalogue milestones for energy efficiency labelling.
| Milestone | Date | Products covered |
|---|---|---|
| First milestone | 1 October 2016 | Non-directional self-ballasted LED lamps for general lighting |
| Second milestone | November 2020 | LED products for indoor lighting, including downlights, directional integrated and non-directional self-ballasted |
| Third milestone | 1 June 2024 | LED panel lights for general lighting |
| Fourth milestone | 1 June 2026 and 1 September 2027 | LED luminaires for road and tunnel lighting; new edition for LED products for indoor lighting |
The first milestone is the Implementation Rules for the Energy Efficiency Label of Non-directional Self-ballasted LED Lamps for General Lighting, effective on 1 October 2016 (regulatory text). The second milestone is the implementation rules for LED products for indoor lighting issued under NDRC Environmental Resources Regulation [2020] No. 640, covering the three categories of downlights, directional integrated and non-directional self-ballasted, effective from November 2020 (reprint by a local energy conservation authority). The third milestone is the Implementation Rules for the Energy Efficiency Label of LED Panel Lights for General Lighting, effective on 1 June 2024 with a validity of 5 years, with products already shipped before that date allowed until 1 June 2026 (National Development and Reform Commission). The fourth milestone comes from the 2026 edition of the catalogue: LED luminaires for road and tunnel lighting take effect on 1 June 2026, and the new edition of the rules for LED products for indoor lighting takes effect on 1 September 2027 (catalogue text).
The date of the fourth milestone coincides with the effective date of GB 30255-2026, so the two instruments are revised in step. The implication for firms is concrete: before 1 September 2027, new products must complete both the switch to conformity with the revised standard and the switch in label filing, and the window for clearing inventory of old models is tied to the effective date.
Energy efficiency labelling operates through a combination of self-declaration by the enterprise, filing and ex post supervision, with no prior certification step. The grade shown on the label is determined by the enterprise on the basis of test results and filed by the enterprise, and its truthfulness is backstopped by supervisory inspection. This arrangement means that technical responsibility for the data on the label rests with the enterprise. When verifying, purchasers should compare the label with the measured test report for the complete luminaire; discrepancies usually appear in production batches.
Chapter 18 Electromagnetic Compatibility and Harmonics
The electrical characteristics of LED luminaires differ from those of conventional light sources. An incandescent lamp is a purely resistive load, and its current waveform follows the voltage waveform; a fluorescent lamp with a magnetic ballast has a low power factor but limited waveform distortion; an LED requires the alternating current to be rectified to direct current and then driven at constant current, and the rectifier stage draws current concentrated near the voltage peaks, so the input current takes the form of narrow pulses with a high harmonic content. Harmonics here means components of the current waveform at frequencies that are integer multiples of the fundamental; the third harmonic is 150 Hz, the fifth is 250 Hz, and so on.
The third harmonic has a particular consequence in three-phase four-wire systems. The fundamental currents of the three phases cancel on the neutral conductor, but the third harmonic and its multiples add in phase, so the neutral current can reach several times the phase current. In commercial buildings, where lighting loads are concentrated and single-phase branches are numerous, overheating of neutral conductors is often attributable to this. Harmonic limits are set separately for lighting, and what they restrict is current quality on the grid side.
China's harmonics standard is GB 17625.1-2022, published on 29 December 2022 and effective on 1 July 2024, a modified adoption of IEC 61000-3-2:2020 (standard interpretation). The standard sets limits by equipment class, with lighting equipment assigned to Class C, covering LED luminaires, LED drivers, fluorescent lamp ballasts, discharge lamps and their control gear. The limits are banded by active power.
The table is compiled from the Class C limits in GB 17625.1-2022.
| Power range | Limit |
|---|---|
| Above 25 W | 3rd harmonic not more than 30×λ; 5th not more than 10%; 7th not more than 7%; 9th not more than 5%; 11th to 39th not more than 3% |
| 5 to 25 W | 3rd harmonic not more than 86%; 5th not more than 61% (alternative limits) |
| Below 5 W | Exemption newly added in the 2022 edition; harmonic limits do not apply |
Three points deserve elaboration.
First, the third harmonic limit in the above-25 W band is written as 30×λ, where λ is the power factor. The lower the power factor, the smaller the permitted third harmonic current. This formulation ties power factor and harmonics together: in the same driver, reducing the power factor from 0.9 to 0.6 reduces the permitted third harmonic from 27% to 18%. Cost saved in design returns in the form of a tighter limit on the harmonics item.
Second, the 5 to 25 W band uses alternative limits, permitting a third harmonic of up to 86% and a fifth of up to 61%, far more lenient than the above-25 W band. Low-power luminaires pass the harmonics item naturally with ease, while high-power ones do not. The consequences of this banding are directly visible in the national sampling data: fixed and recessed luminaires have relatively high power and multiple tubes per luminaire, and they account for the largest number of non-conforming batches on harmonics (see Chapter 20). The counter-evidence is equally clear: of the 17 non-conforming batches of movable luminaires in offline sampling in 2024, 16 were on harmonics. The per-luminaire power of movable products is generally lower than that of fixed products, so they have more opportunities to fall into the lenient band, yet passing is hardest for them; the result points to driver selection and batch consistency.
Third, the exemption for below 5 W is a clause newly added in the 2022 edition. Night lights, decorative lights and USB-powered luminaires fall in this range. The exemption means that they are not assessed against the harmonic limits; the products still generate harmonics, but supervision no longer uses this item as a criterion.
Harmonics are only one aspect of electromagnetic compatibility. Electromagnetic compatibility has two sides, emission and immunity: emission refers to the interference a device produces, divided into conducted emission and radiated emission; immunity refers to a device's ability to withstand external interference. The lighting-related items in national supervision sampling are harmonic current, disturbance voltage (at the mains port) and radiated disturbance. Harmonic current measures waveform distortion of the input current, disturbance voltage measures the high-frequency interference voltage a device injects into the grid, and radiated disturbance measures radiation into space. In the 2024 offline sampling, fixed general-purpose luminaires recorded 27 non-conforming batches on disturbance voltage and 16 on radiated disturbance (China Lighting Network reprint of the State Administration for Market Regulation notice).
The difficulty of meeting these items is not symmetric. Safety structure items (protection against electric shock, wiring, heat resistance) are determined by structural design and assembly process, and once the design is fixed, variation in volume production is limited. Electromagnetic compatibility items are determined by the topology of the driver, the specifications of filter components and the layout of the printed circuit board, and are highly sensitive to material substitution: change the core material of the common-mode choke by one grade, reduce the capacitance of the X capacitor by one grade, or alter the transformer winding by one layer, and the conducted emission margin may be consumed. Such components account for a small share of finished-luminaire cost but carry great weight in compliance outcomes, which makes them the weakest link under cost pressure. This judgement is inferred from the distribution of non-conforming items in sampling inspection; it is a mechanistic explanation and does not constitute an allegation against any particular firm.
Power factor requirements exist at two levels. At the product standard level, the GB 30255 series focuses on energy efficiency indices and does not list power factor as a separate mandatory clause; at the engineering level, tender documents often specify not less than 0.50 at 5 W and below and not less than 0.90 above 5 W (compilation of tender information), and industry commentary also states that the power factor of LED luminaires should not be lower than 0.9 (industry technical discussion). Engineering requirements are higher than product standards, and purchasers accepting against the product standard easily overlook this item. The coupling between power factor and harmonic limits means that meeting the engineering requirement of 0.9 also enlarges the harmonic margin, while meeting the minimum requirement of 0.5 makes harmonics harder to pass.
In terms of the nature of the standards, GB 17625.1-2022 carries a GB number and is a mandatory national standard, in contrast with GB/T 7000.1-2023, which became recommended in the same year (see Chapter 16). Technical requirements for product safety are left to the certification system, while requirements for electrical performance and environmental compatibility retain the mandatory form; this division of labour was essentially settled around 2026.
Chapter 19 Export Compliance: EU ErP and RoHS, US UL and Energy Star
The market structure of China's lighting exports is discussed in Chapter 13. The European Union and the United States together account for about 40% of exports (reprint of China Association of Lighting Industry data); the compliance structures of the two markets differ greatly and need to be examined separately.
The EU approach places regulation upstream. Before a product enters the EU market, it must first satisfy the ecodesign regulation, the energy labelling regulation and the restriction of hazardous substances directive, and complete registration in the EU product database for energy labelling (EPREL). The US approach places responsibility downstream: safety is handled through listing by third-party laboratories recognised under the framework of the Occupational Safety and Health Administration (OSHA), energy efficiency through minimum requirements set by the Department of Energy, electromagnetic interference by the Federal Communications Commission (FCC), and Energy Star is a voluntary certification. The two structures place different evidentiary demands on firms.
The core ecodesign regulation is (EU) 2019/2020, published on 1 October 2019 and applicable from 1 September 2021, covering light sources and separate control gear (original text of the regulation annex). The regulation is implemented in two stages. The first stage applies from 1 September 2021; the second from 1 September 2023, for T8 fluorescent tubes of 2 feet, 4 feet and 5 feet, raising the energy efficiency threshold from 89.7 lm/W to 120.0 lm/W.
The design intent of the second stage is clear. The T8 tube is a fluorescent lamp format with a large installed base in commercial and industrial lighting; raising the threshold to 120 lm/W is technically difficult for fluorescent tubes to reach, and the practical effect is to exclude this format from the market and clear space for replacement by LED tubes. Calculated from the two values given in the regulation, the increase in the threshold is (120.0−89.7)/89.7, about 34%, a gap that process improvements can hardly close.
The regulation sets a cap on power, written as a formula:
P_onmax = C × (L + Φ_use / (F × η)) × R
Where P_onmax is the maximum permitted input power; C is the correction factor for luminaire type; L is the end loss in watts; Φ_use is the useful luminous flux; F is the directional factor; η is the energy efficiency threshold in lumens per watt; and R is the colour rendering correction factor. The distinction between directional and non-directional sources appears in the value of F: non-directional light sources take 1.0 and are counted by total luminous flux; directional light sources take 0.85 and are counted by luminous flux within the cone (original text of the regulation annex).
The structure of the formula deserves unpacking. Permitted power consists of two parts: the fixed loss L, which is independent of luminous flux, and the power that should be consumed, obtained by dividing luminous flux by the energy efficiency threshold. Multiplying by the reciprocal of the directional factor amounts to a discount for directional products: the same flux within the cone is converted into effective output at only 85%, so the permitted power is correspondingly smaller. This formulation brings the destination of the light into the efficiency calculation, so the efficiency of reflectors and lenses is no longer a free item. Multiplication by the colour rendering correction factor R then adjusts the power cap to the level of colour rendering.
The regulation also sets standby power: the standby power of a light source shall not exceed 0.5 W, in the original wording, "The standby power P_sb of a light source shall not exceed 0,5 W." This limit is a substantive constraint on products with dimming, sensing or wireless modules, because standby power must cover the sustaining current of the control circuit.
Complementing the ecodesign regulation is the energy labelling regulation (EU) 2019/2015, with grades A to G, applicable from 1 September 2021, and stock of products bearing the old label may be sold until 1 March 2023. Suppliers must complete registration in the EPREL database from 1 May 2021 (testing body's regulatory interpretation). The registration date precedes the label application date by four months, which shows that registration is a precondition for using the label: without a database record, the grade on the label cannot be verified. The previous A+++ to E scale is thereby abolished, and the same lamp carries different grades under the old and new scales; packaging, instructions and e-commerce page markings must be replaced wholesale, and the 1 March 2023 inventory deadline is the cut-off for that replacement.
Restriction of hazardous substances is governed by the RoHS Directive 2011/65/EU and its 2015 amendment (EU) 2015/863, which currently restricts 10 substances: lead, mercury, hexavalent chromium, polybrominated biphenyls, polybrominated diphenyl ethers and four phthalates (DEHP, BBP, DBP, DIBP) are limited to 0.1%, and cadmium to 0.01%; lighting equipment falls under category 5 of the annex classification (original text of the directive annex). The directive provides conditional exemptions for mercury-containing light sources: compact fluorescent lamps and single-capped fluorescent lamps have mercury content caps set by power, for example 2.5 mg for general lighting compact fluorescent lamps below 30 W (compilation of exemption clauses).
The practical difficulty of RoHS for LED products lies in the supply chain. The LED light source itself contains no mercury; restricted substances are distributed in solder, flame retardants in plastic housings, plasticisers in wiring and components of the driver. Finished-luminaire manufacturers must rely on upstream material declarations and test reports to demonstrate conformity, and the deeper the supply chain tiers, the harder traceability becomes. The exemption clauses show that the EU takes a limited-quantity approach to mercury-containing light sources, which forms two compliance paths alongside the mercury-free character of LEDs.
The rules in the US market have four layers. At the safety level, fixed luminaires are subject to ANSI/UL 1598, LED luminaires must additionally satisfy UL 8750, self-ballasted lamps are subject to UL 1993 and portable luminaires to UL 153; products must be tested and listed by a third-party certification body recognised by the Occupational Safety and Health Administration (NRTLs, including UL, ETL, TÜV and CSA) (Energy Star Luminaires Specification V2.2 (terminated)). UL 1598 and UL 8750 apply simultaneously, so LED luminaires are subject to both; completing only the former is insufficient to cover the failure modes of the LED light source portion.
At the electromagnetic interference level, ordinary luminaires follow FCC Part 15B through a supplier's declaration of conformity; products with wireless functions such as Wi-Fi, Bluetooth and Zigbee must obtain an FCC ID under Part 15C (testing body's compliance note). A supplier's declaration of conformity is self-declared by the supplier with test records retained, whereas an FCC ID requires testing by a recognised body and registration with the Federal Communications Commission. Smart lighting crosses this line, and the compliance process and cost change accordingly.
At the energy efficiency level, the US Department of Energy sets minimum luminous efficacy requirements for general lighting, with the specific limits determined by the Department's regulations in force. Energy Star is a voluntary certification. Its Luminaires V2.2 specification was terminated on 31 December 2024 and its product listing was withdrawn on 1 January 2025; at present only recessed downlights continue to be certified under Downlights V1.0 (original specification). The historical requirements of V2.2 included a colour rendering index Ra of not less than 80 with R9 greater than 0, chromaticity within the seven-step quadrangle specified in ANSI C78.377, and a power factor of not less than 0.7 for solid-state luminaires above 5 W (not less than 0.5 at 5 W and below). That specification has been terminated, and the values above serve only as historical reference. Energy Star does not constitute a mandatory threshold for entering the US market; its historical role lay in access to government procurement, utility subsidy programmes and some retail channels.
Setting the three regimes side by side reveals different compliance logics. The EU writes performance thresholds into legal obligations, then uses labels and databases to fix information as verifiable records; the object of regulation is proof before placing on the market. The US leaves safety to third-party listing and enforcement of local electrical codes, and splits energy efficiency into mandatory and voluntary tiers; the object of regulation is responsibility after placing on the market. China combines prior China Compulsory Certification with ex post national supervision sampling (see Chapters 16 and 20). To place the same luminaire in all three markets, a firm must prepare three structurally different sets of evidence: technical documentation and registration records for the EU, listing and declarations of conformity for the US, and certificates and type test reports for China. What the three sets share is a dependence on batch consistency: a type test proves only that the submitted sample conforms, while market supervision sampling targets production batches (see Chapter 21). The focus of compliance work therefore falls on freezing the bill of materials, change management and factory testing — steps that do not appear on the certificate.
Chapter 20 National Supervision Sampling: Non-Conformity Rates and Principal Non-Conforming Items
National supervision sampling of product quality is organised annually by the State Administration for Market Regulation (SAMR) and notified in batches by product category. The basic unit of notification is the batch: one sampled specimen corresponds to one batch, and conformity is determined by batch. This basis determines how the ratios are read — the denominator is the number of batches sampled, and has no direct relationship with national output or the number of enterprises.
The general luminaire part of the 2024 offline sampling covered the fixed and movable categories. Sampling of 231 batches of fixed general-purpose luminaires found 46 non-conforming batches, a non-conformity rate of 19.9%; sampling of 123 batches of movable general-purpose luminaires found 17 non-conforming batches, a non-conformity rate of 13.8% (China Lighting Network reprint of the SAMR notice).
The table is compiled from SAMR 2024 offline sampling data.
| Product | Batches sampled | Non-conforming batches | Non-conformity rate |
|---|---|---|---|
| Fixed general-purpose luminaires | 231 | 46 | 19.9% |
| Movable general-purpose luminaires | 123 | 17 | 13.8% |
The distribution of non-conforming items differs greatly between the two product types. Among the 46 non-conforming batches of fixed luminaires, harmonic current accounted for 38 batches, disturbance voltage (mains port) 27, protection against electric shock 18, radiated disturbance 16, external wiring 8, construction 2 and colour rendering index 1; the notice also records 4 batches suspected of counterfeiting and 9 batches without a China Compulsory Certification certificate. Among the 17 non-conforming batches of movable luminaires, harmonic current accounted for 16 batches and protection against electric shock 2.
A single batch may have several non-conforming items at the same time, so the sum of batch counts across items exceeds the number of non-conforming batches. For fixed luminaires the seven items sum to 110 batches against 46 non-conforming batches, an average of 2.4 items per non-conforming sample; for movable luminaires the two items sum to 18 batches against 17 non-conforming batches, an average of 1.1. The former fails on several items at once, while the latter fails almost solely on harmonics. This difference points to two different failure modes: the problems of fixed luminaires lie in the overall margins of the finished-luminaire design, while those of movable luminaires are concentrated in the driver.
A national supervision sampling of online-sold product quality was also carried out for 2024; the notice is No. 16 of 2025, dated 12 March 2025 and published on 7 April 2025 (SAMR notice). The results for the three luminaire categories are as follows.
The table is compiled from SAMR 2024 online-sales sampling data.
| Product | Batches sampled | Non-conforming batches | Non-conformity rate |
|---|---|---|---|
| Fixed luminaires | 80 | 42 | 52.5% |
| Movable luminaires | 74 | 22 | 29.7% |
| Recessed luminaires | 66 | 30 | 45% |
The same notice records that of the 80 batches of online-sold fixed luminaires, 22 were suspected of lacking a China Compulsory Certification certificate. The 45% figure for online-sold recessed luminaires comes from an industry media reprint (China Lighting Network). Within the same category the gap between online and offline is large: fixed luminaires rise from 19.9% to 52.5%, and movable luminaires from 13.8% to 29.7%.
The notice for 2025 is No. 24 of 2026, dated 23 March 2026 and released on 7 April 2026 (reprint by the Hunan Provincial People's Government). The luminaire part covers two categories, recessed general-purpose luminaires and explosion-proof luminaires.
The table is compiled from SAMR 2025 sampling data.
| Product | Batches sampled | Non-conforming batches | Non-conformity rate |
|---|---|---|---|
| Recessed general-purpose luminaires | 197 | 84 | 42.6% |
| Explosion-proof luminaires | 67 | 55 | 82.1% |
The distribution of non-conforming items for recessed general-purpose luminaires is: external wiring 33 batches, protection against electric shock 22, construction 15, heat resistance 9, harmonic current 37, disturbance voltage 33, energy efficiency 16 and colour rendering index 11, the eight items summing to 176 batches, an average of 2.1 items per non-conforming sample. One industry media reprint gives 85 non-conforming batches; this article takes the 84 batches from the SAMR notice. The non-conforming items for explosion-proof luminaires are flameproof joints 48 batches, cable clamping 21 and impact resistance 19, with a further 12 batches recorded as suspected counterfeits.
Data from the certification side can be set against the sampling results. The 2025 certification validity sampling covered 39 product categories and 2483 batches and revoked 764 China Compulsory Certification certificates; in the lighting industry, 79 certificates held by 29 enterprises were revoked, of which 43 were for recessed luminaires, 25 for fixed luminaires and 11 for movable luminaires (CNR). The three categories sum to 79, consistent with the total in the notice. This set of data reflects a media relay.
Grouping the non-conforming items reveals four layers. Harmonic current, disturbance voltage and radiated disturbance belong to electromagnetic compatibility; protection against electric shock, external wiring, construction and heat resistance belong to safety structure; energy efficiency and colour rendering index belong to performance; flameproof joints, cable clamping and impact resistance belong to explosion-proof-specific structure. Electromagnetic compatibility items rank at the top in all three data sets — fixed, movable and recessed — and are the weakest link in production consistency. Safety structure items come next, and performance items are fewest.
The causes of this distribution can be understood from the testing method. Harmonic and disturbance test results are extremely sensitive to the filter network of the driver, and there is a gap between the tuning margin at the sample stage and material consistency at the production stage; safety structure items are determined by tooling and assembly process, involve high costs of change and are more stable. National sampling draws specimens from products on sale, reflecting the production state, which differs systematically from the state of samples submitted for certification. The industry saying that samples pass and production drifts refers to this difference, whose technical basis is most direct in the electromagnetic compatibility items.
Sampling results are published to society and constitute a public basis for purchasers and tenderers to evaluate suppliers. Follow-up handling of non-conforming products is carried out by the supervisory authorities in accordance with the law.
Chapter 21 Product Quality Stratification as Shown by the Sampling Data
The most common misuse of national sampling data is to read it as an industry-wide non-conformity rate. The sampling frame for supervision sampling is explicitly targeted: products that are regulatory priorities, have past non-conformity records, attract clustered complaints or carry abnormal prices are more likely to be selected, and the places of origin of samples are also concentrated in industrial clusters and wholesale distribution links. The denominator is batches, unrelated to output or the number of enterprises. These ratios can only be used to describe stratification, not to infer the overall quality level of lighting products nationwide.
The first layer is channel stratification. In the same set of 2024 notices, fixed luminaires had an offline non-conformity rate of 19.9% and an online rate of 52.5%, making the online rate 2.6 times the offline rate; movable luminaires had 13.8% offline and 29.7% online, making the online rate 2.2 times the offline rate. The two categories point in the same direction and the multiples are close. The calculation is a direct division of the two rates: 52.5 divided by 19.9 gives 2.64, and 29.7 divided by 13.8 gives 2.15.
The source of the channel difference can be sought in the traceability of the responsible entity. Offline sampling draws mostly from physical links of production and distribution, where samples can be traced to the manufacturing enterprise and responsibility has a clear locus; online sampling targets goods on sale on a page, where the seller may be a trader, a private-label operator or a brand owner without its own factory, and the actual producer of the sample requires separate verification. Of the 80 batches of online-sold fixed luminaires, 22 were suspected of lacking a China Compulsory Certification certificate, or 27.5%; of the 231 batches of offline fixed luminaires, 9 lacked certification and 4 were suspected counterfeits, a non-certification rate of 3.9%. The two proportions differ by about 7 times. The difference in compliance costs between channels shows more directly in certification status than in non-conformity rates.
The second layer is category stratification. Comparing within the same channel controls the channel variable to some extent. The 2024 online non-conformity rates for the three categories were 52.5% for fixed, 45% for recessed and 29.7% for movable, with fixed highest and movable lowest. The order for the two offline categories is the same: fixed at 19.9% is above movable at 13.8%. The two channels yield a category ranking in the same direction, which indicates that the ranking is not an incidental result of channel.
The category differences have structural explanations. Fixed and recessed products are mostly project batch products, with high replacement costs after installation, higher per-luminaire power, more terminals, and complex housing and earthing structures, so the probability of failure on harmonics and wiring rises accordingly; movable products are consumer products with simple structures and low per-luminaire power, and a high proportion fall in the 5 to 25 W alternative harmonic limit band, where the limits themselves are more lenient. Recessed products carry an additional constraint: the luminaire is set into a suspended ceiling, where heat dissipation conditions are poor, so heat resistance and external wiring requirements are higher than for surface-mounted luminaires, while the installation contractor's allowance for heat dissipation space is not controlled by the luminaire manufacturer.
The third layer is certification-status stratification. Among the 79 lighting certificates revoked in the 2025 certification validity sampling, 43 were for recessed luminaires, 25 for fixed and 11 for movable (CNR). The three categories sum to the total. The category ranking by certificate revocation runs in the same direction as the category ranking by non-conformity rate, with recessed first. The two data sets come from different years and different sampling methods; their consistent ordering is a mutually corroborating clue, and cannot be used to calculate a true non-conformity rate for any category.
Explosion-proof luminaires require separate discussion. The 2025 sampling covered 67 batches, of which 55 were non-conforming, a rate of 82.1%, the highest of the four data sets. Explosion-proof luminaires were only brought into the China Compulsory Certification catalogue by Announcement No. 9 of 2024 in April 2024, under number 2318 (see Chapter 16). Their inclusion in certification and their high non-conformity rate occurred in the same period, and both phenomena point to incomplete certification coverage of the installed base; the former cannot be described as the cause of the latter. Of the 55 non-conforming batches, 12 were suspected counterfeits, indicating irregular sources in the distribution link; 48 non-conforming batches on flameproof joints point to housing machining accuracy, a basic process.
The sampling data have a further boundary of scope: they cover only the test items specified in standards. Flicker is evaluated against NEMA 77 and IEEE 1789, both industry-organisation documents, which are not included in the test items of national supervision sampling; lumen depreciation and life require more than 6000 hours of LM-80 data, which cannot be completed within a sampling cycle; long-term drift of colour tolerance, the life of electrolytic capacitors in drivers and the thermal cycling reliability of solder joints are likewise outside the scope of sampling. These are precisely the items on which disputes concentrate after project delivery. Passing sampling inspection only shows that the sample meets the test items; it does not show how the product will perform over a three-year service period.
When using this data for supplier screening, the reasonable use is to treat it as a stratification map: which category of product is more likely to fail, in which channel, and in what manner. Fixed and recessed products have the highest probability of failure on electromagnetic compatibility, the certification status of the online channel is the least reliable, and explosion-proof products show the largest gap in basic processes. Treating relative relationships on the map as absolute levels will produce conclusions inconsistent with the facts.
Part Four: Cost, Equipment and Quality
Chapter 22 Cost Structure: Chips, Drivers, Heat Dissipation, Structural Components and Labour
The cost structure of a luminaire varies with power, batch size, colour rendering grade and certification requirements; no universal set of percentages exists. For the same LED bulb, the bill of materials of a 3 W unit differs substantially from that of a 12 W unit; at the same power, the driver design for export to the European Union also differs from that for the domestic market. The first step in understanding cost structure is to accept that it is a set of numbers that changes with conditions.
One widely circulated set of figures comes from the teardown of a single LED bulb: light source 37.7 per cent, driver 21.7 per cent, structural components 18.5 per cent. The three items total 77.9 per cent; the remaining 22.1 per cent is not broken down in the original, and labour, packaging, manufacturing overhead, testing and losses may all lie within it. The post was published on an electronics engineer forum; the author took apart one sample and provided a bill of materials and photographs, but no batch data or unit-price detail (Power Supply Network forum teardown post, 2022). This set of proportions can only be regarded as one teardown sample; it cannot be extrapolated to an industry average, nor used to estimate products of other power ratings or other colour rendering grades.
Another type of presentation gives ranges: LED packages 20–40 per cent, driver 15–25 per cent, heat dissipation 10–20 per cent, housing 10–15 per cent, optics 5–15 per cent, assembly 5–10 per cent (technical article by a lighting company, 2025, not an association statistic). Summing the midpoint of each range gives approximately 95 per cent; the remainder is not explained. The width of the ranges itself indicates one thing: different sources do not define "structural components" in the same way — some merge the heat sink into structural components, some list it separately, and some count optical parts as part of structural components. The two bases cannot be compared line by line.
| Item | Teardown sample | Range basis, lower limit | Range basis, upper limit |
|---|---|---|---|
| Light source (LED packages) | 37.7% | 20% | 40% |
| Driver | 21.7% | 15% | 25% |
| Heat dissipation | Not listed separately | 10% | 20% |
| Structural components / housing | 18.5% | 10% | 15% |
| Optics | Not listed separately | 5% | 15% |
| Assembly / labour | Not listed separately | 5% | 10% |
Table compiled from public sources. The left column is a teardown sample of a single product; the two right-hand columns are on a range basis. The two are defined differently and cannot be compared line by line.
The reason cost structure changes with power lies in four mechanisms.
Part of the driver cost is fixed: bridge rectifier, input capacitor, control chip, transformer or inductor, housing and potting. A 3 W driver and a 12 W driver differ little in component count, so the driver accounts for a markedly higher share of low-power products than of high-power ones. The lower the power, the harder it is to spread this block of cost.
The amount of heat dissipation and structural material used is determined by heat output. Heat output is approximately input power multiplied by (1 minus the light conversion ratio); the higher the luminous efficacy, the lower the proportion that becomes heat at the same power, and the thinner and smaller the heat sink can be made. Higher efficacy lowers two cost items at once: fewer chips are needed to reach the same lumen output, and less waste heat is produced. This has been the main source of the decline in complete-luminaire cost over the past decade, and its magnitude exceeds any saving that procurement negotiation can deliver.
Structural components are closely tied to appearance parts. The cost of the housing is determined by shape, surface treatment and tooling amortisation, and is only weakly related to photometric and electrical parameters. Tooling cost is amortised over batch size; the per-unit cost of small-batch customisation can be far higher than that of volume products, and this portion is usually charged as tooling fee and minimum order quantity, which is not visible in a quotation breakdown.
Labour is related to the number of assembly operations. The annual report of a Shenzhen-listed company whose main business is general lighting shows, on its stated basis, raw materials at about 46.3 per cent of operating cost, labour at about 6.7 per cent, and depreciation and other items at about 6.3 per cent, the three totalling 59.3 per cent, with the remainder not broken down (the company's annual report, 2025). This is a company-level cost composition covering all product lines; it is not data at the same level as the material teardown of a single lamp, and the two cannot be compared directly. It indicates a direction: in the operating cost of industrial enterprises above designated size, labour accounts for a single-digit share, and compressing labour has limited effect on total cost.
There is another category of cost that is not in the bill of materials but is spread into the unit price by model: certification and testing. CCC certification for the domestic market, ErP and EPREL registration for export to the European Union, and UL or ETL listing for export to North America are all fixed charges levied per model. Changing the colour temperature or the power of the same mechanical design often requires re-certification. The more models a factory makes, the lower the certification cost carried by each model; for a factory making only a few models, this item may account for a higher share of total cost than labour. Tooling cost works the same way: it is amortised over batch size, so the smaller the minimum order quantity, the higher the per-unit share. The unit price seen on a quotation already has both items spread into it; therefore, with an identical bill of materials, companies of different scale can quote prices that differ by a noticeable margin.
Pressure on the price side is the other half of understanding cost structure. In 2025 the average export price was USD 0.058 per LED module (down 28 per cent year on year), USD 0.46 per LED bulb (down 16 per cent) and USD 1.57 per LED tube (down 12 per cent) (association figures, cited second-hand, 2026-01-21). When average prices fall continuously, the room available to suppliers to compress costs unfolds in sequence: first structural components (thinner walls, material substitution, fewer surface-treatment steps), then the driver (simplified topology, reduced component derating margins), then the LED packages (lower bins, smaller chip area), and finally outsourcing and process consolidation. Of the first three, compression of structural components mainly affects appearance and mechanical strength, while compression of the driver and the LED packages directly changes electrical safety and lumen depreciation behaviour.
A common estimation method for buyers is to price each material item separately: the number of LED packages multiplied by unit price, plus the driver unit price, plus the weight of structural components multiplied by material unit price, plus processing and manufacturing overhead. When a quotation is significantly below this estimate, the difference usually appears in one of three places: the actual bin of the LED packages does not match the nominal one, the driver omits electromagnetic-compatibility-related components, or the wall thickness and material grade of structural components are downgraded. These three places are consistent in direction with the non-conforming items in supervision sampling inspection listed in Chapter 20.
At the same power and the same certification requirements, differences in quotations arise mainly from three items: the bin of the LED packages, the component count of the driver, and the material of structural components.
Chapter 23 Packaging Equipment: Die Bonding, Wire Bonding, Dispensing, Binning and Colour Sorting
Packaging turns a bare chip into a surface-mountable LED package. Processes and equipment correspond one to one; the equipment list is essentially the process list.
The main flow is: wafer expansion, die bonding, wire bonding, dispensing/encapsulation, baking and curing, singulation, flux and colour binning, and tape-and-reel packaging (LEDinside process description; the page dates from 2008, and the process names are still in use). The function of each process is as follows.
Wafer expansion uses a wafer expander to stretch the entire wafer film uniformly, increasing the spacing between chips so that the die bonder can pick them up one by one. The uniformity of expansion determines the stability of subsequent pick-up.
Die bonding uses silver adhesive or insulating adhesive to attach the chip to the lead frame or substrate. The amount of adhesive, its placement and the void rate after curing determine the thermal resistance between chip and substrate. If thermal resistance is too high, junction temperature rises, luminous efficacy falls and lumen depreciation accelerates. The quality of this process does not show up immediately in factory testing; it manifests only after a period of use at the customer's end.
Wire bonding uses gold or copper wire, joined by thermosonic bonding, to connect the chip electrodes to the lead-frame pads. The sphericity of the bond ball, the loop height and the pull strength are reliability indicators. Copper wire is lower in cost and better in thermal conductivity, and is harder than gold wire, so it places stricter demands on the pads and the process window.
Dispensing applies epoxy resin or silicone onto the chip; in white-light LED packages, phosphor is mixed into the encapsulant. The encapsulant must be degassed before dispensing, since bubbles form voids after curing, affecting both light extraction efficiency and long-term reliability. The dispensed volume directly determines colour temperature: more encapsulant means a thicker phosphor layer and a lower colour temperature; less means a shift towards blue.
Baking and curing cross-links the encapsulant. The temperature profile and time are determined by the grade of encapsulant; insufficient curing leaves the encapsulant soft, and it is scratched in subsequent processes.
Singulation separates the cured lead-frame strip or substrate into individual LED packages.
Flux and colour binning grades LED packages along three dimensions — wavelength, brightness and forward voltage — and each grade is a bin. This step determines the level of package consistency and also the proportion of a production lot that can fall into the higher-grade bins.
Tape and reel loads the sorted packages into carrier tape for use by placement machines at finished-luminaire plants.
A securities firm's estimate of the share of packaging-equipment value is: die bonder 28 per cent, wire bonder 28 per cent, binning machine 20 per cent, tape-and-reel machine 12 per cent, dispensing machine 6 per cent and baking equipment 4 per cent (Tianfeng Securities basis, 2025). The six items total 98 per cent; the remaining 2 per cent is not listed and may include wafer expansion, cleaning and inspection equipment. This set of proportions is a securities-firm estimate, not an official statistic, and not any single company's equipment register; it can be used to judge the direction of the investment structure, but not to verify prices.
| Equipment | Share of value |
|---|---|
| Die bonder | 28% |
| Wire bonder | 28% |
| Binning machine | 20% |
| Tape-and-reel machine | 12% |
| Dispensing machine | 6% |
| Baking equipment | 4% |
| Total, six items | 98% |
Table compiled on the securities firm's estimated basis; not an official statistic.
Die bonding and wire bonding together account for 56 per cent, more than half of equipment investment. The reason is that both machines demand precision and speed at once: chip dimensions are below a millimetre, placement deviation is measured in micrometres, and throughput is measured in units per hour. The combination of precision, speed and yield directly determines equipment price. These two processes are also the main source of packaging yield loss; die-bond misalignment and weak wire bonds are the two most common defect types in packaging plants.
The binning machine accounts for 20 per cent, commensurate with its position in quality. The finer the binning, the longer the test time, the greater the investment in equipment and labour, and the lower the proportion of output falling into each bin. Consistency is bought with binning cost; the money is spent at the packaging plant and ultimately shows up in the incoming-material consistency of the finished-luminaire plant (see Chapter 26).
The dispensing machine accounts for only 6 per cent, yet its significance for white-light LED packages exceeds that proportion. The phosphor-to-encapsulant ratio and the dispensed volume determine colour temperature and luminous efficacy, and within-batch variation in dispensed volume translates directly into within-batch drift of chromaticity coordinates. The equipment is not expensive, but process control is not easy.
Equipment value share and equipment unit-count share are not the same thing. The equipment configuration of a packaging line is balanced by cycle time: the cycle times of die bonding and wire bonding determine line output, while binning and taping usually require several machines in parallel to keep up. Inferring the capacity bottleneck from value share therefore leads to error; determining the bottleneck requires looking at the output per machine and the changeover time of each process.
The availability of equipment investment is one of the technical reasons why concentration in the packaging segment is moderate. The global top five in LED packaging together hold about 41 per cent (GEP Research basis, 2024), below the level of more than 80 per cent held by the top six upstream chip makers. Packaging equipment can be purchased on the market, processes can be replicated, and capacity can be built within a relatively short cycle; upstream epitaxial equipment has a high unit price and a long commissioning cycle, raising the capital threshold. In 2025, capacity utilisation in the packaging segment exceeded 85 per cent, and more than six in ten companies reported revenue growth (China Association of Lighting Industry basis, 2026-02-13). When utilisation is high, depreciation is spread over more output, unit cost falls and there is room for quotations to move down; when utilisation is low, the same depreciation is spread over less output, and the room for a price war is in fact smaller.
Epitaxial equipment is not on the packaging list. A local-government source states that MOCVD equipment in Nanchang High-tech Zone accounts for more than 80 per cent of the global market (CNR International Online report, 2024-07); this claim has not been corroborated by equipment makers' annual reports or third-party statistics and can only be cited as a local-government source. MOCVD is the core equipment for growing epitaxial wafers, with a unit price usually higher than packaging equipment, which is why capital intensity upstream is higher than in the midstream.
The capacity of a packaging line is determined by the cycle times of die bonding and wire bonding, and consistency is determined by the binning precision of flux and colour sorting; together the two constitute the real barrier in the packaging segment.
Chapter 24 Finished-Luminaire Production Lines: SMT, Ageing and Testing
The finished-luminaire plant assembles LED packages, drivers, structural components and optical parts into luminaires. The production line has three sections: board-level assembly, finished-luminaire assembly, and ageing and testing. The capabilities of the three differ greatly, and the distribution of quality problems differs accordingly.
The board-level assembly flow is: solder paste printing, placement, reflow soldering, automated optical inspection (AOI), testing and depanelisation (EEPW process description, 2008). The printed circuit board assembly of the driver is also completed on this line, while through-hole components such as transformers, electrolytic capacitors and terminal blocks go through wave soldering or manual soldering.
LED packages are sensitive to the reflow temperature profile. The encapsulant and internal solder joints undergo a complete thermal cycle during reflow; a profile outside the package specification causes premature lumen depreciation or outright failure. The process window at the finished-luminaire plant is therefore narrower than in ordinary electronics assembly, and the oven temperature profile must be set according to the LED package datasheet rather than carried over from other products. This is the most easily overlooked coupling between incoming materials and process.
The life-limiting weakness of the driver is the electrolytic capacitor. Capacitor life falls rapidly as temperature rises, and when the driver board is mounted inside the luminaire cavity, close to the light source, the ambient temperature is far higher than indoors. The temperature rating and brand selected matter more to the long-term repair rate than the circuit topology. This item usually occupies a single line on a quotation, yet often accounts for a large share of repair statistics.
The assembly section covers the bonding of the LED board to the heat sink, the fitting of optical parts, sealing and wiring. Thermal interface material is applied to the mating surface; coating thickness and bubble rate affect thermal resistance. For outdoor luminaires, the compression of the gasket and the assembly torque determine whether the ingress protection rating reaches its nominal value. This section has a low level of automation and a high labour share, and process quality depends on work instructions and training.
Line output is determined by the bottleneck process and has little to do with the total number of machines. The assembly section has the most workstations, and its cycle time is usually limited by wiring or sealing; the capacity of the ageing room is measured in hours, and plants under capacity pressure run ageing in two shifts. In high-mix, low-volume production, changeover time becomes another constraint: changing the LED board, adjusting fixtures and resetting the oven profile each entail a period of zero output. The smaller the order batch, the higher the share of changeover loss carried per unit, which is another reason why small-batch customisation is quoted above volume products.
Ageing means lighting the complete luminaire for a period to screen out early failures. Industry practice varies: some plants age every unit, others sample. The scope of ageing is limited: it can screen out the early failures of the declining section of the bathtub curve, but it has no screening capability for mid-life lumen depreciation or colour shift. The ageing room occupies floor space and electrical capacity, is often a capacity bottleneck in small plants, and is a common cause of delivery delays.
In testing, three classes of capability must be distinguished; this distinction matters more than any single indicator.
The first class can be done unit by unit: appearance, marking, power and power factor (with a power meter), dielectric strength (withstand voltage), insulation resistance, earth continuity, and lighting and dimming functions. These measurements are fast and the equipment is inexpensive, so full inspection is feasible.
The second class can only be sampled: luminous flux, colour temperature and chromaticity coordinates, and colour rendering index. Measurement requires an integrating sphere or a spectrometer, takes minutes per unit, and full inspection on the line is not realistic.
The third class can only be tested as a type test in a laboratory; the line cannot perform full inspection: harmonic current, disturbance voltage and radiated disturbance, structural checks of protection against electric shock, and resistance to heat and fire. Harmonic current is judged under Class C of GB 17625.1-2022: above 25 W the 3rd to 39th harmonics are examined, and from 5 W to 25 W the 3rd and 5th (standard interpretation, 2022 edition). Disturbance voltage and radiated disturbance require an electromagnetic compatibility laboratory. These two items cannot be measured at the end of any finished-luminaire production line.
The data from supervision sampling inspection fall precisely on this boundary. In 2024, offline sampling of 231 batches of fixed general-purpose luminaires found 46 non-conforming batches, a non-conformity rate of 19.9 per cent; among the non-conforming item counts, harmonic current accounted for 38, disturbance voltage 27, protection against electric shock 18, external wiring 8 and radiated disturbance 16 (State Administration for Market Regulation notice, cited second-hand, 2025-06-03). The two items of harmonic and disturbance voltage total 65 item counts, exceeding the 46 non-conforming batches, because a single batch may fail several items at once. In 2025, sampling of 197 batches of recessed general-purpose luminaires found 84 non-conforming batches, a non-conformity rate of 42.6 per cent; of these, harmonics accounted for 37 item counts, disturbance voltage 33, external wiring 33, protection against electric shock 22, energy efficiency 16 and colour rendering index 11 (SAMR notice, 2026-04-07). Harmonic and disturbance voltage together total 70 item counts, about 83 per cent of the number of non-conforming batches.
The meaning of this distribution is clear: non-conformities concentrate in the items that the line cannot fully inspect. Harmonic and disturbance voltage are determined by circuit design and component selection, protection against electric shock by structural design, and external wiring by assembly process. They are fixed at design freeze and at incoming-material receipt, and end-of-line inspection cannot intercept them. Attributing quality problems to "workers not doing the job properly" does not stand up statistically.
The boundary of inspection capability on the finished-luminaire line determines where quality problems occur: items that can be fully inspected are intercepted on site, while items that cannot be fully inspected can only be resolved at the design and incoming-material stages.
Chapter 25 Lumen Depreciation and Life: The Practical Use of LM-80 and TM-21
The "life 25,000 hours" or "50,000 hours" on luminaire packaging usually comes from a combination of two documents: measured data from LM-80 and extrapolation by TM-21. What these two documents can and cannot demonstrate is the step most often skipped in procurement.
LM-80 is a measurement method approved by the Illuminating Engineering Society (IES); its full title is the method for measuring lumen maintenance of LED packages, arrays and modules. It measures the change in luminous flux over operating time and does not itself determine life (US Department of Energy LM-80 description, 2020-03). There are three key points.
Temperature points: at least three case temperatures — 55 °C, 85 °C and a third temperature chosen by the manufacturer — with case temperature controlled to plus or minus 2 °C.
Duration: a minimum of 6,000 hours, with 10,000 hours recommended.
Sampling: measurements taken every 1,000 hours, with the report giving lumen maintenance at each time point for each temperature point.
Case temperature (Tc) is the temperature at the base of the LED package, not the ambient temperature and not the air temperature inside the luminaire. In the same lamp, a case temperature of 60 °C is possible at an ambient of 25 °C; for a luminaire installed in a workshop that is hot in summer, case temperature may exceed 90 °C. The first thing to do when reading an LM-80 report is to find the correspondence between the case temperatures in the report and the measured case temperature of the complete luminaire. When the case temperature of the complete luminaire is above the highest test temperature in the report, the report data cannot be applied directly.
TM-21 uses LM-80 data to extrapolate luminous output beyond the tested duration (TM-21 description, 2011). Its rules include two hard limits.
The extrapolated duration may not exceed 6 times the measured duration.
Each temperature-current combination requires 25 samples.
Extrapolated results are usually expressed as L70, L80 or L90. L70 is the number of hours for lumen maintenance to reach 70 per cent of the initial value (US Department of Energy definition, 2012).
The 6-times rule can be applied directly to check quotation documents. 6,000 hours of measurement multiplied by 6 equals 36,000 hours, so an LM-80 report with only 6,000 hours of data supports an extrapolated conclusion of at most 36,000 hours. If a supplier claims an L70 of 50,000 hours on the basis of the same report, that figure exceeds the upper limit the method allows. To support 50,000 hours, the measured duration must be at least 8,334 hours (50,000 divided by 6, rounded up). 10,000 hours of measurement multiplied by 6 equals 60,000 hours; this is the data basis for the "50,000 hours" claims common today.
Checking an LM-80 report can proceed through four questions: does the report give three case temperatures and complete data for each temperature point; does the measured duration reach 6,000 hours, and is the sampling interval one thousand hours; does the sample count reach 25 for each temperature and current combination; and does the laboratory issuing the report hold the corresponding accreditation. If any one of the four is missing, the report can serve only as a reference, not as a basis for a life claim.
TM-21 does not equal complete-luminaire life. This point needs to be written clearly at the contract level. LM-80 measures LED devices (packages, arrays, modules), and TM-21 extrapolates the lumen maintenance of those devices. The complete luminaire also contains a driver, optical parts, thermal interfaces, solder joints and seals; if any one of these fails first, the luminaire fails, and that has nothing to do with L70. The US Department of Energy states this explicitly in its solid-state lighting research and development assessment: extrapolation covers only the LED light-source component, and the driver, optics, heat dissipation and solder joints may fail earlier (DOE assessment document, 2020-01).
The engineering failure sequence is roughly as follows.
The driver failing first is the most common case. Electrolytic capacitor life falls rapidly as temperature rises, and temperatures inside a luminaire cavity are higher. Both types of repair — "still lit but flickering" and "completely dead" — mostly originate in the driver.
Solder joint failure comes next. A cold solder joint from reflow or wave soldering cracks under thermal cycling, presenting as intermittent flicker or lights that come on and off.
Optical-part failure appears as falling luminous flux while the LED packages are normal. Plastic lenses and diffusers yellow under heat and short-wavelength light, transmission falls, and the complete luminaire measures low luminous flux while the LED packages test as conforming when removed.
Seal failure concentrates in outdoor luminaires. Ageing gaskets admit water, short-circuiting the driver or the LED packages; this results from the combined action of the installation environment and the structural design.
The correct reading is to use each document for its own purpose: LM-80 and TM-21 serve to compare the quality of the packages supplied by LED-package suppliers, while complete-luminaire life is verified with complete-luminaire failure data — that is, repair rate and field failure rate. The two cannot substitute for each other; a favourable LM-80 report does not prove that the luminaire is reliable, and an unfavourable repair statistic cannot be attributed to the LED packages alone.
A further distinction is needed between two reports that are often conflated. Initial luminous flux and luminous efficacy are read from LM-79, whose measurement object is the complete luminaire or the luminaire; the method uses an integrating sphere or a goniophotometer, with the sphere diameter chosen according to luminaire size — not less than 1 m for compact lamps, not less than 1.5 m for larger luminaires, and not less than 2 m above 500 W — and the luminaire must be lit to thermal stability before measurement, which for large luminaires usually takes 30 minutes to 2 hours (LM-79 method, 2015). Maintenance is read from LM-80, whose measurement object is the LED package. When both standard numbers appear in one test report, the measurement object and test conditions must be checked separately; the initial efficacy of the complete luminaire and the lumen maintenance of the LED package cannot be pieced together into a single "life" conclusion.
Some local project documents use another formulation: lumen maintenance of not less than 96 per cent at 3,000 hours and not less than 92 per cent at 6,000 hours (a project document, 2026-03-19). Such indicators belong to the basis used in tender documents, not to national standards; their nature is a check at specified points rather than the continuous measurement of LM-80. Acceptance should specify the test method, sample size and decision rules; otherwise supplier and owner will not understand the same percentage in the same way.
LM-80 and TM-21 can show the lumen maintenance trend of LED packages at a given case temperature, but cannot show how long the complete luminaire will last; complete-luminaire life can only be answered by complete-luminaire failure data.
Chapter 26 Batch Consistency and Colour Tolerance
Consistency is the quality attribute most easily exposed at the acceptance stage and most difficult to write clearly into a contract. It cannot be seen in a single sample; it manifests between units of a batch and among the multiple light sources within one lamp.
Colour tolerance is expressed in SDCM (standard deviation of color matching); the smaller the value, the smaller the permitted deviation of chromaticity coordinates. GB 55016-2021, the General Code for Building Environment, requires that rooms where people work or stay for long periods have a colour rendering index Ra of not less than 80, a special colour rendering index R9 of not less than 0, and a colour tolerance of not more than 5 SDCM (Ministry of Housing and Urban-Rural Development announcement, 2021 edition). This is the floor value of a mandatory code. For places where colour discrimination is demanding, the requirement is Ra of not less than 90.
The chromaticity point of a colour temperature is judged against the seven-step quadrangle of ANSI C78.377-2017, which covers 2,200 to 6,500K. The Energy Star luminaire specification V2.2 was terminated at the end of 2024; it listed only five nominal colour temperatures from 2,700 to 5,000K (specification text). Procurement should require the supplier to provide chromaticity coordinates, or correlated colour temperature together with the deviation, and judge the chromaticity point against the seven-step quadrangle; the nominal colour temperature alone is insufficient.
The seven-step quadrangles are given in segments by colour temperature, and the permitted ranges differ in shape and size between 2,700K and 6,500K. The same 5 SDCM corresponds to different ranges of chromaticity coordinates at different colour temperatures. The colour tolerance clause must therefore be written together with the colour temperature: if it states only "not more than 5 SDCM" without the target colour temperature and the centre of the coordinates, a supplier can meet the figure at a centre of its own choosing while the chromaticity point departs from the colour temperature required by the buyer.
Binning is the source of colour tolerance. At the flux and colour binning step, the packaging plant bins by wavelength, brightness and forward voltage, and each grade is a bin. LED packages within the same bin have chromaticity coordinates and brightness falling within a narrow range. The finished-luminaire plant purchases by bin; mixing different bins within one lamp produces a colour difference visible to the eye, appearing as one or two luminaires in a row that are too blue or too yellow.
Consistency is bought with binning cost. The finer the binning, the lower the proportion of output falling into each bin and the higher the unit price; the coarser the binning, the lower the price and the worse the consistency of the complete luminaire. This is a direct trade between cost and consistency, and it is often where the gap between quotations for the same model lies (see Chapter 23).
The definition of a batch must be written into the contract. If it says only "same batch", a supplier can deliver a combination of different bins from the same packaging plant. An enforceable formulation sets out three items together: the same bin combination, the same production period and the same packaging plant. At incoming acceptance, luminaires to be installed in the same space are sampled for chromaticity coordinates and the colour differences among them are calculated; when different batches arrive, a small-area comparison is made before large-area installation. The rework these two measures save on projects supplied in multiple batches usually exceeds the cost of the sampling itself.
The measurement method also affects the decision. Chromaticity coordinates must be measured after the luminaire has been lit to stability; readings taken before stabilisation drift as junction temperature rises. Chromaticity coordinates from an integrating sphere and from a goniophotometer are consistent in principle, yet comparisons between laboratories still differ. For batch acceptance, it is advisable to use a single fixed laboratory or a single fixed set of equipment so that data are comparable between batches. Absolute differences across laboratories cannot be treated directly as batch differences.
Colour shift is a separate matter from initial colour tolerance. The chromaticity coordinates of LED packages drift with operating time; the blue chip and the phosphor age at different rates, so a luminaire that passes the initial colour tolerance may fall outside the original range after a period of use. The colour tolerance specification must therefore state whether it is an initial value or a maintained value; a figure without a time point cannot be judged at acceptance.
The colour rendering index needs to be examined in its parts. Ra is the average colour rendering index over 8 colour samples, and R9 is the special colour rendering index for saturated red. White LEDs often have an R9 close to zero or even negative; a product with Ra 80 may have a very poor R9, so red objects look dim and grey under the light. The Energy Star requirement is Ra of not less than 80 and R9 greater than 0. Scenarios such as medical care, printing and fabric inspection in textiles demand high fidelity in red; stating Ra of not less than 80 alone is insufficient, and R9 must be listed separately.
The way samples for testing are drawn determines how representative the conclusion is. Samples chosen by the supplier are usually the best-performing units on the line; only samples drawn at random from the incoming lot reflect the actual level. The contract can specify the sampling rule: draw a number of units at random by incoming lot number, seal and retain the samples, with one party submitting them for testing and the other keeping them for verification.
There is also a low-cost consistency check on site: light the luminaires awaiting acceptance side by side with already accepted luminaires, direct them at the same wall, and observe the seams of light patches and colour. This method yields no numerical value but can screen out obviously mixed-bin products; it is suitable as a first pass during initial incoming inspection, with suspect batches then sent to a laboratory.
Contract clauses can be written under three headings.
Colour tolerance: an initial value of not more than 5 SDCM, which is the floor of the mandatory code; for spaces with high colour requirements, a stricter value is agreed separately in the contract, and 3 SDCM is a common tightened value — once written into the contract it becomes a contractual term, although the national standard does not impose this requirement.
Binning: specify the bin codes and the permitted bin combinations, and provide the flux and colour binning report or chromaticity coordinate data at delivery.
Acceptance: state the sampling proportion, the measuring equipment (spectrometer or integrating sphere) and the decision rule (whether the chromaticity coordinates fall within the seven-step quadrangle of ANSI C78.377).
A colour tolerance clause must state all three at once — the value, the measurement method and the decision rule; if any one is missing, acceptance cannot be carried out.
Chapter 27 Yield and Repair
Yield is a composite indicator, the product of the results of three stages: incoming materials, processes and ageing. Only by looking at the three stages separately can the location of a problem be identified.
Incoming-material yield depends on the bin conformity rate of LED packages, the batch consistency of driver components and the dimensional tolerances of structural components. Incoming defects are difficult to detect before assembly and are exposed in concentration at the ageing stage, appearing as widespread failure of a batch after ageing. Responsibility for such problems lies with the supplier, yet the cost of dealing with them is borne first by the finished-luminaire plant.
Process yield covers the first pass yield of placement, the wiring and sealing quality of assembly, and the bonding quality of thermal interfaces. First pass yield refers to the proportion that passes all processes without rework. This indicator reflects process capability better than final yield, because final yield can be patched through rework, moving the problem to the repair station: the reported figure looks good, but the cost has not disappeared.
The role of the ageing stage is to screen out early failures, and its scope is limited. The difference between ageing every unit and ageing a sample shows up directly in the early failure rate at the customer. The labour hours and electricity saved by sampling are paid back in the first few months after installation in the form of on-site replacements.
Repairs fall into three periods by time of occurrence, with different causes.
Early failures concentrate within a few months of leaving the factory; the main forms are cold solder joints, driver capacitor failure, poor connector contact and seal defects. This is the range that ageing screening can cover, and where coverage is incomplete, the failures flow directly to the customer.
Mid-life failures concentrate between one and three years, mainly driver failure, followed by yellowing of optical parts and water ingress in outdoor luminaires. The causes lie in design selection and incoming-material grade, and have little to do with line operation.
Late-life failure is the depreciation of LED packages below L70; it is normal degradation within the design life, and the basis for judging it is given in Chapter 25. Counting late-life failures in the repair rate overstates quality problems on the part of the manufacturer; combining early and mid-life failures in one statistic obscures the areas that actually need improvement.
The composition of repair cost needs separate explanation. The cost of replacing a luminaire on site is far higher than the ex-works price of the luminaire itself: in the project channel it includes work at height, scaffolding or aerial platforms, coordination of power outages and disposal of the old luminaire; in commercial lighting it includes work outside business hours. The economic value of a reduction in repair rate is therefore usually greater than the same percentage reduction in purchase price. This point is most easily overlooked in price comparison, because it has no corresponding line on a quotation.
The comparability of repair rates depends on three qualifications, all of which are required: whether the denominator is units shipped or units installed; whether the time window is 30 days, 180 days or one year; and whether the criteria include complaints about lumen depreciation and colour difference beyond "not lighting". A repair rate without these three cannot meaningfully be compared. When a supplier reports a "repair rate of three per thousand", ask these three questions first, then whether the statistical scope covers all shipped batches.
Batch traceability is the prerequisite for attributing repairs, and it is a weak point at most finished-luminaire plants. The luminaire nameplate usually shows only the production date and model, not the batch; LED packages, drivers and structural components come from different suppliers, each with its own batch. When a repaired unit returns to the plant, it cannot be matched to a specific incoming batch and workstation. A workable practice is to require the finished-luminaire plant to put an internal batch number on the nameplate or packaging and to record, in the shipping documents, the LED package bin, driver model and production date used for that batch. This can be established with one sentence added to the contract; building it after the fact is very costly.
Failure analysis after teardown of repaired units should also be recorded in a fixed form: failure location, failure mode and corresponding batch. A repair without a record only replaces the luminaire and does not become a basis for improvement.
Supervision sampling data provide an external reference. In 2024, offline sampling found a non-conformity rate of 19.9 per cent for fixed general-purpose luminaires and 13.8 per cent for portable ones (SAMR notice, cited second-hand, 2025-06-03); in 2024, online-sold portable luminaires were sampled at 74 batches with 22 non-conforming, about 29.7 per cent, and online-sold fixed luminaires at 80 batches with 42 non-conforming, 52.5 per cent (SAMR notice, 2025-04-07); in 2025, sampling found non-conformity rates of 42.6 per cent for recessed general-purpose luminaires and 82.1 per cent for explosion-proof luminaires (SAMR notice, 2026-04-07). These figures describe the samples drawn and are not the same thing as in-plant yield, but the two often point in the same direction.
Data from the certification side point in the same direction. In the 2025 certification validity sampling inspection, 79 CCC certificates held by 29 companies in the lighting industry were withdrawn: 43 for recessed luminaires, 25 for fixed luminaires and 11 for portable luminaires, which sum to exactly 79 (CNR report, 2026-09-09; the original State Administration for Market Regulation announcement was not checked). The circumstances in which certificates are withdrawn are mostly related to consistency in volume production: the sample passed the type test, but key components were changed or material grades lowered in mass production.
An industry discussion published in September 2026 summarised the phenomenon as "passes on submission, deviates in volume production" (Guangming Online article, 2026-09-08). The article is a commentary and provides no statistical data, but the mechanism it describes is consistent in direction with the sampling and certification data above: the type test assesses the sample, while volume-production consistency assesses supplier management.
The comparability of repair rates depends on three items — the denominator, the time window and the decision criteria; a comparison missing any one of them does not hold.
Part Five: Procurement and Supply Relationships
Chapter 28 What to Verify at a Luminaire Factory
A luminaire's appearance can be copied from a sample; the equipment on the production line, the records, and the specificity with which staff answer questions cannot. A buyer who spends half a day to a day at the plant can judge the factory's real level along three lines: materials, equipment and records. The ten items below are arranged in the order from material receipt to finished-goods shipment; each item gives a pass line that can be judged on the spot, and one follow-up question that must receive a specific answer.
- Component source and batch
Pass line: the supplier can produce the name of the packaging plant, the model, the bin code and the production batch number of the LED packages used in this order, and the LED package batch number can be linked into a complete chain with the receiving note, the material requisition and the finished-goods shipment batch number. The bins must be given for all three at once: wavelength bin, brightness bin and voltage bin. A supplier that reports only the model and not the bins is treated as having incomplete documentation. The packaging plant bins by wavelength, brightness and voltage before dispatch, and this is the last step of the packaging process (packaging process). If two bins are mixed within one batch of luminaires without a record, any subsequent colour-difference dispute loses its point of traceability.
Follow-up: whether the bin codes for this batch are the same as those of the previous batch; if not, whether there is a written engineering change notice, and whether light distribution, colour temperature and luminous flux have been re-verified. A finished-luminaire manufacturer changing the LED package bin without changing the luminaire model is the hardest kind of change for a buyer to detect, because the appearance, packaging and nameplate do not change, and the test report still matches the model.
- Brand and source of the driver
Pass line: it is made clear whether the driver is produced in-house or purchased. For purchased drivers, the brand, model, manufacturing plant and datasheet are provided; for in-house drivers, the circuit topology (isolated or non-isolated), power factor, measured harmonic values, and the brand and specification of the electrolytic capacitor, MOSFETs and driver IC are provided. In one teardown sample of a bulb lamp, the light source accounted for 37.7%, the driver for 21.7% and structural parts for 18.5% (teardown sample). The sample comes from an electronics forum and can only be regarded as a single sample, but the weight of the driver in cost and its weight in failures point in the same direction.
Follow-up: whether the driver at the same power rating has changed design in the past two years; and, after the change, whether harmonic and disturbance voltage tests were repeated. The failure points of the driver, optical parts, heat-dissipation structure and solder joints may all precede the LED light source itself (U.S. Department of Energy report); if the driver design changes while the complete luminaire is not re-verified, the earlier certification and test reports become disconnected from what is actually shipped.
- Ageing line and ageing duration
Pass line: every finished unit goes through ageing on the line, the ageing line has timing devices, each station has start and end time records, and the records can be matched to the shipment batch number. Input power and luminous flux are re-measured after ageing, and the re-measurement data are kept on file. An ageing line that merely lights the products on a conveyor for a few minutes does not screen out early failures and cannot provide any traceable record.
Follow-up: how many hours the ageing lasts and what the basis for that duration is; whether switching cycles are applied during ageing; and where products judged defective after ageing go — dismantling, rework, or mixing into good product. A plant whose answers begin to blur by the third question usually has only a formality at the ageing step.
- Integrating sphere and goniophotometer
Pass line: the plant has its own integrating sphere, with a sphere diameter matched to product size. Under LM-79 (the recognised method for photometric and electrical measurement of complete luminaires), the integrating sphere diameter is not less than 1 metre for compact lamps, not less than 1.5 metres for larger luminaires, and not less than 2 metres for luminaires above 500 W; the lamp must be lit until temperature stabilises before measurement, which for large luminaires usually takes 30 minutes to 2 hours (LM-79 method). A plant without an integrating sphere should be able to provide an LM-79 report from a third-party laboratory, with the model in the report matching the model actually shipped and the report dated within the past two years.
Follow-up: when the integrating sphere was last calibrated and whether the standard lamp is within its validity period; whether the light distribution test uses the 2π or 4π method and whether it matches the product type — downlights and similar unidirectional distributions use the 2π method, while wide-distribution products place the light source at the centre of the sphere and use the 4π method. For engineering projects, the buyer should also ask whether there is a goniophotometer, because unified glare rating (UGR) and illuminance calculations require a light distribution file; a single total luminous flux figure cannot produce them.
- Colour tolerance control
Pass line: the colour tolerance of a shipment batch is held within 5 SDCM (standard deviation of colour matching). This is the requirement of Article 3.3.5 of the General Code for Built Environment (《建筑环境通用规范》) GB 55016-2021 for rooms where people work or stay for long periods; the same article also requires a colour rendering index Ra of not less than 80, a special colour rendering index R9 of not less than 0, and a colour tolerance of not more than 5 SDCM (announcement of the Ministry of Housing and Urban-Rural Development (MOHURD)). The chromaticity coordinates should fall within the seven-step quadrangle of ANSI C78.377 (Energy Star Luminaires Specification V2.2 (terminated)). Commercial projects and high-end residential projects usually also list the batch-to-batch deviation of correlated colour temperature (CCT) separately.
Follow-up: how many steps the binning uses; when bins are mixed within a batch of luminaires, how it is ensured that side-by-side installation shows no colour difference visible to the naked eye; and whether there are measured chromaticity records for the first, middle and last units of the same batch. Colour tolerance is one of the few metrics that cannot be remedied by eye after delivery; once installed on the ceiling, a colour difference can only be solved by replacing the whole batch.
- Energy-efficiency registration
Pass line: the product falls within the energy efficiency label catalogue, its registration can be found in the public database of the China Energy Label Center, and the registered model, specification and energy efficiency grade match the physical product, the packaging and the instruction sheet in all four places. LED downlights, directional integrated LED lamps and non-directional self-ballasted LED lamps are subject to GB 30255-2019; the standard sets three energy efficiency grades, and for products with a colour rendering index Ra of not less than 90 the energy efficiency index may be reduced by 10 lm/W (standard information, standard interpretation). LED panel lights are subject to GB 38450-2019, whose energy efficiency label implementation rule has applied since 1 June 2024 (notice).
Follow-up: in whose name the registration is made, the plant itself or an upstream party; how the model coverage relationship is written in the registration; GB 30255-2026 was published on 27 February 2026 and takes effect on 1 September 2027, adding standby power requirements and extending the product scope — what are the plant's transition plan and inventory disposal plan (standard information, revision note).
- Safety certification
Pass line: the CCC certificate is within its validity period, the applicant, manufacturer and production enterprise columns on the certificate match the actual relationships, and the models listed on the certificate cover this order. Luminaires fall under Category 9 (lighting appliances) of the compulsory product certification catalogue, luminaire category code 1001, covering fixed, portable, recessed, aquarium, night light, ground-recessed and children's portable luminaires; lighting equipment below 36 V is not in the catalogue (announcement of the Certification and Accreditation Administration (CNCA)).
Follow-up: whether the certificate is a type test certificate or a derivative certificate; whether the driver, LED package or terminal block has changed in the critical component list on the certificate's attachment page; and, after any change, whether it was reported to the certification body. In the 2025 certification validity sampling inspection, 29 enterprises and 79 CCC certificates in the lighting industry were revoked, of which 43 were for recessed luminaires, 25 for fixed luminaires and 11 for portable luminaires (China National Radio report). A valid certificate and a factory that continues to comply are two different propositions; what the sampling inspection revokes are precisely certificates that are within their validity period but no longer comply.
- Incoming inspection
Pass line: the five key materials — LED packages, drivers, aluminium substrates, lenses and terminal blocks — have incoming inspection records, and the records include sampling ratio, acceptance criteria, measured data and disposition of defects. Incoming inspection of LED packages covers at least three items: appearance, sampled photometric and electrical parameters, and bin verification. An inspection record containing only the word "pass" is treated as no inspection at all.
Follow-up: which materials are exempt from inspection and on what basis; whether the inspection data for three consecutive batches from the same supplier can be retrieved on the spot; and how a non-conforming incoming batch is handled — return, concession acceptance or selective use. Concession acceptance records deserve particular attention: they reflect the factory's actual trade-off between delivery time and quality, and also the supplier's bargaining power inside the factory.
- Repair rate records
Pass line: shipment quantities and repair quantities for the past 12 months can be given by model and by batch, with repair causes classified into specific failure modes, including dead LEDs, flickering, lumen depreciation, colour shift, driver failure and structural problems. This data says more about a factory's true quality level than any brochure or promotional video, and best reflects how much it has invested in failure analysis.
Follow-up: whether the statistical basis is the return rate or the repair rate; whether replacements at the distributor end are included; and what caused the three batches with the highest repair rates and what was changed afterwards. A factory that cannot answer with failure-mode categories has usually never done failure analysis; repaired items are simply replaced, never opened up and examined.
- Outgoing sampling inspection
Pass line: each shipment batch is sampled at a set ratio, with items covering at least light-up, input power, luminous flux, colour temperature, power factor, withstand voltage and earth continuity; the sampling records are tied to the shipment batch number, and retained samples are kept and traceable to the specific batch.
Follow-up: when sampling finds non-conformity, whether the whole batch is reworked or sorted before shipment; where the sorted-out defective items go; how long retained samples are kept, and whether the same-batch retained sample can be retrieved for third-party retesting when a customer dispute arises. A retained sample is the only physical evidence in an engineering dispute that can link "the batch that arrived" to "the batch that was produced at the time".
Once the ten items have been checked, the buyer's judgement of the factory can be anchored to specific steps. What the ten items have in common is that they can be completed within one to two working days through on-site verification and document review, without destructive testing and without relying on the other party's oral statements. A company that can produce records consistently may not be large, but its process control is certainly stable; a company that cannot produce records often cannot even say which step the problem lies in.
Chapter 29 Division of Responsibility Between Component Suppliers and Finished-Luminaire Manufacturers
When a luminaire fails, the failure point may be the LED package, the driver, an optical part, the heat-dissipation structure, a solder joint or the installation site. The first step in allocating responsibility is to match the failure mode to traceable evidence; only the second step is to discuss compensation. Without the first step, the discussion stays at the level of each side citing a report favourable to itself.
- Attributable characteristics of three failure modes
Lumen depreciation. The lumen maintenance of an LED package is described by LM-80 (the method for measuring lumen maintenance of light sources) data. LM-80 requires at least three case temperature points — 55 °C, 85 °C and a third temperature chosen by the manufacturer — with case temperature controlled to ±2 °C, a test duration of at least 6,000 hours (10,000 hours recommended), and data collected every 1,000 hours (U.S. Department of Energy LM-80 explainer). TM-21 (the lumen maintenance projection method) uses these data to project lumen output beyond the test period; the projection period does not exceed 6 times the measured duration, and 25 samples are required for each temperature and current combination (TM-21 explainer). L70 denotes the operating time at which 70% of initial luminous flux is maintained (definition). The key point is that TM-21 projects for the LED light source component; the driver, optical parts, heat dissipation and solder joints may all fail earlier (U.S. Department of Energy). If a finished-luminaire manufacturer uses an LED package's LM-80 report to promise customers tens of thousands of hours for the complete luminaire, it is treating component data as complete-luminaire data.
Colour shift. There are three common sources of chromaticity coordinate shift: ageing of the phosphor and packaging silicone at high temperature, drift of drive current with temperature, and insufficient heat-dissipation design leaving junction temperature persistently high. The three can be roughly separated on site: if chromaticity is normal at cold start and shifts after thermal stabilisation, with different shift magnitudes at different installation positions (different heat-dissipation conditions), the cause points to thermal design; if the same retained sample reproduces the shift on an ambient-temperature ageing bench, the cause points to the component. These two phenomena can be distinguished by a cold-versus-hot comparison, without waiting for a third-party report.
Dead LEDs. Dead LEDs in LED products commonly arise from bond wire breakage, solder joint cracking, electrostatic discharge damage and driver surges. In the packaging step, wire bonding connects the chip electrodes to the lead frame with gold or copper wire by thermosonic bonding (packaging process). These failures look different under a microscope: bond wire breakage shows as necking or fatigue cracks, solder joint cracking propagates along the interface, and electrostatic damage shows as local melting of the chip. A failure analysis report without micrographs and elemental composition data, containing only the sentence "LED package defective", is not sufficient as a basis for determining responsibility.
- Using case temperature as the dividing line
A packaging plant's LM-80 data are measured at specified case temperatures, and the test report states the data and sample count for each temperature point. If the actual case temperature of the complete luminaire is persistently higher than the component's test case temperature, the acceleration of lumen depreciation comes from the luminaire's thermal design and responsibility lies with the finished-luminaire manufacturer; only when the actual case temperature is below the test point and rapid lumen depreciation still occurs does the cause point to the component itself. This dividing method can be written directly into the technical agreement: specify the upper limit of case temperature for the complete luminaire under the most unfavourable installation conditions, specify the lumen maintenance index corresponding to that case temperature, and specify the measurement method and the location of the measurement point.
The advantage of using case temperature as the dividing line is that it is measurable, reproducible and requires no dismantling. The prerequisite is that both parties fix the measurement point in the agreement — whether case temperature is measured on the solder pad, the substrate or the heat sink surface; the same "case temperature" reads differently at different points, and without an agreed point the data cannot be compared. The more robust engineering wording specifies the case temperature limit, the ambient temperature limit and the installation method together; if any one of the three is missing, the test conditions can be interpreted arbitrarily.
- Attribution of driver responsibility
Drivers are not covered by LM-80 or TM-21. For a purchased driver's failure, responsibility usually lies with the driver supplier, but the finished-luminaire manufacturer's customer-facing responsibility does not change: the customer recognises only the complete-luminaire maker. An independent technical agreement is needed between the finished-luminaire manufacturer and the driver maker, specifying the input voltage range, harmonic limits, surge level, the rated temperature and life of the electrolytic capacitor, and the criteria for overvoltage, overcurrent, short-circuit and overtemperature protection.
Harmonics are a frequent source of driver responsibility disputes. GB 17625.1-2022, which adopts IEC 61000-3-2:2020 with modifications, has applied since 1 July 2024, and lighting equipment falls into Class C; for rated power above 25 W, the 3rd harmonic does not exceed 30 times the power factor, the 5th does not exceed 10%, the 7th does not exceed 7%, the 9th does not exceed 5%, and the 11th to 39th do not exceed 3%; for 5 W to 25 W alternative limits apply, with the 3rd harmonic not exceeding 86% and the 5th not exceeding 61%; products below 5 W are newly exempted in the 2022 edition (standard interpretation). In the same luminaire, changing the driver or altering the filter circuit once can turn harmonics from non-conforming to conforming, or the reverse. If the driver is changed without retesting, responsibility lies with the finished-luminaire manufacturer.
- Optical parts, heat-dissipation parts and solder joints
Responsibility for optical parts is often overlooked. Lenses and diffusers yellow under ultraviolet light and high temperature, which both lowers luminous flux and shifts chromaticity coordinates, resembling LED package lumen depreciation. The way to distinguish is to remove the optical parts and test the LED packages alone; if the LED packages maintain normal lumen maintenance while the complete luminaire declines, the problem lies in the optical parts. Optical parts are generally selected by the finished-luminaire manufacturer, and responsibility rests with it.
The core indicators of heat-dissipation parts are thermal conductivity and contact thermal resistance. The material of the die casting, the wall thickness of the extrusion, the amount of thermal grease applied and the screw torque all change the actual thermal resistance. These parameters are determined by the finished-luminaire manufacturer's structural design and cannot be controlled by the packaging plant. Solder joints and the SMT (surface-mount technology) reflow profile are the same: they fall under the finished-luminaire manufacturer's process responsibility. Wiring errors and inadequate waterproofing at the installation site belong to the installer. Writing these four categories of responsibility separately in the contract is far more useful than a blanket clause that "the supplier is responsible for quality problems".
- Four anchor points in contract clauses
There are four clauses in a technical agreement that can genuinely constrain the allocation of responsibility. The first is the definition of failure: lumen depreciation, colour shift and dead LEDs are each written as measurable criteria, with measurement methods and instrument requirements attached. The second is sampling and retained samples: specify the number of retained samples per batch, the storage conditions and the retention period, with retesting of retained samples as the basis in a dispute. The third is the responsibility period and response: distinguish the replacement period, the repair period and the compensation period, and state the response time limit. The fourth is failure analysis: specify who conducts it, who advances the cost, and how the cost is shared if the conclusion does not hold.
The most easily omitted of the four anchor points is retained samples. Without retained samples, each side takes its own sample for testing, the resulting data cannot be tied to the disputed batch, and the testing fee is spent without producing an admissible conclusion. The number of retained samples need not be large — enough for one complete photometric and electrical test and one teardown is sufficient; the key is proper storage conditions and batch marking.
- Typical forms of disagreement
The most common is the finished-luminaire manufacturer and the packaging plant each citing LM-80 reports against the other. The packaging plant says its data show maintenance above the agreed value at 10,000 hours, while the finished-luminaire manufacturer says the complete luminaire measured over three months has dropped by more than ten percent. Both sets of data may be true, because the test case temperatures differ, the drive currents differ and the heat-dissipation conditions differ. The way to resolve such disagreements is to measure the actual case temperature and drive current of the complete luminaire and compare them item by item with the test conditions in the packaging plant's report; arguing over the credibility of the reports is pointless.
Another is a cluster of dead LEDs in one batch, with each side holding to its own account of the cause. What is needed here is failure analysis, and compensation negotiations should follow it. The cost of failure analysis is usually advanced by the party requesting it and borne by whichever party the conclusion points to; writing this clause into the agreement filters out a considerable share of unfounded claims.
One more is the hardest to handle: the brand owner prints its own trademark on the complete luminaire, while the packaging plant puts no marking at all on the LED package. Here the responsibility chain is held together by batch numbers; if the batch number breaks, the chain breaks. Hence the "batch numbers linked into a chain" in item one has higher value in allocating responsibility than in quality management.
The anchor of responsibility allocation is measurable conditions; once written into the contract, fault has no room for interpretation in the face of measurement results.
Chapter 30 Forms of Quality Dispute in the Project Channel
The difference between the project channel and the retail channel is that luminaires are only one division of a project. When luminaires go wrong, what is affected is the construction schedule, acceptance and the final payment. The chain usually involves five parties — the owner, the design institute or lighting consultant, the general contractor, the distributor and the manufacturer — and the contractual relationships do not coincide with the flow of goods. There is often no contract between the manufacturer and the owner, and a distributor usually sits between the general contractor and the manufacturer. This structure determines the shape of disputes: the focus often lands on "who says what to whom", with technical issues pushed to the back.
- Delivered parameters not matching tender parameters
The tender documents specify luminous efficacy, colour rendering index, glare value and colour tolerance; bids are submitted against those parameters, and supply is substituted according to cost. The most common substitutions occur in the LED package bin and the driver design, with appearance, packaging and nameplate unchanged. What the owner can check on delivery is to light the sealed sample and the delivered product under the same conditions and compare them, then retrieve the LM-79 report for that batch. In projects without a sealed sample, parameter disputes are essentially impossible to trace back.
The difficulty in this type of dispute lies in proof. The manufacturer can produce a compliant test report, but the report covers the submitted sample; the delivered product in the owner's hands has not been tested. Each side's evidence holds, and the dispute cannot be pinned to the same batch of goods. A workable approach is to sample by batch on delivery and have a third-party laboratory acceptable to both sides perform photometric, electrical and harmonic testing once, with the cost charged to the project.
- Colour difference across partial deliveries
Luminaires for a project often arrive in several deliveries and are installed on different floors or in different areas. If the first and third deliveries use LED packages from different bins, the difference is visible to the naked eye when they are installed side by side or in adjacent areas. GB 55016-2021 requires, for rooms where people work or stay for long periods, Ra of not less than 80, R9 of not less than 0 and colour tolerance of not more than 5 SDCM (MOHURD announcement), but the code governs the metrics of a single room and does not reach differences between partial deliveries. The project contract needs supplementary provisions on the permitted chromaticity deviation between batches and on how mixed-batch installation is handled.
- Early lumen depreciation and clustered dead LEDs
Failures appearing relatively soon after installation are mostly caused by heat-dissipation design and the driver. Recessed luminaires have limited heat-dissipation space because of the ceiling void, so actual case temperatures are often higher than in laboratory conditions; when the driver sits inside a sealed housing, the operating temperature of the electrolytic capacitor is raised. What the project side sees on site is failure across a whole area, while every sample the manufacturer submitted for testing passed.
The key evidence in this type of dispute is measured records of on-site case temperature and driver housing temperature, plus comparative testing of uninstalled stock from the same batch. The value of stock comparison testing is that it separates "a problem with the product itself" from "a problem with the installation environment". If stock products also degrade rapidly on an ambient-temperature ageing bench, the problem is in the batch; if the stock is normal and on-site units fail, the problem is in the heat-dissipation or power-supply environment.
- System problems caused by harmonics and disturbance
The luminaire itself lights, but the distribution system misbehaves. Superimposed harmonic currents cause neutral conductor overheating and nuisance tripping of circuit breakers, while disturbance voltage affects low-voltage equipment on the same circuit. Such problems are invisible in single-luminaire testing and appear when a whole floor or a whole building is lit at once. National supervision sampling data show this is not an isolated phenomenon: in the 2024 offline sampling of fixed general-purpose luminaires, 231 batches were inspected and 46 were non-conforming, of which 38 were non-conforming for harmonic current, 27 for disturbance voltage and 18 for protection against electric shock (China Lighting Network report citing the State Administration for Market Regulation notice). If project acceptance covers only single-luminaire light-up and illuminance measurement, this whole class of problems passes unnoticed.
- Flicker
Flicker is called out separately in offices, classrooms and places where cameras are used. Assessment is commonly based on NEMA 77 and IEEE 1789 (Energy Star Luminaires Specification V2.2 (terminated)). The dispute pattern is that stripes appear when the owner films with a mobile phone, or a flicker meter measures modulation depth above the limit, while the manufacturer's report does not include this item. Remedying flicker usually means replacing the driver, at a cost close to replacing the luminaire, so writing the flicker index and measurement method into the contract at the contract stage is more effective than arguing afterwards.
- Version citation in acceptance standards
Project contracts often state that acceptance follows "the current national standards", a phrase that becomes a source of dispute in a year when standards are revised. The Standard for Lighting Design of Buildings (《建筑照明设计标准》) GB/T 50034-2024 was published on 12 March 2024 and took effect on 1 August 2024, fully replacing GB 50034-2013, with its status changed from mandatory to recommended (MOHURD). The old version required 300 lux for ordinary offices, a unified glare rating of not more than 19 and a colour rendering index of not less than 80, and these values have been copied directly into a great many contracts (excerpt of the old clauses). When the contract signing date and the acceptance date straddle a revision point, it must be made explicit which version applies. It should also be noted that after GB/T 50034-2024 became recommended, mandatory general codes such as GB 55016-2021 remain in force, and the acceptance basis cannot cite only a recommended standard.
- Layer-by-layer amplification of warranty promises
The manufacturer gives the distributor three years, the distributor gives the general contractor five years, and the general contractor gives the owner eight years. The longer the chain, the greater the amplification of the promise. When a dispute arises, the owner goes to the general contractor, the general contractor to the distributor, the distributor to the manufacturer, and the manufacturer produces a three-year warranty clause; the chain breaks there. A workable approach is to require the manufacturer to issue a warranty commitment addressed to the final owner, or to stipulate in the contract that warranty responsibility transfers with the goods and is not shortened by intermediate parties.
The warranty clause must also state the start date and the scope of cover clearly. Whether the start date runs from the shipment date, the delivery date or the completion acceptance date, the three methods can differ by more than half a year on projects with long construction periods. Whether the scope is written as "complete luminaire" or "light source" determines whether lumen depreciation falls within the warranty. If these two items are not stated clearly, the warranty period is just a number.
- Evidence gaps
The three most common evidence gaps in project disputes are the sealed sample, the retained sample and the site acceptance record. A missing sealed sample makes parameter disputes impossible to compare; a missing retained sample makes failure causes impossible to retest; a missing site acceptance record makes it impossible to tell whether the problem arose in production or in transport and installation. These three items cost very little, and the cost of remedying their absence is very high.
- Paths to resolving disputes
For a technical dispute, first have testing done by a third party acceptable to both sides, with the test items determined by the points in dispute rather than a full suite. Responsibility and compensation are discussed only after the test conclusion is clear; if the order is reversed, the negotiation turns into an argument about the testing body's credentials. For disputes involving larger amounts or safety, a failure analysis report is also needed, containing micrographs, elemental composition data and a judgement of the failure mechanism; a report with only a conclusion and no process has limited value in arbitration.
Most disputes in the project channel are already seeded when the contract is signed; the acceptance stage merely exposes them. Writing these five items into the contract — sealed sample, permitted batch colour deviation, flicker index, acceptance standard version and warranty transfer — eliminates more disputes than any after-sales team.
Chapter 31 Certification, Energy-Efficiency Registration and Delivery Documents
Compliance documents for domestic supply fall into three layers: the access layer is compulsory product certification, the energy-efficiency layer is energy efficiency label registration, and the agreed layer is test reports, factory inspection records and warranty documents. Each layer has its own competent authority and query portal; the buyer must verify them separately and cannot substitute one document for another.
- Compulsory product certification
Luminaires fall under Category 9 (lighting appliances) of the compulsory product certification catalogue, luminaire category code 1001, covering fixed, portable, recessed, aquarium, night light, ground-recessed and children's portable luminaires; lighting equipment below 36 V is not in the catalogue (CNCA announcement). Announcement No. 9 of 2024 added explosion-proof luminaires and control gear to the catalogue under category code 2318 (reprinted announcement).
Checking a certificate means looking at four columns: applicant, manufacturer and production enterprise. If the three columns are consistent, the product is self-produced; if not, the OEM or private-label relationship must be clarified, and whether the certificate covers the actual production plant. The critical component list on the certificate's attachment page is the second checkpoint: a change to any of the driver, LED package, terminals or power cord may require a change application or retesting.
The impact of a standard revision on certificates requires separate explanation. GB 7000.1-2015 is identical to IEC 60598-1:2014 and long served as the basis for CCC certification of luminaires (standard note). GB/T 7000.1-2023 was published on 28 December 2023 and takes effect on 1 January 2026; its status changes from mandatory GB to recommended GB/T, and it adopts IEC 60598-1 with modifications; the three supporting sub-standards for fixed, recessed and portable luminaires are also 2023 editions, effective the same day (standard information, sub-standard note). When checking certificates after 2026, the buyer should confirm the standard year cited on the certificate and the certification body's transitional arrangements for the revision, rather than only whether the certificate is within its validity period. Where a standard's status changes from mandatory to recommended, whether the certification basis switches with it depends on the version of the certification implementation rule; written confirmation should be obtained from the certification body or the supplier on this point.
- Energy efficiency label and registration
The energy efficiency label is managed by registration. For products in the catalogue, the enterprise tests in-house or commissions testing under the implementation rule, registers with the energy label centre and applies the label. The catalogue has expanded in several batches: the labelling implementation rule for non-directional self-ballasted LED lamps has applied since 1 October 2016 (rule); LED products for indoor lighting have applied since November 2020 under NDRC Circular No. 640 [2020] on Resource Conservation and Environmental Protection, covering downlights, directional integrated types and non-directional self-ballasted types (document); the labelling implementation rule for LED panel lights has applied since 1 June 2024, valid for five years, and products manufactured before that date may continue to 1 June 2026 (notice). The 2026 edition of the catalogue further adds LED luminaires for road and tunnel lighting, effective 1 June 2026, and sets the implementation date for LED products for indoor lighting at 1 September 2027 (catalogue).
Registration information should be checked in three places: the registering entity, model coverage and energy efficiency grade. If the registering entity is a trading company, ask about the actual production plant; if model coverage is written as a "series", request the coverage list; the energy efficiency grade must match the measured values in the test report; the grade printed on the label alone is not enough. Supervision of energy efficiency labels focuses on consistency between registered information and the actual product; labelling one grade lower can result in the whole batch being delisted.
- Performance and agreed documents
This layer has no uniform mandatory requirement and is set by contract. Common items are LM-79 photometric and electrical test reports, LM-80 light source lumen maintenance data, IP rating (ingress protection) test reports, blue light hazard classification reports, flicker test reports, salt spray or anti-corrosion reports (for outdoor luminaires), factory inspection records and warranty documents.
The LM-79 report must be checked to confirm that the test object is the complete luminaire. The method standard makes clear that LM-79 applies to complete luminaires and luminaires, and not to chips, packages or arrays (LM-79 method). If the manufacturer's report tested LED packages or a light source board, it cannot serve as proof of complete-luminaire performance.
Blue light hazard is assessed under GB/T 20145 (identical to IEC 62471). GB/T 7000.1-2023 has replaced GB 7000.1-2015 and takes effect on 1 January 2026; the 2023 edition deletes the former RG0 classification, and blue light hazard is instead assessed under the normatively referenced GB/Z 39942 (the method corresponding to IEC TR 62778), with the criterion being not more than RG1; the 2015 edition's clause on children's portable luminaires not exceeding RG1 at 200 mm serves only as historical reference (standard note).
- Delivery document list
The table was compiled for this article, for item-by-item checking at acceptance of delivery in domestic projects and centralised procurement projects.
| No. | Document | Issued by | Points to check |
|---|---|---|---|
| 1 | CCC certificate and attachment pages | Certification body | Model coverage, critical component list, certificate status |
| 2 | Energy efficiency label registration information | Enterprise, label centre | Registering entity, model coverage, energy efficiency grade |
| 3 | LM-79 photometric and electrical test report | Third-party laboratory | Test object is the complete luminaire, model matches, date |
| 4 | LM-80 data and TM-21 projection | Packaging plant, finished-luminaire manufacturer | Three case temperature points, test duration, sample count |
| 5 | IP rating test report | Third-party laboratory | Consistent with nameplate marking |
| 6 | Blue light hazard classification report | Third-party laboratory | RG class, limit for children's portable luminaires |
| 7 | Flicker test report | Third-party laboratory | Assessment basis and modulation depth |
| 8 | Factory inspection records | Production plant | Tied to shipment batch number |
| 9 | Warranty document | Production plant | Start date, scope of cover, response method |
| 10 | Critical component list | Production plant | Consistent with CCC attachment page |
- Common problems in document checking
The first is that the certified model does not match the physical product. In the same series the low-power model is certified and the high-power model is not, and supply uses the low-power certificate to cover the high-power product. The second is that the critical component list has not been updated, and the driver actually used differs from the certificate attachment page. The third is that reports are based on submitted samples rather than sampling, with the samples chosen by the enterprise itself. The fourth is that reports are stale; reports themselves have no validity period, so the buyer needs to specify in the contract a requirement for how recently they must be issued.
The results of the 2025 certification validity sampling inspection can serve as a risk warning: 39 categories of products and 2,483 batches, with 764 CCC certificates revoked; in the lighting industry, 29 enterprises and 79 certificates were revoked (China National Radio). Revoked certificates were all in valid status before revocation; a buyer's finding that a certificate is "within its validity period" cannot replace a judgement on production consistency.
The value of compliance documents lies in being checkable: the model matches, the date falls in a reasonable range, and the critical component list matches the physical product — these three points matter more than the thickness of the file.
Chapter 32 Compliant Delivery for Export Orders
Compliance for export orders falls into three layers: product safety, energy efficiency and substance restrictions. The governing rules, the bodies issuing documents and the responsible parties differ for each layer; all three must be prepared separately before shipment, and a missing layer may lead to the goods being stopped at customs clearance or listing in the destination country.
- European Union: ErP and energy labelling
The ecodesign requirements for light sources and separate control gear are set by (EU) 2019/2020, applicable from 1 September 2021. At its core is a method for calculating maximum permitted power: P_onmax = C × (L + Φ_use/(F × η)) × R, where Φ_use is useful luminous flux, F is a factor taken as 1.0 for non-directional light sources (based on total luminous flux) and 0.85 for directional light sources (based on flux within the cone), η is the threshold luminous efficacy, and C and R are correction factors given by product type (regulation annex). Standby power must not exceed 0.5 W. In the second stage, from 1 September 2023, the threshold luminous efficacy for 2-foot, 4-foot and 5-foot T8 fluorescent lamps rises from 89.7 lm/W to 120.0 lm/W.
The ErP technical documentation must cover the list of product models and variants, a comparison of the calculated maximum permitted power against actual power, test data for luminous flux and colour temperature, standby power, and the basis for determining declared values. The document retention period and the EU declaration of conformity (DoC) are the documents most often requested first at customs clearance and during market surveillance. A common defect in technical documentation is listing only the final model without the power variants and dimming versions under the same model, when variants are precisely what regulatory sampling focuses on.
Energy labelling is governed by (EU) 2019/2015, applicable from 1 September 2021, with grades from A to G; stock products bearing the old label may be sold until 1 March 2023 (note). Suppliers must register in EPREL (the European Product Registry for Energy Labelling) from 1 May 2021, and the registration number must appear on the label and in promotional material. EPREL registration is not a one-off task; changes to product parameters must be updated in step.
- European Union: RoHS declaration
The RoHS Directive 2011/65/EU restricts 10 substances: lead, mercury, hexavalent chromium, polybrominated biphenyls, polybrominated diphenyl ethers, and four phthalates (DEHP, BBP, DBP, DIBP); the limit is 0.1% for the first nine and 0.01% for cadmium; lighting equipment falls under Category 5 of the Directive's annexes (directive annexes). Mercury-containing light sources have power-dependent exemptions; for example, general-purpose fluorescent lamps below 30 W have a mercury content limit of 2.5 mg (exemption list note).
A RoHS declaration takes two forms: a self-declaration by the enterprise and a third-party test report. In EU market surveillance sampling, a self-declaration needs supporting supply-chain declarations and test data. The declaration must state the applicable directive, exemption clause numbers, test methods and testing body, and indicate the range of models covered. Where a declaration is issued by a trader without the actual manufacturer's knowledge, responsibility still returns to the exporter if sampling occurs.
- United States: safety listing
Fixed luminaires fall under ANSI/UL 1598, LED luminaires additionally under UL 8750, self-ballasted lamps under UL 1993, and portable luminaires under UL 153 (Energy Star Luminaires Specification V2.2 (terminated)). Products must be tested and listed by a third-party testing laboratory (NRTL) recognised by the U.S. Occupational Safety and Health Administration (OSHA); common NRTLs include UL, ETL (Intertek), TÜV and CSA. Listing (Listed) applies to complete products and recognition (Recognized) to components; what a complete-luminaire shipment needs is listing.
The core of the UL file is the file number and the product category code, and the factory inspection (Follow-Up Service) is the condition for maintaining listing. When checking UL files, the buyer or importer should see whether the product category corresponding to the file number covers this batch and whether factory inspections have been passed continuously. If the file number exists but factory inspections have lapsed, listing eligibility likewise lapses.
- United States: FCC, DOE and Energy Star
Ordinary luminaires use a Supplier's Declaration of Conformity (SDoC) under FCC Part 15B; products with wireless functions such as Wi-Fi, Bluetooth or Zigbee apply for an FCC ID under Part 15C (note). The U.S. Department of Energy (DOE) sets minimum luminous efficacy requirements for general lighting (Chinese secondary source; the original DOE text has not been verified). Energy Star is a voluntary certification. Its Luminaires V2.2 specification was terminated on 31 December 2024, and currently only recessed downlights continue to be certified under Downlights V1.0; the historical requirements of V2.2 were a colour rendering index Ra of not less than 80 with R9 greater than 0, chromaticity within the seven-step quadrangle of ANSI C78.377, and a power factor of not less than 0.7 for solid-state luminaires above 5 W (not less than 0.5 at 5 W or below). The specification has been terminated, and the values above serve only as historical reference (specification text).
- Shipment document list
The table was compiled for this article, arranged by destination market.
| Market | Document | Issued by | Points to check |
|---|---|---|---|
| EU | Declaration of conformity (DoC) | Manufacturer, importer | Directive and harmonised standards, model, signatory |
| EU | ErP technical documentation | Manufacturer | Maximum permitted power calculation, measured power |
| EU | Energy label and EPREL registration number | Manufacturer | Grade, registration number, parameter consistency |
| EU | RoHS declaration and test data | Manufacturer, supplier | 10 substances, exemption clauses |
| U.S. | UL listing file | NRTL | File number, product category, factory inspection |
| U.S. | FCC SDoC or FCC ID | Manufacturer, laboratory | Wireless function corresponds to Part 15C |
| U.S. | DOE compliance | Manufacturer | Minimum luminous efficacy |
| General | Test report | Third-party laboratory | Model, date, test object |
- Four nodes in the order process
Compliance work has four nodes in the order process. At the quotation stage, confirm the destination market's access requirements and the certification held, so as to avoid quoting and only then discovering that the certificate is not in hand. At the sampling stage, confirm that critical components match mass production; certification follows the critical component list, so if the sample uses brand A's driver and mass production switches to brand B, the certificate becomes invalid. At the mass-production stage, perform first-article confirmation and critical component verification. At the shipment stage, prepare all documents according to the list, with the model and batch number on the documents corresponding one-to-one with the physical goods.
The most easily breached of the four nodes is the transition from sampling to mass production. The certification body approves the critical component combination of the submitted sample; if the production line changes the driver or LED package to save cost while the product's appearance stays the same and the certificate number is still used, exposure comes when the goods are sampled after arrival at port. Once such a problem is found in destination-country sampling, the cost of delisting and recall ultimately returns to the exporter.
- Handling differences between destination countries
For markets other than the EU and the United States, rule systems mostly follow IEC alongside national compulsory certification, and specific access requirements must be confirmed order by order for the destination country; this article does not list them one by one. One generally applicable practice is to prepare three basic sets of material: a safety test report issued under the IEC system, a RoHS or equivalent substance restriction declaration, and energy efficiency test data. With these three in hand, adding local certification for each destination's differences is faster than preparing from scratch for every market.
The cost of export compliance is concentrated in getting it right the first time; the cost of rework is concentrated after arrival at port. Listing the destination market's document requirements at the quotation stage is far cheaper than filling in documents a week before shipment.
Part Six: Outlook and Boundaries
Chapter 33 The Evolution of Concentration: Upstream Concentrated, Downstream Dispersed
In 2024, the three tiers of the semiconductor lighting industry recorded output values of RMB 32.4 billion (324 亿元) for upstream epitaxial chips, RMB 78.4 billion for midstream packaging and RMB 514.2 billion for downstream applications, a total of RMB 625 billion. Blue book data, cited via a listed company's annual report Calculated on these three tiers, upstream accounts for 5.2%, midstream for 12.5% and downstream for 82.3%. Output value grows towards the downstream end, the number of participants grows with it, and the average share of a single participant becomes smaller.
Upstream concentration has two mutually corroborating measurements. One is that the top six companies account for more than 80% of production capacity, sourced from TrendForce and CSA Research data cited in a chip company's prospectus. Prospectus citation The other is the share of the top three: in 2021, Sanan Optoelectronics held 31.68%, HC Semitek 14.28% and MTC 12.42%, together 58.38%; another report puts the top-three range at 55% to 58%. Industry report The two measurements differ in year and in basis but point to the same order of magnitude: upstream supply is decided by a single-digit number of companies.
The midstream tier is one notch lower. GEPResearch puts the global top five at about 41% GEPResearch, which means that nearly 60% of the share is dispersed outside the top five. For the size of China's packaging market, two sets of figures give RMB 86.5 billion (Huajing Industry Research Institute) and RMB 78.4 billion (blue book, cited via a listed company's annual report), a difference of RMB 8.1 billion. Huajing definition The two definitions cover different statistical scopes, and this report sets them side by side.
The degree of downstream fragmentation is measured by the number of business entities. Guzhen Town in Zhongshan City covers less than 50 square kilometres and hosts more than 30,000 lighting and decorative-lighting business entities; its decorative-lighting sales account for 70% of the domestic market and 50% of the international market for comparable products. CCTV report This figure is not on the same denominator as the more than 3,600 industrial enterprises above designated size (2024, whole industry): the former includes manufacturers, traders, supporting suppliers and sole proprietors, while the latter are included according to the statistical threshold. Association data
| Tier | 2024 output value (RMB 100 million) | Share of the three-tier total | Concentration measure | Basis of the concentration measure |
|---|---|---|---|---|
| Upstream epitaxial chips | 324 | 5.2% | Top six account for more than 80% of capacity | TrendForce and CSA Research, cited in the prospectus |
| Midstream packaging | 784 | 12.5% | Global top five at about 41% | GEPResearch |
| Downstream applications | 5,142 | 82.3% | More than 30,000 business entities in Guzhen alone | CCTV report; the entity count and the output value are not on the same basis |
| Total | 6,250 | 100.0% | — | Blue book, cited via a listed company's annual report |
The table is compiled from public data. Output values and concentration measures come from different institutions, and the concentration measures cannot be weighted and combined by output value.
Four reasons can be assigned to upstream concentration. The first is equipment and capital: epitaxial wafer growth depends on metal-organic chemical vapour deposition (MOCVD, Metal-Organic Chemical Vapour Deposition) equipment, and the price per unit together with the investment in supporting facilities determines the minimum economic scale of an epitaxial line; MOCVD equipment from Nanchang High-Tech Zone holds more than 80% of the global market zone-level data. The second is the process window: wavelength consistency, brightness distribution and yield depend on stable control of temperature, gas flow and pressure over long operating runs, and this kind of experience accumulates in the form of process recipes and engineering teams, which the purchase of equipment cannot deliver directly.
The third is customer qualification: for a chip to enter a packaging plant's bill of materials, it must pass brightness binning, wavelength matching, reliability verification and trial batches, and once it is in, the gain from switching suppliers is limited while the verification cost is explicit, so the qualification cycle itself creates stickiness. The fourth is technology generations: in 2024, the top three in Mini LED chips, Sanan Optoelectronics, MTC and HC Semitek, reached a market share of 87% prospectus citation, and a new generation places higher demands on equipment precision, consistency and yield control, so concentration rises another notch at the point of a generational shift.
Economies of scale exist in the packaging tier, but they are weaker than upstream. The main process runs through die expanding, die bonding, wire bonding, dispensing, baking and curing, dicing, colour and brightness sorting, and tape-and-reel packaging process description; a securities firm's estimate puts the equipment value at 28% for the die bonder, 28% for the wire bonder, 20% for the sorting machine, 12% for the tape-and-reel machine, 6% for the dispenser and 4% for the oven brokerage estimate, which is an estimate and shows that investment is concentrated in the first two processes. Barriers to entry in packaging are lower than in epitaxy: equipment can be purchased as a complete line, and the learning curve for process parameters is shorter; the customer base is fragmented, so the loss of a single customer is not fatal. The scale effect shows up in colour and brightness sorting: the narrower the wavelength and brightness distribution within a batch, the easier it is for luminaire makers to control light distribution and colour tolerance, and making the distribution narrow requires more stable processes and more binning equipment. This intermediate level of barriers means that packaging has more companies than upstream and fewer than downstream.
Change in the product mix can be seen from one set of figures. In fine-pitch LED packaging in 2024, surface-mount devices (SMD, Surface Mount Device) accounted for 78.7% and chip-on-board (COB, Chip on Board) for 21.0%, while the average COB price fell by 37.5% year on year. RUNTO Technology definition The 37.5% fall in the average COB price coexists with the share gap to SMD; this report has no share data for the preceding year and therefore cannot determine whether COB's share rose or fell. A price decline usually corresponds to a process spreading from a few manufacturers to more of them, and that diffusion passes price pressure upstream to the chip makers.
Downstream fragmentation has four sources. Fragmented demand is the first layer: general lighting, landscape lighting, displays, backlighting and automotive lighting accounted for 44.1%, 16.6%, 15.6%, 8.2% and 1.5% of the 2024 application mix respectively industry data, and each layer subdivides further by scenario, installation method, colour temperature and power. A wide product range is the second layer: a luminaire consists of a light source, a driver, a heat-dissipation structure, optical parts, a housing and mounting parts, and a specification change in any one of them produces a new bill of materials, so the volume per batch becomes smaller. External economies in the cluster are the third layer: a considerable part of Guzhen's more than 30,000 business entities performs only one process or makes only one component, with moulds, die casting, hardware, spraying, packaging and logistics undertaken by different plants, which lowers the fixed-asset threshold for a single company. The radius of transport and service is the fourth layer: engineering lighting requires on-site measurement, installation guidance and after-sales response, and distributors and engineering contractors are distributed by region, so the size of the regional market determines the number of local suppliers.
The difference in concentration across the three tiers brings three directly observable consequences.
The first consequence is the direction of price transmission. Upstream capacity and prices are decided by a small number of companies; when upstream raises prices, packaging plants and luminaire makers can only choose between cost and orders; when downstream demand falls, competition among luminaire makers passes price pressure back upstream, and the speed depends on upstream capacity utilisation. In 2025 the capacity utilisation rate of the packaging segment exceeded 85%, and more than 60% of companies recorded revenue growth association data; there are no comparable operating-rate data for downstream, so this report makes no comparison of operating levels between midstream and downstream.
The second consequence is where profit sits. The profit margin on revenue of industrial enterprises above designated size across the industry was about 5.1% in 2024 and about 4.3% in January to October 2025; total profit fell by about 7% year on year in 2024 and by 16% year on year in January to October 2025. association data This is an aggregate figure covering mainly enterprises above designated size and cannot be broken down by tier, so it cannot be used to assert that upstream took more profit. What can be established is that the overall profit margin of luminaire and device manufacturing combined fell for two consecutive years.
The third consequence is the division of innovation directions. The upstream innovation metric is lumens per watt and cost per lumen, with a uniform standard of evaluation; the downstream innovation metric is appearance, light distribution, installation method and delivery speed, with standards of evaluation that vary by customer. The two logics run in parallel, and the technical dialogue between upstream and downstream concentrates on a small number of interface parameters: luminous flux, colour temperature, colour rendering index, voltage and current.
One further layer of structure is easily obscured by the manufacturing-side figures. Guzhen's more than 30,000 business entities correspond to fragmentation in manufacturing and wholesale; concentration in end-user channels is a different matter. The share held by national brands, engineering contractors and e-commerce platforms on the sales side determines whether the fragmented manufacturing side faces fragmented or concentrated buyers. There are no public data on this layer, and this report can only point out that it exists.
How concentration will change: this report gives no forecast of years and shares, and describes only three mechanisms. A generational technology shift raises concentration: the top three holding 87% of Mini LED chips shows that a new generation is supplied by a small number of companies during ramp-up, and once the process matures and equipment is localised, entrants will increase and concentration may fall back; whether this cycle repeats depends on the speed of diffusion. Regulation changes the structure of demand: the EU ErP Regulation (EU 2019/2020, ecodesign requirements for light sources and separate control gears) raised the energy efficiency requirements for light sources in two steps in September 2021 and September 2023, with the specific thresholds given in Chapter 34 original EU regulation text; an efficiency threshold excludes low-efficiency products from the market, and companies able to meet it consistently gain share. Channels change manufacturing concentration: as the share of engineering orders and e-commerce orders rises, factories able to take large-volume, short-lead-time orders receive more of them, small-batch factories retreat into niche markets, and the speed depends on how channel structure changes.
Upstream concentration and downstream fragmentation coexist, forming a stable division of labour. Upstream uses scale to make standardised devices cheap, downstream uses flexibility to combine standard parts into differentiated finished luminaires, and the two are conditions for each other. Judging whether this structure will change requires watching three variables: chip capacity utilisation, the packaging product mix, and channel concentration. The first two can be tracked with public data; the third cannot.
Chapter 34 The Boundaries of Technology Substitution and New Scenarios
The completeness of substitution can be measured with output data. In 2024, output of luminaires and lighting apparatus rose by nearly 20% from the previous year and by nearly 80% from the same period of 2019, while output of electric light sources fell by more than 16% year on year. association data In January to October 2025, output of luminaires and lighting apparatus grew by 0.5% year on year and output of electric light sources fell by 9% year on year. association data The two sets of figures point in the same direction: finished luminaires are growing, light sources are contracting.
This direction is the result of LED substitution, and the mechanism has two layers. One is the difference in service life: LED light sources last longer than incandescent and fluorescent lamps, so the annual replacement volume required for the same illuminated area falls, and output of electric light sources therefore contracts. The other is product form: integrated luminaires merge the light source and the luminaire into a single counted unit. The association's public statements give only the direction of change, not a decomposition, so this report cannot determine how much each layer accounts for.
Substitution is already visible in the output structure but is not complete in the export structure. In 2025, LED light sources accounted for about 63% of China's electric light source exports, the incandescent category still accounted for 29%, tungsten halogen lamps for about 4% and fluorescent lamps for about 1%. association data The incandescent category retaining such a share is not inconsistent with the domestic rule, in force since October 2016, prohibiting the import and sale of ordinary incandescent lamps of 15 W and above for general lighting: the prohibition covers only general lighting use at 200 to 250 volts, and reflector-type and special-purpose incandescent lamps are exempt. Products exported to markets with other voltage systems fall outside the voltage scope, and export sales are themselves not subject to the domestic sales prohibition; the original announcement also carries a statement that it will be adjusted in the light of a mid-term review. NDRC announcement
This contrast shows that the boundary of substitution is drawn jointly by three things: the scope of regulation, the service life of installed equipment, and the demand structure of overseas markets. If any one of the three remains unchanged, substitution will not run to completion.
The first threshold of technology substitution is luminous efficacy, that is, lumens per watt (lm/W). Mass-produced emitters in the mainstream reach about 130 to 160 lm/W, and finished luminaires about 100 to 150 lm/W; the highest efficacy published by a leading company for emitters across all categories reaches 255 lm/W, and the International Energy Agency records that the best products worldwide have reached 230 lm/W. industry figures company-published figures International Energy Agency There is a clear loss between emitter and finished luminaire: to achieve 160 lm/W at luminaire level, emitters need to reach 190 to 210 lm/W, the difference consisting of temperature, lens and driver losses. company technical material All of the above are industry figures and company-published figures, not test results under uniform conditions.
The boundary of luminous efficacy lies in consistency in mass production. The laboratory maximum and the mass-production average usually differ by one bin, and luminaire makers purchase by bin, with different bins of the same model priced differently. This is also why the statement of how many lumens an emitter produces is of limited use in procurement: the top bin and the bottom bin in the same datasheet are not the same price.
How large each new scenario is determines its position in the industry. In 2025, the smart lighting market is expected to exceed RMB 50 billion, and the automotive lighting market reaches RMB 85.8 billion. association data The two figures come from the same association report but have different statistical objects: the former is a product category defined by function and the latter a scenario defined by application; the two overlap and cannot be added together.
Smart lighting has three boundaries. Protocols are not unified — Zigbee, Bluetooth Mesh, Wi-Fi and Matter coexist, and luminaires in the same building may come from different protocols; the driver has a shorter life than the light source, so the replacement cycle of the smart module does not match that of the luminaire; retrofitting old buildings is constrained by existing wiring, and wireless solutions solve the control problem but not the power-supply problem. All three lie at the system level, not the light-source level.
The boundary of automotive lighting is market access. Original-equipment supply requires automotive-grade verification and admission as a supplier to vehicle manufacturers, the qualification cycle is long and supply relationships are stable; the aftermarket is fragmented and price competition is intense. The association does not state the statistical scope of the RMB 85.8 billion figure for automotive lighting, and it cannot be compared directly with the 1.5% share of automotive lighting in the 2024 application mix: 1.5% of the RMB 514.2 billion of downstream applications in 2024 is about RMB 7.7 billion, a difference of about 11 times from RMB 85.8 billion. The two have different statistical scopes: the former covers only the automotive part of semiconductor lighting, while the latter may include conventional headlamp assemblies and vehicle OEM supply. This report cites each separately and makes no conversion.
The economics of horticultural lighting are decided by three calculations: crop price, electricity price and luminaire efficiency. Substitution for conventional light sources holds only when the crop price is high, the electricity price is low and luminaire efficiency is high; the values in the three calculations differ widely between leafy and fruiting vegetables, and between greenhouses and plant factories. The 2024 market size was USD 1.317 billion, up 6.8% year on year; the figure comes from TrendForce via a second-hand citation, and the original report was not checked. second-hand citation Growth in market size does not mean that every application category holds.
The boundary of UV LEDs is dose and safety. Sterilisation efficacy depends on the product of wavelength, irradiance and exposure time, and the luminaire is only one part of the system; the human exposure limits for UV-C (short-wave ultraviolet), the safety interlocks of the equipment and the replacement warnings determine which scenarios it can enter. The 2024 market size was about RMB 2.8 billion, up about 23% year on year, on a CSA Research basis cited in a listed company's annual report. annual report citation The boundary of this market is drawn by regulation, not by luminous efficacy.
The boundary of fine-pitch LED packaging is cost and repairability. In fine-pitch LED packaging in 2024, SMD accounted for 78.7% and COB for 21.0%, and the average COB price fell by 37.5% year on year. RUNTO Technology definition COB has advantages in contrast, flatness and reliability, and disadvantages in cost and ease of repair. How the share changes depends on how the advantages and disadvantages compare; this report has no cost comparison data for COB and SMD and does not judge the direction of the share.
From these scenarios, four boundaries of substitution speed can be derived.
The first is total cost of ownership. Procurement decisions compare the sum of luminaire price, installation cost, electricity cost and replacement labour, not lumens per watt. When electricity accounts for a high share of total cost and operating hours are long, the premium for high-efficiency products can be recovered; when operating hours are short, the payback period lengthens and the incentive to substitute falls.
The second is standards and regulations. The EU ErP Regulation raised the energy efficiency threshold for T8 linear fluorescent lamps from 89.7 lm/W to 120.0 lm/W, applicable from September 2023 to 2-foot, 4-foot and 5-foot formats original EU regulation text, and requirements of this kind directly change the list of products that can be sold. Regulation can accelerate substitution and can also delay it: exemption clauses keep part of the product range on the market, and incandescent lamps accounting for 29% of exports are an example.
The third is the installed-base replacement cycle. Luminaire replacement is driven by renovation, retrofitting and failure, not by the launch of new products. The larger the installed base and the longer the service life, the slower the replacement. This is one reason why the growth rates of finished-luminaire output and device output are not synchronised.
The fourth is the economics of the scenario. For a new scenario to move from technically feasible to scale, three conditions must be met at once: affordable, installable and maintainable. Horticultural lighting, UV LEDs and smart lighting differ in their maturity against the three conditions, and their pace of scaling differs accordingly.
The direction of technology substitution is certain in most scenarios; the speed and the boundaries are not. Treating direction as speed makes judgement run ahead of the data.
Chapter 35 The Data Boundaries of This Report
The figures cited in this report come from three types of source: public information from associations and government departments, annual reports of listed companies, and citations in the media and commercial databases. The three types differ in reliability, and this report's approach is to set them side by side, label them and not merge them.
The 2024 industry size has three definitions. In order to obtain the domestic-sales breakdown, this report cites one further set of second-hand data, making four sets of figures in total, all of which are retained; none is selected to the exclusion of the others.
The first set is the association journal's figure of about RMB 580 billion, down about 4% year on year. It comes from China Lighting Appliances, issue 6 of 2025; the original WeChat article was blocked by a verification page, so this report can rely only on the search snippet, and the verification level is C. journal article
The second set is the Dazhaoming Top 100 list's citation of the association's estimate: about RMB 580 billion, down 3.33% year on year, with domestic sales of about RMB 180 billion and exports of about USD 56.1 billion. This set provides the domestic-sales breakdown. Top 100 list citation
The third set is the association's listed-company analysis: RMB 589 billion, down 4.9% year on year; the same article gives domestic sales of about RMB 189 billion, down 10.3% year on year, and total exports of USD 56.3 billion, down 3.3% year on year. This set has verification level A. association article
The fourth set is the blue book's RMB 625 billion, down 5.9% year on year, of which upstream is RMB 32.4 billion, midstream RMB 78.4 billion and downstream RMB 514.2 billion. This set comes from a listed company's annual report citing the blue book; the original blue book was not opened, and the verification level is A (in the sense that the sentence does exist in the annual report), which does not mean that the original blue book has been verified. annual report citation
| Definition and source | 2024 total | Year-on-year change | Domestic sales | Exports |
|---|---|---|---|---|
| Association journal (China Lighting Appliances, issue 6 of 2025, search snippet) | About RMB 580 billion | Down about 4% | Not given | Not given |
| Dazhaoming Top 100 list (citing the association's estimate) | About RMB 580 billion | Down 3.33% | About RMB 180 billion, down 6.25% | About USD 56.1 billion, down 0.3% |
| Association listed-company analysis | About RMB 589 billion | Down 4.9% | About RMB 189 billion, down 10.3% | USD 56.3 billion, down 3.3% |
| Blue book (cited in a listed company's annual report) | RMB 625 billion | Down 5.9% | Not given | Not given |
The table is compiled from public data. The four rows belong to three definition systems and cannot be added together or averaged.
The relationship among the three definitions needs to be explained. The second and third sets both belong to the association system; their totals differ by RMB 9 billion, a relative difference of about 1.6%. Their difference lies mainly in domestic sales: RMB 180 billion against RMB 189 billion, a gap of RMB 9 billion, while exports differ by only USD 200 million, USD 56.1 billion against USD 56.3 billion. Converted at an exchange rate of about 7.1, both sets reconcile roughly with domestic sales plus exports: 5,800 minus 1,800 equals 4,000 (in units of RMB 100 million), which divided by USD 56.1 billion gives 7.13; 5,890 minus 1,890 equals 4,000 (in units of RMB 100 million), which divided by USD 56.3 billion gives 7.10. This cross-check is this report's own calculation and is not stated in the association's original text; it shows that the internal structure of the two definitions is consistent and that the divergence is concentrated in the estimate of domestic sales.
RMB 625 billion is the semiconductor lighting industry's definition, different from the two lighting-appliance definitions above. Adding the three tiers gives exactly RMB 625 billion (324 plus 784 plus 5,142), which shows that it is a definition summed by tier; it is RMB 45 billion higher than RMB 580 billion, or about 7.8% higher in relative terms.
One figure for 2025 cannot be used directly. The association gives the 2025 lighting-appliance industry size as about RMB 580 billion, the same value as 2024's RMB 580 billion. Over the same period exports fell from USD 56.1 billion to USD 49.9 billion, a reduction of about RMB 44 billion at an exchange rate of 7.1. If the two are on the same basis, domestic sales would have to rise by about RMB 44 billion, from RMB 180 billion to RMB 224 billion, an increase of about 24%; this runs in the opposite direction to the same association article's statement that the general lighting market fell by 11% year on year. This report therefore does not use the 2025 figure of RMB 580 billion in any year-on-year or structural calculation, and cites it only as the order of magnitude given by the association. association data
There is one further internal inconsistency in the tier-level figures that needs to be set out. The 2024 three-tier output values are RMB 32.4 billion, RMB 78.4 billion and RMB 514.2 billion; another search snippet gives the year-on-year changes as an increase of about 10% upstream, about 0.2% in packaging and a decrease of about 7.6% in applications; a further search snippet gives the 2023 three-tier output values as RMB 29.5 billion, RMB 78.2 billion and RMB 550.1 billion. Back-calculating 2023 from the year-on-year growth rates gives RMB 29.45 billion, RMB 78.24 billion and RMB 556.49 billion, totalling RMB 664.19 billion; adding the three 2023 tiers directly gives RMB 657.8 billion. The two differ by RMB 6.39 billion, and the gap falls almost entirely in the applications tier (556.49 minus 550.1 equals RMB 6.39 billion). The three sets of figures cannot all hold: either the 2023 application output value comes from a different version, or one of the year-on-year growth rates is wrong. This report cannot determine which, and therefore uses only the 2024 absolute values and structural shares in the main text, and does not use the tier-level year-on-year growth rates.
During the search a statement appeared that the operating revenue of industrial enterprises above designated size in lighting fixture manufacturing was RMB 375 billion in 2024; this report does not adopt it. There are two reasons: the sentence could not be found in the original text of the association or the statistical authority; and the association's public article states that operating revenue was basically flat with the same period of the previous year, giving a direction rather than an absolute value, so RMB 375 billion cannot be cross-checked against that statement. association data This report therefore gives only direction and profit margin, not an absolute value for revenue above designated size.
The data for Zhongshan City come from the industry section of the Zhongshan Yearbook 2025: in 2024, 558 industrial enterprises above designated size achieved a gross output value of RMB 37.5 billion, up 4.7% year on year. This item encountered a certificate error during retrieval, so only the search snippet was obtained and the original page was not opened; the verification level is C. yearbook page When citing it, this report retains the qualification "according to the Zhongshan Yearbook 2025" and does not use it with Guangdong Province's RMB 177.146 billion Guangdong data or with national revenue above designated size to calculate shares. There are two reasons: Zhongshan's RMB 37.5 billion is gross output value while Guangdong's RMB 177.146 billion is operating revenue, and the two indicators cannot be divided directly; and the statistical scopes of the yearbook definition and the association definition are not aligned either.
There is no authoritative definition for LED device output. The only output figures available to this report are of three kinds, all from industry media: output of luminaires and lighting apparatus exceeding 8.2 billion units (2024), output of electric light sources of about 11.6 billion units (2024), and LED module exports of 5.9 billion units (2024) and 9.8 billion units (2025). industry data None of the three is device output: the first two are finished luminaires and light sources, and the third is export volume, while the statistical boundaries of modules and devices differ. For chip output and packaging output there is no national figure that can be traced to an original source. This report therefore does not answer the question of how many LEDs China produces in a year, and does not calculate a matching ratio between devices and finished luminaires.
The original page for the customs definition was not opened. The export figure of RMB 300.116 billion (2024) under HS code 9405 (luminaires and lighting apparatus) that appears in this report comes from a Tonghuashun citation and has verification level C; the boundary between HS 9405 and 8539 (electric light sources) comes from a classification note by the China Council for the Promotion of International Trade, likewise second-hand. classification note The original tariff schedule and the code-adjustment records of the General Administration of Customs were not obtained, and this report therefore does not do two things: it does not convert and compare the RMB figures directly with the association's USD figures, and it does not explain an abnormal growth rate in a given year's export volume entirely as real growth.
The title of "Home of Chinese Lighting" for Yuyao was, according to a local township profile and industry media, conferred by the Ministry of Agriculture in 2001, while another account dates the plaque to 2002; the Ministry of Agriculture's original conferral document was not obtained. township profile When using it in the main text, this report writes it as according to local gazetteers and industry media, and does not present it as established fact. Yuyao also holds the title "China Lighting Manufacturing Base", jointly named in April 2005 by the China National Light Industry Council and the China Association of Lighting Industry, sourced from industry media with verification level C. industry media
Industry data for the first half of 2026 were not obtained. The quota for this round of retrieval was exhausted on 18 October 2026, and the first-half data from the association and from customs were not retrieved. The most recent set of data in this report is the full year 2025 and January to October 2025, and all judgements concerning the most recent period end there.
There are further figures that this report uses but does not treat as industry averages: the cost breakdown of an LED bulb (light source 37.7%, driver 21.7%, structural parts 18.5%) comes from a teardown post on an electronics forum and is a single sample forum teardown post; the share of equipment value in the packaging tier is a securities firm's estimate, not official statistics brokerage estimate; the original text for a peak of about 1,532 packaging companies contradicts itself on the year, and this report does not cite it; the figure of more than RMB 380 billion in revenue above designated size for 2025 gives only a lower bound and cannot be used to calculate year-on-year growth; and the 79 lighting-industry certificates revoked in the 2025 certification validity sampling inspection come from a CNR report, with the original announcement of the State Administration for Market Regulation not opened CNR report.
The Tianxia Gongchang enterprise database contains 107,040 lighting entities, with a combined 3.6895 million insured persons. This figure is on a keyword-match basis: the industry field in the database only goes down to the division level of the Industrial Classification for National Economic Activities, and lighting and LED fall at the group level, so keywords are matched against company names, main products and business scope; this is not a count by industry code. Within the same database, Zhongshan has 8,760, Dongguan 4,283, Bao'an 3,030, Nanhai 1,880, Yuyao 1,538 and Shunde 1,333. These figures cannot be compared directly with the association definitions or the yearbook figures given earlier in this chapter, because the coverage and the statistical unit differ.
This report handles conflicting figures with three fixed rules: where an indicator has several definitions, set them side by side rather than averaging; label the citation level of second-hand figures; and do not use figures that cannot be verified. These three rules lose some information, but they preserve the traceability of every figure in the main text.
Chapter 36 Questions This Report Has Not Resolved
The questions this report has not resolved are arranged from greatest to smallest impact. Each entry states what data are missing and which type of conclusion cannot be established without them.
First, tier-level output and capacity. What is missing is chip output, packaging output, tier-level capacity and historical series of capacity utilisation. Without them, output value cannot be decomposed into price and volume: output value is price multiplied by quantity, and in a period of falling prices a growth rate of output value understates a growth rate of volume; this report has no tier-level price index and therefore cannot judge how much of the 2024 rise in upstream output value and fall in downstream application output value comes from volume and how much from price. All judgements about recovery or shakeout stop at the level of direction.
Second, tier-level profit margins and value added. What is missing is the gross margin, net margin, output value per person and value-added rate of the chip, packaging and application tiers. Without them, it is impossible to answer whether upstream concentration means that upstream took more profit. This report can give only the aggregate profit margin on revenue (5.1% in 2024 and 4.3% in January to October 2025), which is a sample consisting mainly of enterprises above designated size and does not distinguish between tiers. The relationship between concentration and profit margin cannot be verified with the data available in this industry.
Third, the original customs tariff schedule and the code-change records. What is missing is the original tariff texts for HS 9405 and 8539 of the General Administration of Customs, the records of successive code adjustments, and customs statistics at the eight-digit or ten-digit level. Without them, it is impossible to explain how much of the approximately 488% year-on-year increase in LED module export volume in 2024 export bulletin and the further 66% increase in 2025 export data comes from real demand and how much from classification changes; nor is it possible to check the association's USD definition against the customs RMB definition for consistency. In the main text these two growth rates can appear only as the association's definition and cannot be treated as evidence of output growth.
Fourth, the operating data for the first half of 2026. What is missing is output, export value, revenue above designated size and profit for January to June 2026. Without them, it is impossible to judge whether the 11% fall in exports in 2025 and the 23% fall in exports to the United States export data mark a cyclical decline or the beginning of a shift in share. If it is a cyclical decline, recovery should appear in 2026; if it is a shift in share, recovery will not appear. This judgement determines whether the report's conclusions about the export structure still hold, and the available data end in 2025.
Fifth, complete data on Zhongshan City on the above-designated-size basis. What is missing is the original text of the Zhongshan Yearbook 2025 and the breakdown of output value and revenue for above-designated-size lighting enterprises from the Zhongshan Municipal Bureau of Statistics. Without them, Zhongshan cannot be positioned within the above-designated-size definitions of Guangdong Province and of the whole country. The available figures of 558 enterprises and a gross output value of RMB 37.5 billion rest only on a search snippet, and RMB 37.5 billion is gross output value, which is not the same indicator as operating revenue and cannot be divided directly. Zhongshan's national share therefore cannot be calculated.
Sixth, the latest values for lighting electricity consumption and electricity savings. What is missing is total social lighting electricity consumption in recent years, the share of lighting in total social electricity consumption, and estimates of the electricity saved by LED substitution. Without them, the 16% fall in electric light source output cannot be converted into a reduction in electricity consumption. The only shares this report can cite are about 12% in 2011 National Energy Administration data and 13% in 2012 National Energy Administration data; these figures are more than ten years old, and both lighting efficiency and the structure of electricity use have changed, so they cannot be used for current estimates. The macroeconomic effect of higher energy efficiency standards therefore cannot be quantified.
Seventh, concentration at the channel end. What is missing is the share of luminaire product sales held by brands, engineering contractors and e-commerce platforms, and the proportion of ODM versus own-brand sales. Without them, it is impossible to judge whether fragmentation on the manufacturing side is offset by concentration on the channel side. Whether Guzhen's more than 30,000 business entities face fragmented buyers or a small number of large buyers determines the judgement about bargaining power. This report can point out fragmentation on the manufacturing side but cannot infer the bargaining structure of the downstream as a whole.
Eighth, the number of enterprises in the packaging tier. What is missing is a verifiable count of packaging companies and its year-by-year change. Without it, the global top-five share of about 41% can only describe the leaders, and neither a concentration index nor a top-ten share can be calculated. Whether the packaging tier is moderately concentrated or highly fragmented depends on the denominator, and there is no reliable source for the denominator. The figure of a peak of about 1,532 companies found in retrieval is contradicted by the statements for the surrounding years, and this report does not adopt it.
Of these eight items, the first four affect judgements about the industry as a whole, and the last four affect judgements at the level of regions, energy consumption, channels and individual tiers. The order in which data should be filled is: output and price indices first, then tier-level financial data, and finally channel shares. The first two determine whether output value can be split into price and volume, and that is the foundation of every cyclical judgement.
Data Sources and References
The data in this report fall into three categories. The first is the supply-side statistics of the Tianxia Gongchang enterprise database, which are compiled by matching keywords against company names, products and business scope rather than by taking figures by industry code under the Industrial Classification for National Economic Activities; the basis is explained in each chapter, and these data are used only for distribution and structural comparison, not as national totals. The second is government documents, national standards, association statistics and census bulletins. The third is public company disclosures and industry reporting, whose nature is indicated in the text where they are cited. The last verification date for all links is 18 October 2026.
- Tianxia Gongchang industrial platform. The counts of manufacturing entities, insured persons and regional distributions in this report are all taken from the Tianxia Gongchang enterprise database.
The other sources cited in the text are as follows.
- Blue book cited in a listed company's annual report
- Prospectus citing TrendForce and CSA Research
- Industry research report
- GEP Research definition
- Huajing Industry Research Institute definition
- CCTV economic report, 24 November 2024
- Industry material
- China Association of Lighting Industry
- Association data, cited
- RUNTO Technology definition
- Industry media summary
- Phoenix Net Jiangsu
- Phoenix Net Jiangxi
- Economic Daily
- Xiamen Investment Promotion Bureau
- Nanchang Daily article
- Hubei Daily citation
- LEDinside process description
- Government EIA document
- Tianfeng Securities estimate
- Bosidata
- Association data, cited
- Xinhua Finance
- China Media Group International Online
- Second-hand citation
- Teardown sample from an electronics engineering forum
- Standard interpretation
- Tender technical requirements
- Standard interpretation
- China Lighting Network citing an administration notification
- State Administration for Market Regulation notification, issue 24 of 2026
- U.S. Department of Energy
- Industry media
- Company announcement
- Industry material
- Brokerage compilation
- iea.org: IEA
- Industry material
- LM-79 text published by the DOE
- National standards full-text public system
- Standard interpretation
- Standard text
- National standards full-text public system
- Energy Star luminaire specification V2.2 (terminated)
- GB 50034 clauses
- Ministry of Housing and Urban-Rural Development announcement
- Standard interpretation
- cali-light.com: notification
- Association chronology
- Over RMB 100 billion
- Zhongshan Yearbook 2025
- Nanfang News Network
- Jinan Times
- szb.nanhaitoday.com: disclosure
- Investment promotion material
- 21st Century Business Herald
- lightingchina.com.cn: China Lighting Network
- Township profile
- Industry media
- cali-light.com: re-evaluation
- Export bulletin
- Listed-company analysis
- Reprinted association notification
- Tonghuashun citation
- sohu.com: Dazhaoming
- State Administration for Market Regulation
- Announcement No. 28 of 2011
- Reprint on the National Energy Administration website
- National Energy Administration
- The Paper
- National Standards Information Public Service Platform
- Standard information service page
- Testing body regulatory notification
- Standard details
- Standard text
- China Quality Certification Centre
- CNCA catalogue revision announcement
- Reprint by a local regulator
- National Standards Information Public Service Platform
- Economic Daily
- National Standards Information Public Service Platform
- Legal text
- Reprint by a local energy-conservation authority
- National Development and Reform Commission
- Catalogue text
- Original regulatory annex
- Testing body's regulatory interpretation
- Original directive annex
- Compilation of exemption clauses
- Testing body's compliance note
- China Lighting Network
- cnr.cn: CNR
- The company's annual report
- EEPW process description
- U.S. Department of Energy LM-80 note
- TM-21 note
- U.S. Department of Energy definition
- A project document
- Guangming Online article
- mohurd.gov.cn: Ministry of Housing and Urban-Rural Development
- Directive annex
- euttest.com: note
- Chinese second-hand definition
- Journal article
- Classification interpretation
Cover image: © Raimond Spekking / CC BY-SA 4.0 (via Wikimedia Commons) / original file page. Used under the original licence without alteration to the content; only resized proportionally to 2,000 px wide and stripped of metadata.