
Abstract
In January 2026, the Maritime Bureau of Japan's Ministry of Land, Infrastructure, Transport and Tourism (MLIT) issued a document titled Current State of the Shipbuilding Industry and a Roadmap for Its Revitalization. It included a chart of new shipbuilding orders by country, with the statistical basis spelled out plainly: gross tonnage (GT), by contract year. For 2024, the chart showed Japan at 8% and China at 71%. For the same year and the same batch of orders, China Association of the National Shipbuilding Industry (CANSI) put China's share at 74.1%, on a deadweight tonnage (DWT) basis; Clarksons Research put it at about two-thirds, on a compensated gross tonnage (CGT) basis.
Three institutions, the same year, the same batch of new shipbuilding orders — and China's share is about 66.7%, 71%, or 74.1%, depending on which tonnage measure is used. All three figures are correct, because they are not measuring the same thing. And if the indicator is switched from "newly contracted orders" to "completions," China's share for that same year falls to somewhere between 50.3% and 55.7% — that is not another answer to the same question; it is a different question.
This is the problem this article sets out to address. The comparison between Chinese and Japanese manufacturing is one of the most discussed — and most carelessly handled — topics of the past two decades. The carelessness lies not in the conclusions but in the statistical basis. This article does not offer a blanket verdict on "who is stronger" — at the scale of manufacturing as a whole, such a verdict is almost bound to be empty. What it does is lay out verifiable, contemporary data across five lines — shipbuilding, steel, machine tools, equipment, and supporting suppliers — labeling every figure with who measured it, in what unit, and for which year, and then examining what these figures can and cannot support. Any claim for which primary evidence could not be obtained is excluded from the body of the text.
Core Findings
- The lead in aggregate scale is an order-of-magnitude gap that recurs across multiple independent indicators. In 2024, China's manufacturing value added accounted for roughly 27.99% of the global total (calculated in current-dollar terms on a same-year basis), its crude steel output was about 11.9 times Japan's, its exports of machinery and electrical products were about 6.6 times Japan's, and its new installations of industrial robots accounted for 54% of the global total.
- Most of the gap in aggregate scale comes from population size. In 2025, China's per-capita crude steel output was about 683 kilograms, versus about 654 kilograms in Japan — a difference of less than 5%. Treating aggregate output as capability is equivalent to treating population as technology.
- The gap in unit prices widens as one moves up the value chain. For China, the ratio of average import price to average export price is about 2.2 times for steel products, roughly 4 times for bearings, and about 5.5 times for CNC machine tools. The further one moves toward upstream, precision-intensive segments, the larger the price premium the market places on quality differences that are not directly visible.
- Finished assemblies and components are two curves moving at different speeds. Shipbuilding completions have ranked first in the world for sixteen consecutive years, yet the latest official figure for the domestic content ratio of supporting components dates from a decade ago and reads "below 30%"; the domestic share of industrial robots has reached 57%, while the global market for the precision reducers used in the joints of medium- and large-sized robots is still dominated by a single Japanese company.
- Japan's contraction is structural, not across the board. Crude steel output fell out of the world's top three for the first time in 62 years, its share of new shipbuilding orders dropped to 8%, and it no longer builds LNG carriers domestically at all; at the same time, close to eighty percent of its machine tool output is exported, more than eighty percent of its robot shipments go abroad, and more than eighty percent of its corporate researchers are concentrated in manufacturing.
- A procurement demand measured in trillions of yen is now being injected into that shrinking-demand system. On the required-expenses basis, which is comparable across the two programs, FY2023–2027 is 1.57 times the preceding program; on the contract-value basis — the figure that actually reaches companies — it is 2.53 times, roughly 8.7 trillion yen a year, about seven times the annual output value of Japan's entire machine tool industry. It occurred alongside the December 2023 change in the rules governing transfers of that same capacity abroad. This article maintains explicit vigilance toward the revival of militarism and toward remilitarization; the basis for that is the direction of the whole set of moves, not any single figure.
Key Statistical-Basis Notes
Shipbuilding's three tonnage bases (CGT, DWT, and GT) are not interchangeable; all steel figures in this article use the World Steel Association's crude steel basis, since "finished steel product output" includes double-counting across processing stages; for machine tools, output value, apparent consumption, and order value must be kept distinct; cross-country comparisons priced in US dollars carry an exchange-rate component — the average USD/JPY exchange rate rose from 109.80 to 151.48 between 2021 and 2024, a rise of about 38% (equivalently, the same yen amount converts into about 27.5% fewer dollars); Chinese authorities do not publish a total figure for steel production capacity, so all figures from international bodies are estimates; Japan's defense expenditure carries four official statistical bases — required expenses, defense-related expenditure, contract value, and annual expenditure — of which only required expenses is comparable across programs, while what reaches companies is contract value; and the International Federation of Robotics' robot density figure for China moved from 470 to 166 within seventeen months because of a revision to the denominator.
Chapter 1 Getting the Basis Right First: Why Comparisons of Chinese and Japanese Manufacturing Distort So Easily
Let's start with a concrete scene.
In January 2026, the Maritime Bureau of Japan's Ministry of Land, Infrastructure, Transport and Tourism issued a document titled Current State of the Shipbuilding Industry and a Roadmap for Its Revitalization. Page five contains a bar chart showing global new shipbuilding orders by country, with percentage on the vertical axis and year on the horizontal axis. The data is sourced from IHS Markit, and the statistical basis is stated in the chart note: gross tonnage, by contract year. Japan's column shows 14% in 2023, falling to 8% in 2024.
That same year, CANSI released its 2024 industry statistical bulletin, which put China's share of newly contracted orders at 74.1% of the global total, on a deadweight tonnage basis. Clarksons Research, in its annual review published in January 2025, put China's newly contracted orders that year at roughly two-thirds of the global total, on a compensated gross tonnage basis.
Three figures, three institutions, the same year, the same event. China's share comes out as two-thirds, 71%, and 74.1%, respectively. Japan's share is 8% in one document and not listed separately at all in another. Which one is correct? The answer is that all three are — because they are not measuring the same thing at all. Deadweight tonnage measures how much cargo a ship can carry; compensated gross tonnage measures how much labor it takes to build the ship; gross tonnage measures the ship's enclosed volume. A bulk carrier and an LNG carrier may have similar deadweight tonnage, yet the labor hours needed to build them can differ by several times over. Calculated in deadweight tonnage, bulk carriers come out ahead; calculated in compensated gross tonnage, gas carriers come out ahead. How high or low a share looks depends half on real production capacity and half on which ruler you chose to use.
This is the first problem this article sets out to address.
The comparison between Chinese and Japanese manufacturing is one of the most discussed — and most carelessly handled — topics of the past two decades. The carelessness lies not in the conclusions but in the statistical basis. The same set of facts, run through a different unit, a different statistical scope, a different base year, or a different currency, can produce two impressions pointing in exactly opposite directions. And most of the comparisons that circulate widely never spell out these preconditions.
This article is an industry comparison that puts the statistical basis first. We do not intend to offer a blanket verdict on "who is stronger" — at the scale of manufacturing as a whole, such a verdict is almost bound to be empty. What we intend to do is lay out verifiable, contemporary data across five lines — shipbuilding, steel, machine tools, equipment, and supporting suppliers — labeling every figure with which ruler it was measured by, who measured it, and for which year, and then, with the statistical basis made clear, examine what these figures can and cannot support.
Chapter 7 adds a sixth line: Japanese defense procurement. It enters not because the subject demands it but because the statistical basis does — since December 2022, a procurement demand measured in trillions of yen has become an unavoidable component of the demand structure facing Japanese manufacturing, and any account of equipment manufacturing that leaves it out is incomplete. It is handled exactly as the other five lines are: using only official budget clauses and decision texts, and analysing only in industrial terms. This article makes no assessment of fighting power, no comparison of equipment, and no projection of war, not once. But once the facts of budget, contract, and institutional change are laid out, the judgment that follows — vigilance toward the revival of militarism and toward remilitarization — is stated plainly in Chapter 7, rather than being saved for a light touch at the end.
Before proceeding, let us lay down five ground rules. These five rules run through the entire article.
Rule one: physical volume and monetary value must not be conflated. Shipbuilding completions and crude steel output are physical-volume indicators, measured in tonnes; machine tool output value and consumption are monetary indicators, measured in currency. Physical volume tells you how much a country built; monetary value tells you how much what it built is worth. The ratio between the two is precisely what this article keeps returning to — it is what is known as "value added." Conflating the two erases the very question at hand.
Rule two: switching units on the same underlying event can shift the share by more than ten percentage points. Shipbuilding's three tonnage bases have already been discussed. Steel has a similar problem: China's statistical category of "finished steel product output" includes double-counting across multiple processing stages — the same batch of billet, rolled first into hot-rolled coil and then into cold-rolled sheet, gets counted twice — so the finished-product figure is significantly larger than crude steel output. Unless otherwise noted, every steel production figure in this article uses the crude steel basis as defined by the World Steel Association.
Rule three: output value, consumption value, and order value are three different things. This rule is especially critical in the machine tools chapter. Gardner Intelligence publishes output value and consumption figures; the Japan Machine Tool Builders' Association (JMTBA) publishes monthly order intake, i.e., the value of newly booked orders. Between an order and actual delivery lies a production lead time ranging from several months to more than a year — a surge in orders might correspond to deliveries two years later, or it might never materialize at all because of cancellations. Treating order value as output value is the single most common error in machine tool data.
Rule four: cross-country comparisons priced in US dollars carry an exchange-rate component. Since 2022 the yen has depreciated sharply, which means that any Japanese output value, revenue, or export figure denominated in dollars mixes together two components: the change in physical volume and the change in the exchange rate. A Japanese company's dollar-denominated revenue could fall by twenty percent without it having sold a single machine less. Wherever this article uses dollar figures, it tries to also provide the local-currency figure for comparison, and readers should bring this same wariness to any country ranking laid out in dollar terms.
Rule five: some figures simply do not exist, and that absence is itself information. Chinese authorities have never published a national total for steel production capacity; every figure on China's steel capacity comes from an estimate made by an international body. The China Machine Tool & Tool Builders' Association's (CMTBA) economic operations reports have not disclosed, for two consecutive years, the output or domestic content ratio of five-axis machining centers. When an indicator has no primary source available through public channels, the honest approach is to state plainly that it "could not be found," rather than picking whichever figure from secondhand accounts happens to look most agreeable. This article adheres strictly to that rule: any claim for which primary evidence could not be obtained is excluded from the body of the text.
With the ground rules in place, let us begin with the industry where the power of statistical basis is easiest to see.
Chapter 2 Two Base Maps of Aggregate Scale: Manufacturing Value Added and Industrial Categories
2.1 One Table, Four Countries, Three Years
To locate Chinese and Japanese manufacturing on a common scale, the most widely used indicator is manufacturing value added. The World Bank tracks this indicator in current US dollars, under the code NV.IND.MANF.CD. The figures obtained are as follows:
| Country | Manufacturing Value Added | Data Year |
|---|---|---|
| China | approx. $4.65 trillion | 2024 |
| China | approx. $4.82 trillion | 2025 (preliminary) |
| United States | approx. $2.50 trillion | 2021 |
| Germany | approx. $843.7 billion | 2024 |
| Japan | approx. $788.5 billion | 2024 |
| World | approx. $16.62 trillion | 2024 |
| World | approx. $17.60 trillion | 2025 (preliminary) |
The first thing worth noting is not the figures themselves but that bolded year. The most recent year available for the United States is 2021 — the World Bank's series for the US has long lagged in updates, because US authorities report figures under their own industry classification system, which does not fully correspond to the UN's International Standard Industrial Classification. In other words, any tidy-looking "ranking of manufacturing value added by country" that includes the United States is, by necessity, mixing different years.
This article therefore performs its calculations only on a same-year basis. On a consistent 2024 basis: China accounts for 27.99% of the global total, Germany 5.08%, and Japan 4.74%. The United States cannot be included in this same-basis calculation. This methodological limitation must be stated here, not buried.
The second thing concerns a widely circulated claim: that China's manufacturing value added accounts for about 30% of the global total.
This statement has a clear source. On July 5, 2024, Jin Zhuanglong, Minister of Industry and Information Technology, stated at a dedicated press conference held by the State Council Information Office that manufacturing value added accounted for 26.2% of GDP and about 30% of the global total. This is the official figure, not something circulating informally.
But calculated independently on the current-dollar basis above, the 2024 figure is 27.99% — it does not reach 30 percent. The two figures differ by about two percentage points.
Where does the difference come from? It may be the gap between constant prices and current prices (calculating output shares at constant prices typically yields a higher share for China), or it may be that "industrial value added" and strictly defined "manufacturing value added" are not the same statistical object. We made repeated attempts to verify the original calculation method directly on UNIDO's statistics portal, and access was blocked each time, so the exact cause of the discrepancy has not been verified.
This article's approach is to state both figures, note each one's statistical basis and source, and make no attempt to reconcile them. A gap of two percentage points is immaterial at this scale, but it is a useful reminder — "about 30%" and "27.99%" are both correct; they were simply calculated by different methods. The more widely a figure circulates, the more worth it is to go back and check its denominator.
2.2 Share of the Domestic Economy: A Counterintuitive Comparison
The same World Bank dataset contains another indicator: manufacturing value added as a share of GDP.
- China: 24.84% in 2024; 24.73% (preliminary) in 2025
- Japan: 18.82% in 2024
- Germany: 18.01% in 2024; 17.61% (preliminary) in 2025
Japan's 18.82% and Germany's 18.01% are nearly identical; China's figure is roughly six percentage points higher than both.
These figures are easily misread as meaning "China's economy is more dependent on manufacturing." The more accurate statement is that China's services sector still accounts for a smaller share of value added than mature economies, and its manufacturing share is correspondingly high — the two are two sides of the same coin. Japan's manufacturing value added accounts for less than a fifth of its economy, yet that less-than-a-fifth supports an export structure that still ranks among the world's best — and this is precisely the question the later chapters of this article keep coming back to: a small share does not mean weak capability, and a large share does not mean strong capability.
Incidentally, Japan's own Statistics Bureau, Ministry of Internal Affairs and Communications, states that manufacturing value added as a share of nominal GDP has "held at roughly around 20% in recent years," a magnitude consistent with the World Bank's 18.82%, with the difference attributable to accounting basis and year.
2.3 Category Completeness: A Claim Used Too Casually
Another widely circulated claim about Chinese manufacturing is that China possesses every industrial category in the UN industrial classification system — 41 major industrial categories, 207 medium categories, and 666 minor categories — and is the only country in the world to have done so.
This statement also has a source, and it can be traced to two specific occasions. On September 20, 2019, Miao Wei, then Minister of Industry and Information Technology, said at a dedicated press conference held by the State Council Information Office: "At present, our country already possesses 41 major industrial categories, 207 medium categories, and 666 minor categories, forming an independent and complete modern industrial system — the only country in the world to possess every industrial category in the UN industrial classification system." On July 5, 2024, Jin Zhuanglong, Minister of Industry and Information Technology, reiterated the same set of figures at another press conference.
The source hierarchy needs to be spelled out: we verified the two statements above through reposts by national-level media outlets; the original transcript page on the State Council Information Office's website encountered a certificate error during this round of access and could not be opened directly for a word-for-word comparison. This article therefore states that these are "statements made by officials at press conferences, as reposted by national-level media," rather than "the original text of an official document."
This section then offers a methodological reminder: the concept of "category completeness" is itself a yes-or-no judgment, not a matter of degree. It speaks to whether something exists, not to how good it is. A country having at least one producing enterprise in every one of the 666 minor categories is an entirely different matter from that country ranking among the world's best in every one of those 666 categories. The chapters ahead will repeatedly show that China ranks near the top in aggregate scale for shipbuilding, steel, machine tools, and equipment, while the picture at the high end of the same industries is far more complicated.
"Category completeness" is a real and important structural advantage — it means that most components can be sourced domestically, and that when one link in an industrial chain breaks, an alternative path exists. But it cannot be treated as proof of capability. What it proves is breadth, not depth. Most of the rest of this article is, in essence, about depth.
2.4 A Total That Can Be Compared Directly: Machinery Exports
Manufacturing value added is riddled with statistical-basis problems; machinery export value is comparatively clean — it is tracked by customs authorities under a unified commodity code, and both China and Japan report under the same coding system.
According to UN Comtrade data for 2024 (on an FOB basis):
| Country | Machinery (HS Chapter 84) | Electrical Machinery (HS Chapter 85) | Total |
|---|---|---|---|
| China | approx. $568.1 billion | approx. $927.1 billion | approx. $1.495 trillion |
| United States | approx. $252.4 billion | approx. $213.9 billion | approx. $466.3 billion |
| Japan | approx. $125.7 billion | approx. $101.1 billion | approx. $226.8 billion |
China's exports of machinery and electrical products were about 6.6 times Japan's, and 3.2 times the United States'.
Two qualifications. First, this is export value, not output value — a country can produce a great deal while exporting comparatively little (China's machine tool export ratio of only around 30%, discussed in Chapter 5, is an example). Second, we did not obtain a world total to use as a denominator, so no global share can be given; UN Comtrade's public interface does not directly provide a global aggregate, which would require summing across all reporting countries — a step not performed in this round.
Even so, this factor of 6.6 times, set alongside the 11.9-times crude steel output figure in Chapter 4, the shipbuilding shares in Chapter 3, and the 3.5-times machine tool output value figure in Chapter 5, forms a set of mutually reinforcing magnitudes. At the level of aggregate scale, the picture is essentially clear: China's scale represents an order-of-magnitude lead, and this lead recurs across multiple independent indicators.
The six chapters that follow deal entirely with questions that lie beyond aggregate scale.
Chapter 3 Shipbuilding: The Few Percentage Points Between Compensated Gross Tonnage and Deadweight Tonnage
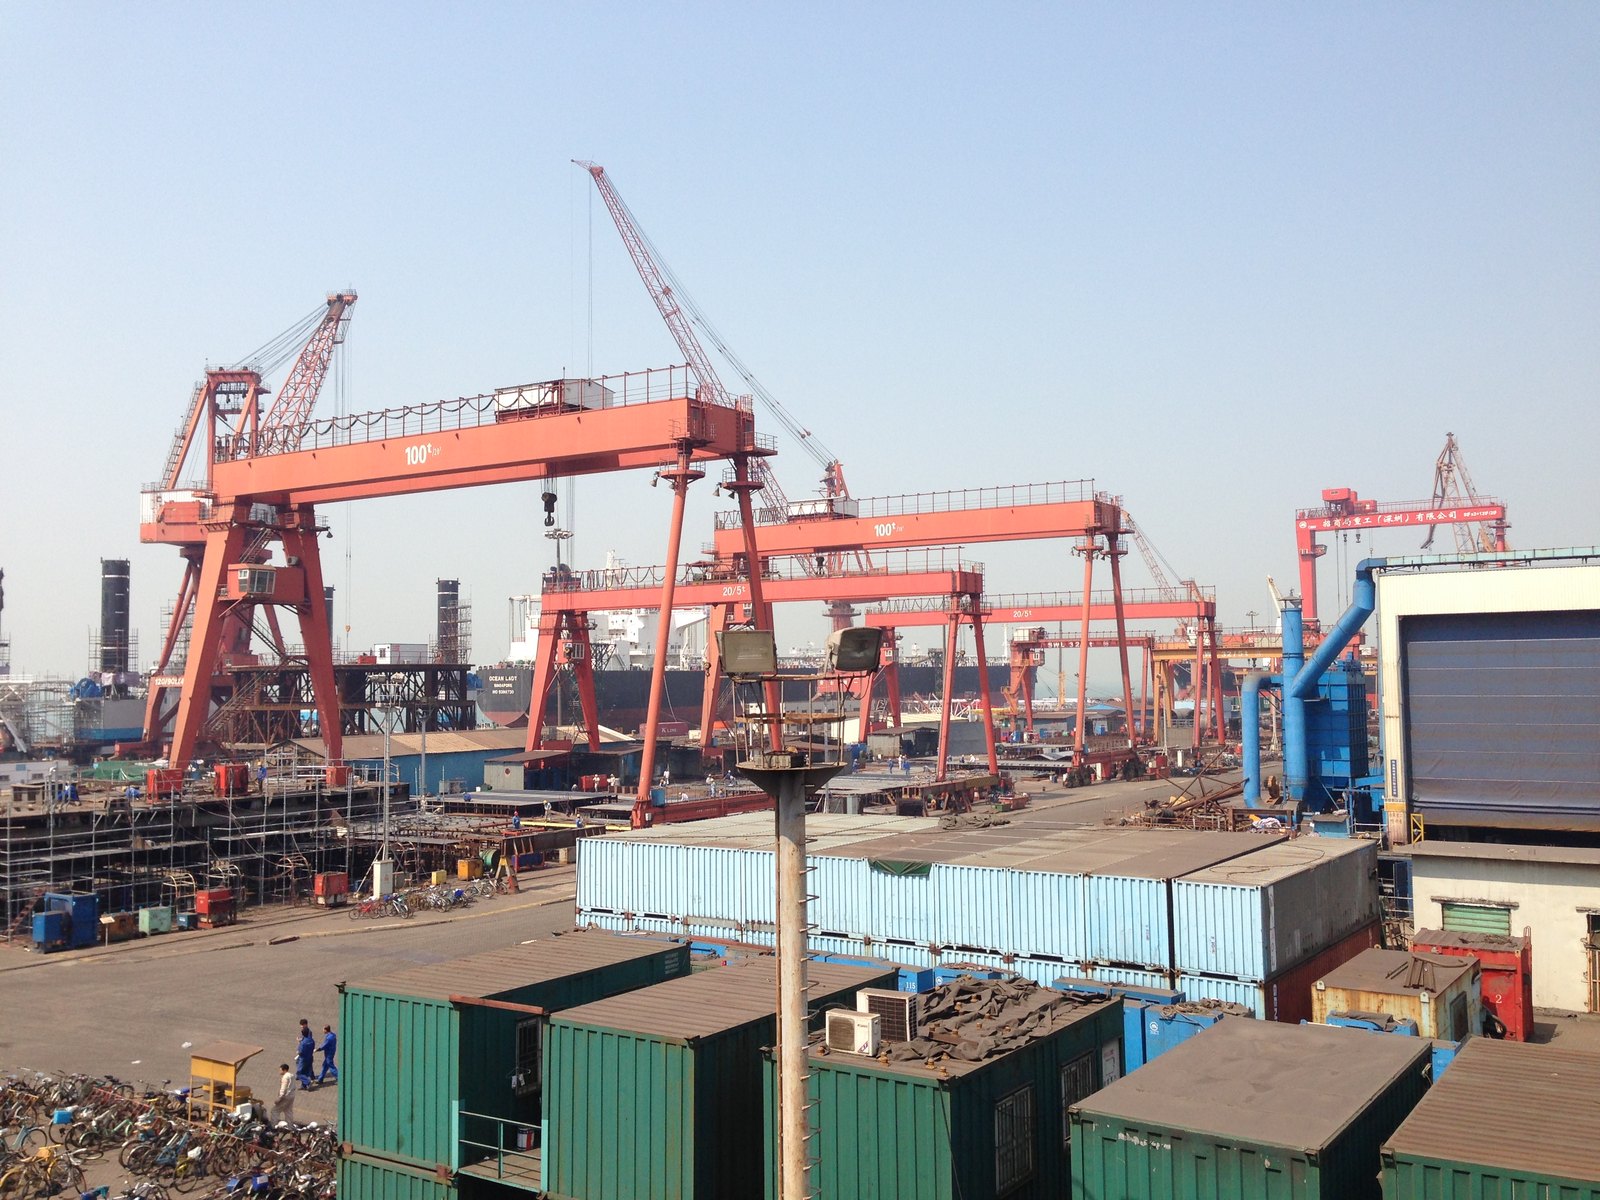
Let us first fill in the rest of the figures from the scene that opened Chapter 1.
In 2024, China's global share of shipbuilding completions, under different statistical bases, was as follows:
| Statistical Basis | China's Share | Source |
|---|---|---|
| Completions · CGT | 53% (alternate figure: 51.99%) | Clarksons Research, 2024 Global Shipbuilding Review; the 51.99% figure is cited from the Clarksons database by Shanghai Jiao Tong University's China Shipbuilding & Offshore Engineering Industry Research Center |
| Completions · DWT | 55.7% | CANSI |
| Completions · CGT (CANSI's own figure) | 50.3% | Same CANSI bulletin |
| Construction Volume · GT | approx. 50% | Maritime Bureau of Japan's MLIT, citing IHS Markit |
First, within the completions column alone: from 50.3% to 55.7%, a spread of 5.4 percentage points.
Now for newly contracted orders in the same year: about two-thirds (roughly 66.7%) on a CGT basis, 71% on a GT/contract-year basis, and 74.1% on a DWT basis. The spread within that column is 7.4 percentage points.
Put the two columns together and, for the same country in the same year, the word "share" can land anywhere between 50.3% and 74.1% — a spread of 23.8 percentage points. But this has to be said at once: of those 23.8 points, only 7.4 come from the choice of tonnage unit. All the rest comes from the fact that "completions" and "newly contracted orders" are two different indicators to begin with — one measures how many ships were handed over this year, the other how many were signed for this year. Mixing the two when discussing "China's shipbuilding share" is a worse error than picking the wrong tonnage unit, and a more common one.
Interestingly, within the same bulletin, CANSI's own CGT share figure (50.3%) is even lower than the figure given by Clarksons (53%). This is not a case of anyone overstating anything; rather, the conversion coefficients used to calculate compensated gross tonnage come in multiple versions, and different institutions use coefficient tables that do not fully agree with one another.
Even more telling is the year-over-year direction. China's newly contracted orders in 2025 fell 4.6% year-on-year on CANSI's deadweight tonnage basis, but fell 35% year-on-year on Clarksons' compensated gross tonnage basis. The direction agrees, but the magnitude differs by a factor of nearly eight. The reason lies in the ship-type mix: that year, China won orders for bulk carriers and tankers with large deadweight tonnage but low CGT coefficients, while orders for higher-coefficient ship types fell relatively — so deadweight tonnage appeared to dip only slightly, while compensated gross tonnage appeared to fall off a cliff.
So any shipbuilding share figure that does not state its statistical basis need not be taken seriously.
3.2 Absolute Figures: The China Side
Setting shares aside, let us look at absolute volumes. CANSI publishes year-by-year primary statistics:
- 2024 completions: 48.18 million DWT, up 13.8% year-on-year
- 2025 completions: 53.69 million DWT, up 11.4% year-on-year, accounting for 56.1% of the global total
- 2025 completions on a CGT basis: 23.01 million CGT, surpassing the previous record high of 22.86 million CGT set in 2011
- H1 2026 completions: 36.50 million DWT, up 51.2% year-on-year
The last two of these points are worth pausing on. 2011 marked the peak of the previous upcycle in China's shipbuilding industry, after which it went through years of capacity clearing, with a large number of shipyards closing, merging, or converting to other business. The 23.01 million CGT figure for 2025 means it took China's shipbuilding industry fourteen years to push delivery volume back up past the high point of the previous cycle. Those fourteen years in between were not linear growth but a rebuilding after a deep adjustment. Compressing this process into a narrative of "Chinese shipbuilding marching triumphantly onward" would leave out the most important part.
The figures on the order side are even steeper. In H1 2026, China's newly contracted orders reached 121.06 million DWT, up 173.1% year-on-year — a single half-year that already exceeded the peak of any full historical year. On Clarksons' compensated gross tonnage basis, global new orders in the same period totaled 42.95 million CGT, of which China accounted for 31.00 million CGT, a 72% share, and South Korea accounted for 7.97 million CGT, a 19% share.
There is another structural figure: export vessels accounted for 89.5% of China's newly contracted orders in 2025, and 93.2% of its year-end order backlog. In other words, more than ninety percent of the work in Chinese shipyards' hands is being built for foreign shipowners. This figure says more than any share percentage about how deeply China's shipbuilding industry has become embedded in the global shipping procurement system — this is not scale propped up by domestic demand.
On CANSI's own account, China's global market share across the "three major indicators" of shipbuilding has held the world's leading position for "16 consecutive years" as of 2025, with the starting year being 2010.
3.3 Absolute Figures: The Japan Side, and a Table That Should Not Be Averaged Away
The best source for data on the Japan side is that same January 2026 document from Japan's Maritime Bureau of the MLIT itself. Citing IHS Markit on a gross-tonnage, contract-year basis, it gives the year-by-year share of newly contracted orders since 2017:
| Year | Japan | China | South Korea | Europe |
|---|---|---|---|---|
| 2017 | 19% | 30% | 32% | 5% |
| 2018 | 21% | 22% | 44% | 3% |
| 2019 | 19% | 32% | 35% | 4% |
| 2020 | 16% | 47% | 27% | 2% |
| 2021 | 16% | 44% | 36% | 1% |
| 2022 | 18% | 44% | 30% | 1% |
| 2023 | 14% | 63% | 15% | 2% |
| 2024 | 8% | 71% | 14% | 2% |
Japan's own document states it directly: Japan's share had previously held between 15% and 16%, before falling to 8% in 2024.
The place where this table is most easily misread is treating it as a smooth downward curve. It is not. Over the six years from 2017 to 2022, Japan's share oscillated between 16% and 21% with no clear trend; the real break came in 2023 and 2024, falling from 18% to 14% and then to 8% — more than half wiped out in two years. Over the same period, South Korea's share also fell from 30% to 14%. In other words, the share China ate up around 2023 was taken from Japan and South Korea simultaneously, and taken at a pace far faster than in the preceding decade.
On the magnitude of the decline in Japan's output itself, there are three figures from three different institutions on three different bases; they cannot substitute for one another and can only be set side by side:
- CGT basis: the peak of about 10 million CGT occurred between 2008 and 2010; by 2022 it had fallen to about 5 million CGT, a decline of roughly fifty percent. Source: the OECD's Peer Review of the Japanese Shipbuilding Industry, published in 2026, built on Clarksons Research's 2025 database.
- GT basis: about 16 million GT in 2019, falling to about 9.07 million GT in 2024, a five-year decline of roughly 43%. Source: Japan's Maritime Bureau of the MLIT.
- DWT basis: 24.60 million DWT in 2019, falling to 15.54 million DWT in 2025, a decline of 36.8%. Source: BRS Shipbrokers' 2026 annual review.
All three figures describe the same thing and all point toward contraction, but the magnitude ranges from 36% to 50%, and the start and end years differ across all three. Any attempt to average them into a single conclusion — "Japan's shipbuilding industry has shrunk by about forty percent" — manufactures a precision that does not actually exist.
There is one more statistical-basis trap worth flagging on its own. A common claim is that Japan's shipbuilding share "fell from 28% at the turn of the century to 11% today." But these two figures are not the same indicator: 28% is a share of construction capacity around the year 2000, while 11% is a share of completions in 2024. Capacity share describes the theoretical output ceiling of docks and facilities; completions share describes actual deliveries. The two concepts are different, and subtracting one from the other is meaningless. All that can be said is the direction: Japan's position has fallen from just over a quarter at the turn of the century to roughly a tenth today.
3.4 Ship Types: A Blank Cell
Beyond how much capacity exists, there is a harder indicator still — whether a thing can be built at all.
When discussing "ship types related to energy policy," that document from Japan's Maritime Bureau of the MLIT singles out LNG carriers as a strategic category and states, in a single line: currently, none are built domestically.
A country that once held the world's top position in shipbuilding, and remains the world's third-largest shipbuilding nation today, has zero domestic capacity in LNG carriers — the ship type with the highest technical barrier and the highest per-vessel value in contemporary shipbuilding. This is a sentence Japan's own responsible authority wrote in a policy document, not an outside commentary.
This fact says more about the layers embedded in the word "capacity" than any share percentage could. A contraction in aggregate volume is one thing; a wholesale exit from a high-end category is another. The former can be repaired by a cyclical rebound; once the latter breaks the chain of people and process knowledge, the cost of rebuilding it rises by an order of magnitude.
For the specific shares held by China and South Korea in LNG carriers, we were unable to obtain a citable primary-source table, so this article does not give a percentage. But the figures for several other ship types are clear:
- Containership order backlog: China holds 72% (end of 2024, on an 8.30 million TEU basis) or 74% (November 2025, on a 7.40 million TEU basis). Two different points in time on two different bases — they can only be set side by side.
- Bulk carrier order backlog: China holds 68%, or 937 of 1,375 vessels.
- Car carriers (RoRo vessels): China holds more than 85% (2021–2022 orders, per DNV citing Clarksons data) or approximately 79.4% (2023–2028 delivery window). The two windows differ and cannot be compared for a rise or fall.
The bulk carrier line is especially worth discussing. Bulk carriers have long been Japan's traditional home turf in shipbuilding — mature technology, standardized ship types, high production volumes. Japan's annual bulk carrier order volume averaged about 174 vessels from 2020 to 2024, then fell to 94 in 2025 — about 46% below that five-year average (note that this is measured against the five-year average, not against 2024 alone); and of those 94 vessels, small and mid-sized ships of 25,000 to 68,000 DWT accounted for 71%. Over the same period, Japan's bulk carrier exports fell a cumulative 63% on a CGT basis between 2010 and 2023. A country seeing order volume fall to nearly half its five-year average, ship types shrinking, and exports halved in the standard ship type it is best at — this is not a case of being left behind in a high-end category, but of being squeezed on its own home ground.
3.5 Cost: A Cost Table from Japan's Own Authorities
The hardest data to obtain in any comparison of industrial capability is cost data, because it touches on commercial secrets. Japan's MLIT document happens to contain one such table, and it directly compares China and Japan.
Taking a 40,000-DWT-class bulk carrier as an example, with Japan's construction cost indexed at 100, the cost structure of the two countries is as follows:
| Cost Item | Japan | China |
|---|---|---|
| Steel | 30 | 16 |
| Other materials | 40 | 32 |
| Labor | 20 | 23 |
| Other expenses | 10 | 10 |
| Total | 100 | approx. 81 |
Japan's own authorities conclude that a gap of roughly twenty percent exists between the two countries' shipbuilding costs.
This table conceals a counterintuitive detail worth pulling out on its own. The part where China is cheaper than Japan comes mainly from steel — China's steel cost is only about 53% of Japan's, opening up a 14-point gap on that item alone. On labor, however, China is at 23 and Japan at 20 — China is more expensive than Japan.
The typical first reaction to imagining the cost gap between Chinese and Japanese manufacturing is to think of labor. This table says the exact opposite: in this specific category of 40,000-DWT bulk carriers, China's cost advantage comes from the scale effects and price levels of steel, an upstream industry, rather than from cheap labor; on the labor line, China no longer holds a cost advantage at all.
Two qualifications need to be added immediately. First, this table covers only the single ship type of 40,000-DWT-class bulk carriers and cannot be generalized to all ship types; the material and labor-hour structures differ greatly across ship types. Second, the document itself does not clarify whether the labor cost figure is defined consistently between the two countries — for instance, whether it includes labor from subcontracted firms. But even discounting for these caveats, the directional judgment that "China's shipbuilding cost advantage comes mainly from upstream steel rather than from labor" is still what this table supports.
3.6 People: A Curve That Has Stopped Falling
Japan's Maritime Bureau of the MLIT conducts a year-by-year survey of shipbuilding industry employment, counting the number of registered personnel as of April 1 each year, covering office staff, skilled workers directly employed by shipyards, workers from subcontracted firms, and — separately tabulated since 2015 — foreign labor. This is the complete time series:
| Year | Employment |
|---|---|
| 2006 | 79,804 |
| 2010 | 85,045 |
| 2016 | 91,264 |
| 2020 | 83,517 |
| 2022 | 68,464 |
| 2023 | 72,596 |
| 2024 | 74,372 |
| 2025 | 76,807 |
The 91,264 in 2016 is the high point of this series, and the 68,464 in 2022 is the low point — a drop of roughly a quarter over six years. It has since recovered to 76,807 over the following three years.
But the composition of that recovery matters a great deal. Of the 76,807 workers in 2025, 14,874 were office staff, 31,940 were skilled workers directly employed by shipyards, 15,466 were workers from subcontracted firms, and 14,527 were foreign labor. Foreign labor accounts for nearly a fifth of the total. Japan's own authorities state the conclusion directly in the document: the number of Japanese-national workers has continued to decline over the medium term, and it is the recent recovery in foreign labor that has stopped the total headcount from falling further.
In other words, the upward curve from 68,000 back to 77,000 is not, for the most part, young Japanese workers returning to the shipyards — it is foreign technical intern trainees and holders of Specified Skilled Worker visas filling the gap. Japan's shipbuilding labor problem has therefore not been "solved"; it has simply continued to exist in a different form.
For the total number of workers employed in China's shipbuilding industry, we were unable to obtain a citable primary-source figure, so this article does not attempt a per-worker output comparison between China and Japan. This is a clearly identified data gap, and one we do not intend to fill with an estimate.
3.7 Supporting Components: Two Different Ninety Percents
The real depth of a shipbuilding industry lies not in the final-assembly yard but in its supporting components. A single ship contains a main engine, generator sets, a propeller, a steering gear, an anchor windlass, navigation and communication equipment, a ballast water treatment system, and hundreds or even thousands of other systems; the final-assembly yard is responsible for putting them all together. Whether a country can supply these components itself determines whether its shipbuilding industry truly belongs to it.
The figure on the Japan side is: a domestic procurement rate for components of 95%, meaning 95% of parts are sourced domestically and 5% from overseas, with the data based on actual 2023 figures, from a survey by Japan's MLIT.
It must be stated immediately that, on the same page of the same document, another diagram labels the shipbuilding industry as having "approximately 70% domestic procurement." The document itself does not explain the relationship between the two figures. Our guess is that they cover different statistical scopes — one a precise count of components, the other a rough label of industrial-chain relationships — but since the document does not clarify this, this article sets the two figures side by side without arbitrarily choosing between them or reconciling them. This is itself a matter of statistical-basis discipline: presenting a contradiction within a primary source honestly is more responsible than smoothing it over on the source's behalf.
The situation on the China side is more complicated, and the most recent figures are missing. What can be confirmed is:
- Around 2015, the MIIT's own figures put the domestic content ratio for supporting equipment on China's high-tech ships and marine engineering equipment at below 30%; within that, categories such as marine propulsion systems, deck machinery, and marine outfitting parts exceeded 50%, while the remaining categories were generally lower.
- The MIIT's Action Plan for Upgrading the Marine Equipment Supporting Industry (2016–2020) set a target of raising the average installation rate of domestically produced marine equipment on high-tech ships to above 60%, and the domestic supply rate of key components for marine equipment to 80%.
- For the actual achievement of these two targets after 2020, we could not locate any updated official disclosure.
This gap is itself worth noting. A major shipbuilding power that has ranked first in the world for sixteen consecutive years across the three indicators of completions, newly contracted orders, and order backlog has, as its latest official figure for domestic content in supporting components, a "below 30%" reading from a decade ago and a target that expired in 2020. What happened in between, and how much was achieved, cannot be found through public channels. This article does not speculate.
There is one more easily confused figure that needs to be unpacked here. CANSI's 2025 bulletin contains this line: newly signed orders for marine equipment totaled 113 vessels (units), worth $10.5 billion, a 44.6% global share. This 44.6% is the share of orders won by Chinese marine equipment manufacturers on the global market — it measures how much China's marine equipment industry sold abroad. It is the opposite question from "how much of the equipment on ships built in China is domestically made." One is export capability; the other is the degree of self-sufficiency. Citing the former as if it were the latter produces an entirely wrong conclusion.
On the China side, quite a few supporting-component manufacturers can be found. Marine main-engine makers such as Dalian Marine Diesel and Yichang Marine Diesel Engine, an in-group supporting entity such as Hudong-Zhonghua Marine Equipment, plus a large number of small and mid-sized marine equipment enterprises scattered along the coasts of Jiangsu, Shandong, and Liaoning, together form a supply layer of considerable scale. A considerable scale and a high self-sufficiency rate are not the same thing — and it is precisely the self-sufficiency figure that the authorities have stopped disclosing.
3.8 Consolidation Amid Contraction
Finally, a few facts — dates only, no narrative.
On January 1, 2021, Japan's two largest shipbuilders established a joint venture, Nihon Shipyard, with Imabari Shipbuilding holding 51% and Japan Marine United (JMU) holding 49%; its scope of business explicitly excludes LNG carriers. On June 26, 2025, Imabari Shipbuilding agreed to raise its stake in JMU from 30% to 60%; the transaction closed on January 5, 2026, making JMU a subsidiary of Imabari Shipbuilding. On April 30, 2025, Mitsui E&S transferred all of its remaining shares in its shipbuilding subsidiary to Tsuneishi Shipbuilding, exiting the merchant-ship design and construction business entirely. Earlier still, in May 2014, Namura Shipbuilding acquired Sasebo Heavy Industries as a wholly owned subsidiary through a share exchange.
Taken together, these events show that Japan's shipbuilding industry has moved in a single direction over the past five years: mergers, exits, consolidation. This is a standard response for an industry in a period of shrinking demand — reducing the number of players to keep the survivors' order books full. It is at once evidence of contraction and a response to it. As for whether this approach is working, the "first-ever breakthrough" order figure in H1 2026 belongs to China; there is no comparable-magnitude figure to cite on the Japan side.
The comparison on the China side takes a different form. Within the China State Shipbuilding Corporation (CSSC) system, yards such as Shanghai Waigaoqiao Shipbuilding, Dalian Shipbuilding Industry, Guangzhou Shipyard International, and Qingdao Beihai Shipbuilding coexist with yards outside that system, such as Yangzijiang Shipbuilding, New Times Shipbuilding, China Merchants Heavy Industry, and Nantong COSCO KHI Ship Engineering — a mix of large-group consolidation alongside private and joint-venture yards each taking their own orders. Consolidation and fragmentation existing side by side is a structure only an order-rich period can afford.
Chapter 4 Steel: A Hundred-Million-Tonne Problem Is Not a Billion-Tonne Problem
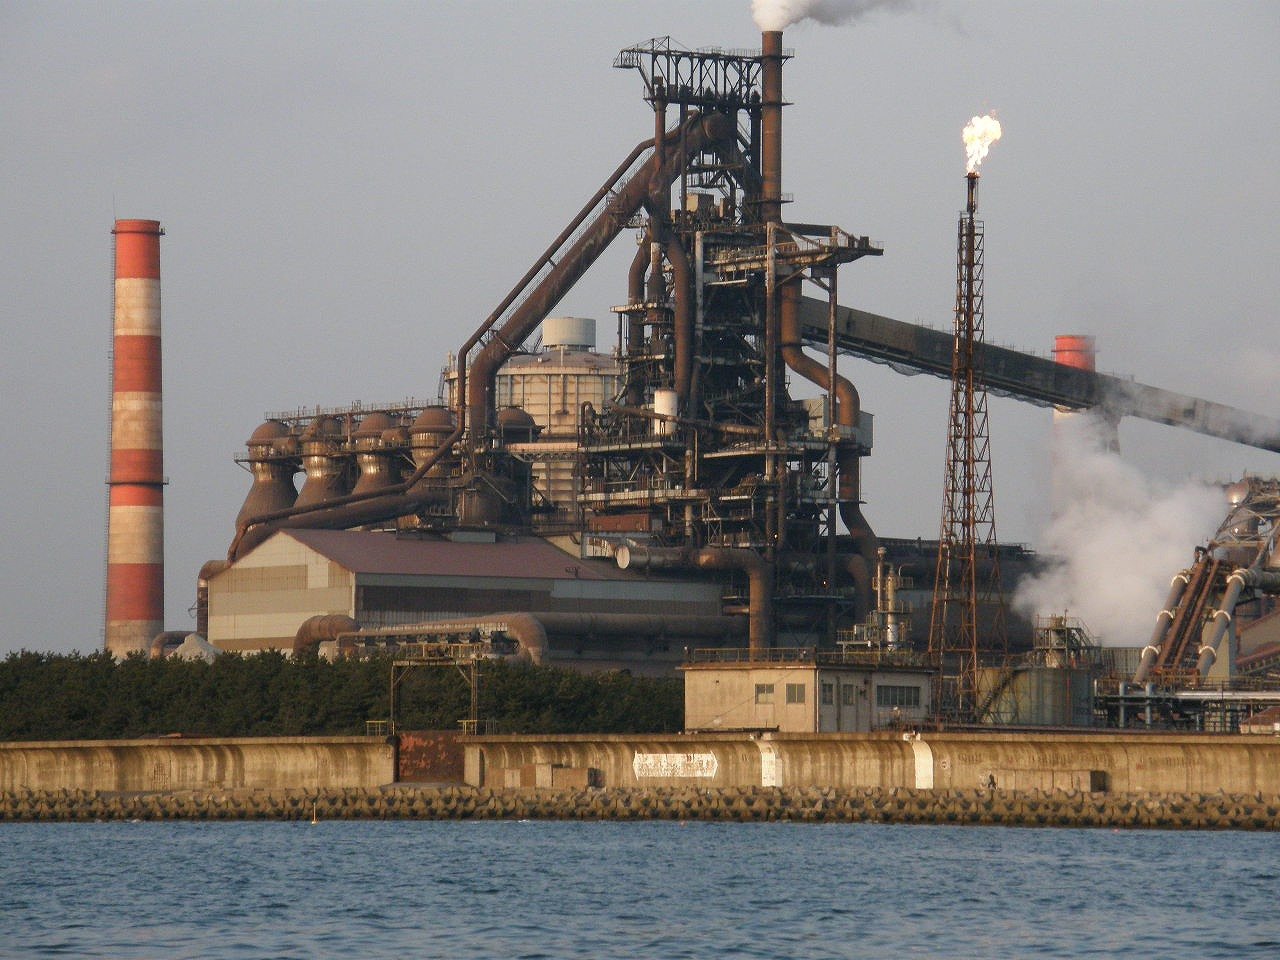
In January 2026, the World Steel Association released global crude steel production statistics for 2025. The figures were as follows:
| Indicator | China | Japan | Global |
|---|---|---|---|
| 2024 crude steel output | 1,005.1 million tonnes | 84.0 million tonnes | 1,886.8 million tonnes |
| 2025 crude steel output | 960.8 million tonnes | 80.7 million tonnes | 1,849.4 million tonnes |
| 2025 year-on-year | -4.4% | -4.0% | — |
| 2025 share of global | 52.0% | 4.4% | — |
| 2025 world ranking | 1 | 4 | — |
Two points on statistical basis first. First, "crude steel" is output at the steelmaking stage, which is not the same thing as "finished steel product output" in Chinese statistics — the latter includes duplicate counting across multiple processing stages and is noticeably larger. This article uses the crude steel statistical basis throughout. Second, the World Steel Association's own two publications give slightly different global totals — 1,849.4 million tonnes on the press-release basis, 1,848.9 million tonnes on the yearbook basis — this is the routine revision gap between preliminary and finalized figures, not a substantive conflict.
What truly deserves attention is Japan's "No. 4" ranking. In 2025, the United States, at 82.0 million tonnes (up 3.1% year-on-year), overtook Japan's 80.7 million tonnes (down 4.0% year-on-year); Japan fell out of the world's top three for the first time in 62 years, having last ranked fourth in 1963. According to the Nikkan Tekko Shimbun (Iron & Steel Daily News), 2025 marked Japan's lowest production level in 57 years, since 1968.
That same year, China's output also declined, and by a slightly larger margin (4.4%) than Japan's (4.0%). But these are not the same kind of decline.
Japan's decline is the continuation of a long-term trend. Japan's crude steel output peaked historically at 119.32 million tonnes in 1973, then 117.13 million tonnes the following year; it was still holding above 110 million tonnes at the start of this century, at 112.47 million tonnes in 2005 — the sixth consecutive year above the 100-million-tonne mark. From 112 million tonnes down to 80.67 million tonnes is a drop of about 28%, and it has been a sustained, one-directional decline over two decades.
Year by year, the line runs like this: 99.3 million tonnes in 2019, a one-off plunge to 83.2 million tonnes in 2020 because of the pandemic, a rebound to 96.3 million tonnes in 2021, then 89.2 million tonnes in 2022, 87.0 million tonnes in 2023, 84.0 million tonnes in 2024, and 80.7 million tonnes in 2025.
It would be easy at this point to write "2019 was the first year Japan fell below 100 million tonnes." But the sentence in the preceding paragraph — that 2005 was the sixth consecutive year above the 100-million-tonne mark — read in reverse means that around 1999 Japan had already dropped below 100 million tonnes and later climbed back above it. So 2019 was not the "first" time. What is worth recording is not the year a line was first crossed, but that after 2019 Japan never returned to 100 million tonnes — a line crossed many times and a line crossed for good are two different things.
The source hierarchy also needs stating: this 2019–2023 series is taken from a secondary compiled table, and we did not verify it against a primary time series from the Japan Iron and Steel Federation; what we can confirm is that the 2024 and 2025 figures in that table match the World Steel Association's primary publications exactly. The series is reproduced here as found, with its source tier stated alongside, so that readers can judge its reliability for themselves.
China's decline is the result of policy and cycle compounding each other. China's crude steel output peaked in 2020, at 1,065 million tonnes — the revised figure from the National Bureau of Statistics' annual report; the earlier preliminary figure was 1,053 million tonnes. After that, according to the National Bureau of Statistics' annual bulletins: 1,035 million tonnes in 2021 (down 2.8% year-on-year, the first annual decline since 2015), 1,018 million tonnes in 2022 (down 1.7%), a preliminary figure of 1,019 million tonnes for 2023 later revised to a final 1,029 million tonnes in the China Statistical Yearbook, 1,005 million tonnes in 2024 (down 1.7%), and 961 million tonnes in 2025 (down 4.4%). Five consecutive years of decline — though whether 2023 was actually up or down depends on whether you use the preliminary figure or the yearbook's final figure, another case where the statistical basis determines the conclusion.
Behind these five years of decline lies a clear policy trail: in 2021, the National Development and Reform Commission and the Ministry of Industry and Information Technology jointly deployed a reduction in crude steel output, cutting about 30 million tonnes that year; in 2024, this shifted to a joint directive from five ministries, with the mechanism moving from fixed quotas to standards-based, category-specific guidance, cutting about 23 million tonnes from January to November of that year; in 2025, the Ministry of Industry and Information Technology issued the Work Plan for Stabilizing Growth in the Steel Industry (2025–2026) and solicited public comment on the Implementation Measures for Capacity Replacement in the Steel Industry, requiring key regions to carry out capacity replacement at a reduction ratio of 1.5 to 1. The drop from peak to 2025 is about 9.8% — only a third of Japan's twenty-year decline — and China still accounts for more than half of the global total.
Moving into 2026, China's monthly data showed a sharp drop followed by a leveling off: crude steel output was 75.3 million tonnes in January, down 13.9% year-on-year, and had recovered to 83.7 million tonnes by June, up a slight 0.4% year-on-year. In Japan, output in both of those months was 6.8 million tonnes, at -0.5% and +1.3% year-on-year respectively — essentially no fluctuation. One is a billion-tonne-class system held down simultaneously by policy and demand, with enormous month-to-month elasticity; the other is an eighty-million-tonne-class system with almost no elasticity, stable at a low level.
4.2 A 12-Fold Gap in Output, a 4% Gap Per Capita
Now for a division.
In 2025, China's crude steel output was 960.8 million tonnes and Japan's was 80.7 million tonnes — the former is about 11.9 times the latter. This is the most frequently cited number, and also the one most prone to being over-interpreted.
But if each is divided by population — the current population values in the World Bank's open data, about 1.407 billion for China and about 123.4 million for Japan — the result is: China's per-capita crude steel output is about 683 kilograms, Japan's about 654 kilograms. The two differ by less than 5%.
Two disclosures must be made immediately. First, these two figures were calculated by this article by dividing World Steel Association output by World Bank population figures; they are not an indicator directly published by any institution, and this qualification must accompany any citation of them. Second, the population denominator has a statistical-basis problem of its own: Chapter 9 uses China's National Bureau of Statistics figure of 1.40489 billion (end-2025) and the Statistical Handbook of Japan's figure of 123.8 million (2024), both of which differ slightly from the World Bank figures used here. The World Bank figures are used for both countries at this point so that numerator and denominator come from one comparable population series — switching to a different population set shifts this "less than 5% apart" conclusion, but does not reverse it.
Even so, this division is enough to overturn the impression left by "twelvefold." The gap in total steel output between China and Japan comes overwhelmingly from the difference in population size, not from a difference in per-capita industrial capability. How much steel a country makes is ultimately determined by how many people it must feed, how many houses it must build, and how many machines it must manufacture; treating total output as a proxy for capability is tantamount to mistaking population for technology.
Conversely, this division should not be overused either. A high per-capita output figure partly reflects a high current intensity of investment (China is still building extensively) and partly reflects the share going to net exports; a low per-capita output figure partly reflects a stock-based society (Japan's replacement demand exceeds its new-build demand) and partly reflects an industrial center of gravity that has already shifted from selling steel products to selling the things made out of steel. The same per-capita figure can correspond to entirely different industrial stages.
This is precisely the point this article keeps returning to: no single indicator is sufficient to support a judgment of "who is stronger." Placing two indicators side by side, however, often frames the question more precisely. Total output asks "how big," per-capita output asks "how dense" — and between China and Japan, the answers to these two questions point in entirely different directions.
There is another set of per-capita figures that offers cross-verification, but it measures a different thing. In 2025, per-capita apparent steel use (finished steel product basis) was 562.1 kilograms in China, 389.5 kilograms in Japan, and 209.0 kilograms as the world average; for reference, South Korea was 843.7 kilograms, Germany 347.1 kilograms, and the United States 261.7 kilograms. Both countries' five-year trends have moved downward in one direction: China fell from 669.1 kilograms in 2021 to 562.1 kilograms, and Japan fell from 440.6 kilograms to 389.5 kilograms.
Per-capita output and per-capita consumption are not the same thing: the former measures how much is made, the latter measures how much is used. China's per-capita consumption is higher than Japan's mainly because China is still in a period of infrastructure and construction build-out; Japan's per-capita consumption is low because its stock has already been built, and new demand is chiefly for replacement and renewal. The curve of China falling from 669 to 562 is precisely a sign that the same process has begun on China's side.
4.3 The EAF Share: The Hardest Line in the Structural Gap
Beyond output volume, how steel is made is more revealing. The World Steel Association tabulated the 2025 electric arc furnace (EAF) steel share by process route for various countries:
| Country or region | EAF steel share of crude steel output |
|---|---|
| United States | 71.3% |
| India | 57.7% |
| EU-27 | 45.8% |
| Global average | 30.3% |
| South Korea | 27.0% |
| Japan | 25.8% |
| China | 10.6% |
China's 10.6% is the lowest tier among the major steel-producing countries, less than a third of the global average. This means nearly nine-tenths of China's crude steel still goes through the blast furnace–basic oxygen furnace (BOF) route, using iron ore and coking coal as feedstock, while globally, on average, three-tenths already goes through the electric arc furnace route, using scrap steel as the primary feedstock.
Behind the EAF share lies the social stock of scrap steel. For a country to have enough scrap to recycle, it must first have accumulated, over the preceding decades, large volumes of steel embedded in buildings, bridges, machinery, and automobiles — and those things must have begun entering their retirement cycle. Japan industrialized decades earlier than China, and its social stock of steel has long since entered circulation; that is why it can sustain a roughly one-quarter EAF share, and why it is a net exporter of scrap steel — exporting 6.5 million tonnes in 2024 and 7.7 million tonnes in 2025. China, by contrast, exports almost no scrap steel and imports only sporadically (0.2 million tonnes in 2024, 0.3 million tonnes in 2025).
This difference carries direct implications for carbon emissions. Based on 2024 activity data, the World Steel Association's global average emission intensity by process route is: 2.66 tonnes of CO2-equivalent per tonne of crude steel for the blast furnace–BOF route, 1.66 tonnes for the direct-reduced-iron–EAF route, and 0.71 tonnes for the scrap–EAF route; the global average is 2.18 tonnes of CO2-equivalent. Weighting these coefficients by the two countries' process structures, Japan's average carbon intensity should, in theory, be lower than China's.
This must be stated clearly: this is an inference, not a measurement. This World Steel Association publication discloses only the global average and the process-route averages, not country-specific figures for China and Japan; nor did we obtain country-specific per-tonne carbon intensity figures published separately by each country's own steel association. This article therefore presents only the direction of the inference, without giving specific country-level figures.
4.4 Capacity: A Figure the Government Does Not Publish
According to estimates by the OECD Steel Committee, global crude steelmaking capacity reached 2,482 million tonnes in 2024, exceeding actual output that year by 573 million tonnes; global capacity utilization in 2025 was about 76%, and the organization projects it will fall to 74% or lower by 2028. In a chair's statement issued in March 2026, the same committee noted that in the second half of 2025, China accounted for "more than 50%" of global excess capacity.
That final 50% figure requires particular care. It refers to China's share of global excess capacity, not its share of global total capacity. The two have different denominators, and conflating them yields entirely different conclusions.
Another point is even more worth setting down: the Chinese government never publishes a national total for steel production capacity. The Ministry of Industry and Information Technology and the National Bureau of Statistics publish output figures and capacity-replacement project data, but not total capacity. Consequently, every figure concerning China's steel capacity — including the source of that 50% figure above — rests on estimates by international organizations. This is not a complaint but a citation discipline: any figure involving China's steel capacity must be labeled "estimated" when written.
4.5 The Same Tonne of Steel, Sold for How Much
We now turn to the second core theme of this chapter. The gap in output volume is visible; the gap in value is hidden — and the latter often says more about capability.
According to statistics compiled by the China Iron and Steel Association (CISA) based on customs data: in 2024, China exported 110.716 million tonnes of finished steel products, up 22.7% year-on-year, at an average export price of US$755.4 per tonne, down 19.4% year-on-year; that same year, imports were 6.815 million tonnes, down 10.9% year-on-year, at an average import price of US$1,688.6 per tonne, up 1.8% year-on-year.
The average import price is about 2.2 times the average export price.
This set of figures is already clear without any China-Japan comparison. China exported 110 million tonnes of finished steel products and imported 6.82 million tonnes; export volume was sixteen times import volume, but the per-tonne selling price was less than half the import price. What China sells is bulk commodity grades such as hot-rolled coil, coated sheet, and rebar; what it buys back is high-unit-price grades such as electrical steel, specialty steel, and high-grade automotive sheet. For the same tonne of steel, the price can differ by more than nine hundred dollars depending on the grade.
The 19.4% year-on-year decline in average export price is also worth noting. In the same year that export volume grew 22.7%, the unit price fell by nearly a fifth — the growth in volume was, to a considerable extent, bought with price.
For 2025 total export volume, this article ran into the most textbook three-way clash of figures. China's General Administration of Customs puts finished steel product exports at 119.019 million tonnes (119.0 million tonnes), up 7.5% year-on-year and a historic high; imports that same year were 6.059 million tonnes, down 11.1% year-on-year. The figure cited by the OECD Steel Committee is 131 million tonnes. The World Steel Association's trade table gives 133.6 million tonnes, ranking first globally, with net exports of 126.6 million tonnes; the same table shows Japan exporting 29.8 million tonnes, ranking second globally, with net exports of 24.1 million tonnes.
Among the three figures, the highest and lowest differ by 14.6 million tonnes, about 12%. Where does the difference come from? Most likely in the scope of statistics — whether semi-finished products such as billets are included, and whether the figure is a measured aggregate or an institutional estimate. We were not able to verify the methodological footnotes of each party, so we cannot offer a definitive explanation.
This article's approach: treat China's General Administration of Customs' primary figure of 119.0 million tonnes as the main reference, on the grounds that it has a verifiable internal consistency — working back from the official 2024 figure of 110.716 million tonnes at a 7.5% growth rate yields exactly 119.0 million tonnes, so two figures published at different points in time corroborate each other. The other two figures are noted alongside as higher estimates under international-institution statistical bases, with the reason for the discrepancy unverified.
A rough but meaningful ratio: on the customs statistical basis, China's finished steel product exports amount to about 12.4% of its crude steel output; on the World Steel Association basis, Japan's amount to about 36.9%. It must be stated that in both ratios, the numerator is finished steel products and the denominator is crude steel — an inconsistent statistical basis — so these can serve only as an order-of-magnitude reference. Even so, the direction is clear: Japan's export dependence is nearly three times China's. Domestic demand in Japan's steel industry has shrunk to the point where more than a third of output must be absorbed through exports, while China's steel industry still serves mainly the domestic market.
We were unable to obtain a US-dollar-per-tonne average export price for Japanese steel products — Japan's export volume is tallied by fiscal year while its export value is tallied by calendar year; the two do not match, and dividing one by the other would produce an incorrect number. This article therefore does not make a direct China-Japan comparison of per-tonne steel prices. This is the comparison we most wanted to make but the data would not allow — better to leave it blank than to manufacture a false precision.
4.6 Specialty Steel: Between One-Fifth and Less Than One-Tenth
Beyond output volume and selling price, there is a third angle: how much of a country's steel is specialty steel.
Data on the Japanese side comes from the Japan Special Steel Association (whose underlying statistics are drawn from the Japan Iron and Steel Federation's monthly report), a primary, product-by-product table. In 2025, Japan's specialty steel hot-rolled steel product output was 15.3617 million tonnes, nearly flat against 15.3387 million tonnes in 2024. By category: structural steel 6.91 million tonnes, special-purpose steel 8.404 million tonnes (of which stainless steel 2.0677 million tonnes, high-tensile steel 4.5153 million tonnes, bearing steel 0.7401 million tonnes, spring steel 0.2761 million tonnes), and tool steel 0.1844 million tonnes (of which alloy tool steel 0.0678 million tonnes).
Dividing the 15.36 million tonnes of hot-rolled finished product by that same year's 80.70 million tonnes of crude steel output yields about 19%. It must be noted that this is a cross-basis rough calculation — the numerator is finished rolled product, the denominator is crude steel — not an official "share" figure. Another statistical basis, attributed to the Japan Iron and Steel Federation and relayed via Chinese-language media, gives 18.6 million tonnes for 2024, a share of 22.1%. The two estimates fall between 19% and 22%, suggesting Japan's specialty steel share of crude steel output is roughly one-fifth.
For the same indicator on the China side, we found two figures that differ by nearly a factor of two: one puts 2024 output at about 137 million tonnes, or 13.4% of crude steel (those two figures do not even agree with each other: 137 million tonnes divided by that year's 1,005 million tonnes of crude steel is 13.6%, not 13.4%); another, attributed to the China Special Steel Enterprises Association, gives 2024 quality and specialty steel crude steel output of 78.69 million tonnes, or 7.83%. Both are secondary citations; we did not verify a primary source for either, and the discrepancy likely lies in the statistical scope of "quality and specialty steel" (whether ordinary alloy steel is included, and whether the basis is crude steel or finished product). This article presents both figures side by side without taking a side.
Even taking the higher figure (13.4%), China's specialty steel share is still noticeably below Japan's roughly one-fifth; taking the lower figure (7.83%), the gap is more than twofold. The range itself is already enough to establish the direction.
A more specific comparison can be made by category, but the statistical basis requires extra care here. In figures relayed from the China Special Steel Enterprises Association, China's 2024 output was 4.97 million tonnes of bearing steel, 5.02 million tonnes of gear steel, and 0.85 million tonnes of tool steel; Japan's 2025 bearing steel output was 0.7401 million tonnes. China's bearing steel output is therefore close to seven times Japan's (497 divided by 74.01 is about 6.7). On the Chinese side this capacity sits mainly with a handful of specialised producers, such as CITIC Pacific Special Steel and Xingcheng Special Steel.
That multiple needs two immediate discounts. First, the China-side figure does not specify whether it is on a crude steel basis or a finished product basis, while the Japan side is explicitly on a hot-rolled finished product basis, so the two are not strictly comparable. Second, and more importantly: bearing steel output and bearing grade are not the same thing. Chapter 8 will show that China's average import price for bearings is more than four times its average export price — between being able to make bearing steel and being able to make high-grade bearings lies an entire process chain of heat treatment, forging, grinding, and inspection. Output volume can measure scale; it cannot measure grade. This is the same wall this article runs into in every industry it examines.
4.7 Blast Furnaces: A System Physically Shrinking
The contraction of Japan's steel industry is not happening only in statistical tables — it is happening in equipment as well.
Nippon Steel shut down one blast furnace at the Yawata area of its Kyushu Works in 2020, and in 2021 shut down two blast furnaces at the Kure area of its Setouchi Works (closing the Kure Works entirely) plus one blast furnace at the Wakayama area of its Kansai Works. The shutdown of these four blast furnaces cut its domestic annual crude steel capacity from 50 million tonnes to 40 million tonnes, a reduction of about a fifth.
JFE Steel announced a structural reform plan in March 2020, specifying a transition from an eight-blast-furnace system to seven; within fiscal year 2023, it shut down one blast furnace and related equipment at the Keihin area of its East Japan Works, cutting domestic crude steel capacity by about 13%. Under the plan, it will shut down the No. 4 blast furnace at the Fukuyama area in fiscal year 2027, and in fiscal year 2028 will shut down the No. 2 blast furnace at the same time a newly built electric arc furnace comes online at the Kurashiki area — bringing the cumulative reduction to about a fifth by then.
On the total number of blast furnaces currently in operation in Japan, we found only a secondary-source figure: about 65 in 1990, about 28 in 2025. We could not verify the year-by-year figures in between, so this article gives only these two endpoints, with the source tier noted.
The difference between a blast furnace and a statistical table is irreversibility. Output can rebound with demand; a dismantled blast furnace will not. A modern large blast furnace typically takes years from decision to ignition, with investment measured in tens of billions of yen, and it comes with an entire line of supporting coke ovens, sintering, converters, and continuous casting. What Japan's steel industry has done over the past five years is proactively adjust physical capacity downward to match domestic demand, while using overseas investment and exports to absorb the remaining capacity. This is the standard move of a mature industrial nation after demand has peaked — it is not dramatic, but it is one-directional.
One detail in JFE's plan is worth noting: in fiscal year 2028, at the same time a blast furnace is shut down at Kurashiki, a new electric arc furnace comes online. What is being subtracted is a blast furnace; what is being added is an electric arc furnace — the 25.8% EAF share from Section 4.3 will keep climbing.
4.8 Raw Materials: Two Different Kinds of Vulnerability
In 2024, China's domestic iron ore output was 300.1 million tonnes, imports were 1,238.2 million tonnes, apparent consumption was 1,513.7 million tonnes, and its import dependence ratio was about 81.8%. Japan's domestic iron ore output was zero, imports were 96.4 million tonnes, apparent consumption was 96.4 million tonnes — 100% import-dependent.
One relies on imports for eight-tenths; the other relies on imports entirely. On the surface, Japan looks more vulnerable, but the real degree of vulnerability depends on scale and substitution elasticity. Japan imports 96.4 million tonnes of iron ore a year; China imports 1,238 million tonnes — the latter is nearly thirteen times the former. Facing the same supply shock, a country that needs to reallocate 96 million tonnes on the global market and a country that needs to reallocate 1.2 billion tonnes face problems of an entirely different magnitude. Japan's vulnerability is "it must buy"; China's vulnerability is "the volume it buys is large enough to drive up the price on its own." These are two constraints of a different nature.
Japan's coking coal import dependence is also widely recognized in the industry as being almost entirely import-reliant, but we were unable to obtain a citable primary figure, so no percentage is given.
On the China side, the industrial organization of steel is markedly different from Japan's. Beyond China Baowu Steel Group and its listed entity Baoshan Iron & Steel, Angang Steel, HBIS Group, Shagang Group, Shougang Group, Maanshan Iron & Steel, and Baotou Steel each hold their own ground, and at the specialty steel end there are specialized enterprises such as CITIC Pacific Special Steel, Xingcheng Special Steel, Nanjing Iron & Steel, and Shanxi Taigang Stainless Steel. Japan, by contrast, is concentrated in the hands of a small number of fully integrated steelmakers. This difference in concentration means the two countries operate on entirely different mechanisms for capacity adjustment, price formation, and technology investment — China's output adjustment requires administrative intervention, while Japan's output adjustment is more a matter of individual companies' own shutdown decisions.
One last fact, noted without elaboration: Nippon Steel completed its acquisition of U.S. Steel on June 18, 2025, for a deal value of US$14.9 billion, at US$55 per share, with a commitment to invest US$11 billion in the United States through 2028. A steelmaking nation whose domestic output has fallen to just over 80 million tonnes placing capacity where demand is, through overseas acquisition — this is another path for responding to shrinking domestic demand, a different expression of the same logic seen earlier in Japan's shipbuilding industry's "consolidation, exit, concentration."
Chapter 5 Machine Tools: No. 1 in Production Value, One-Fifth the Unit Price — Both True at Once
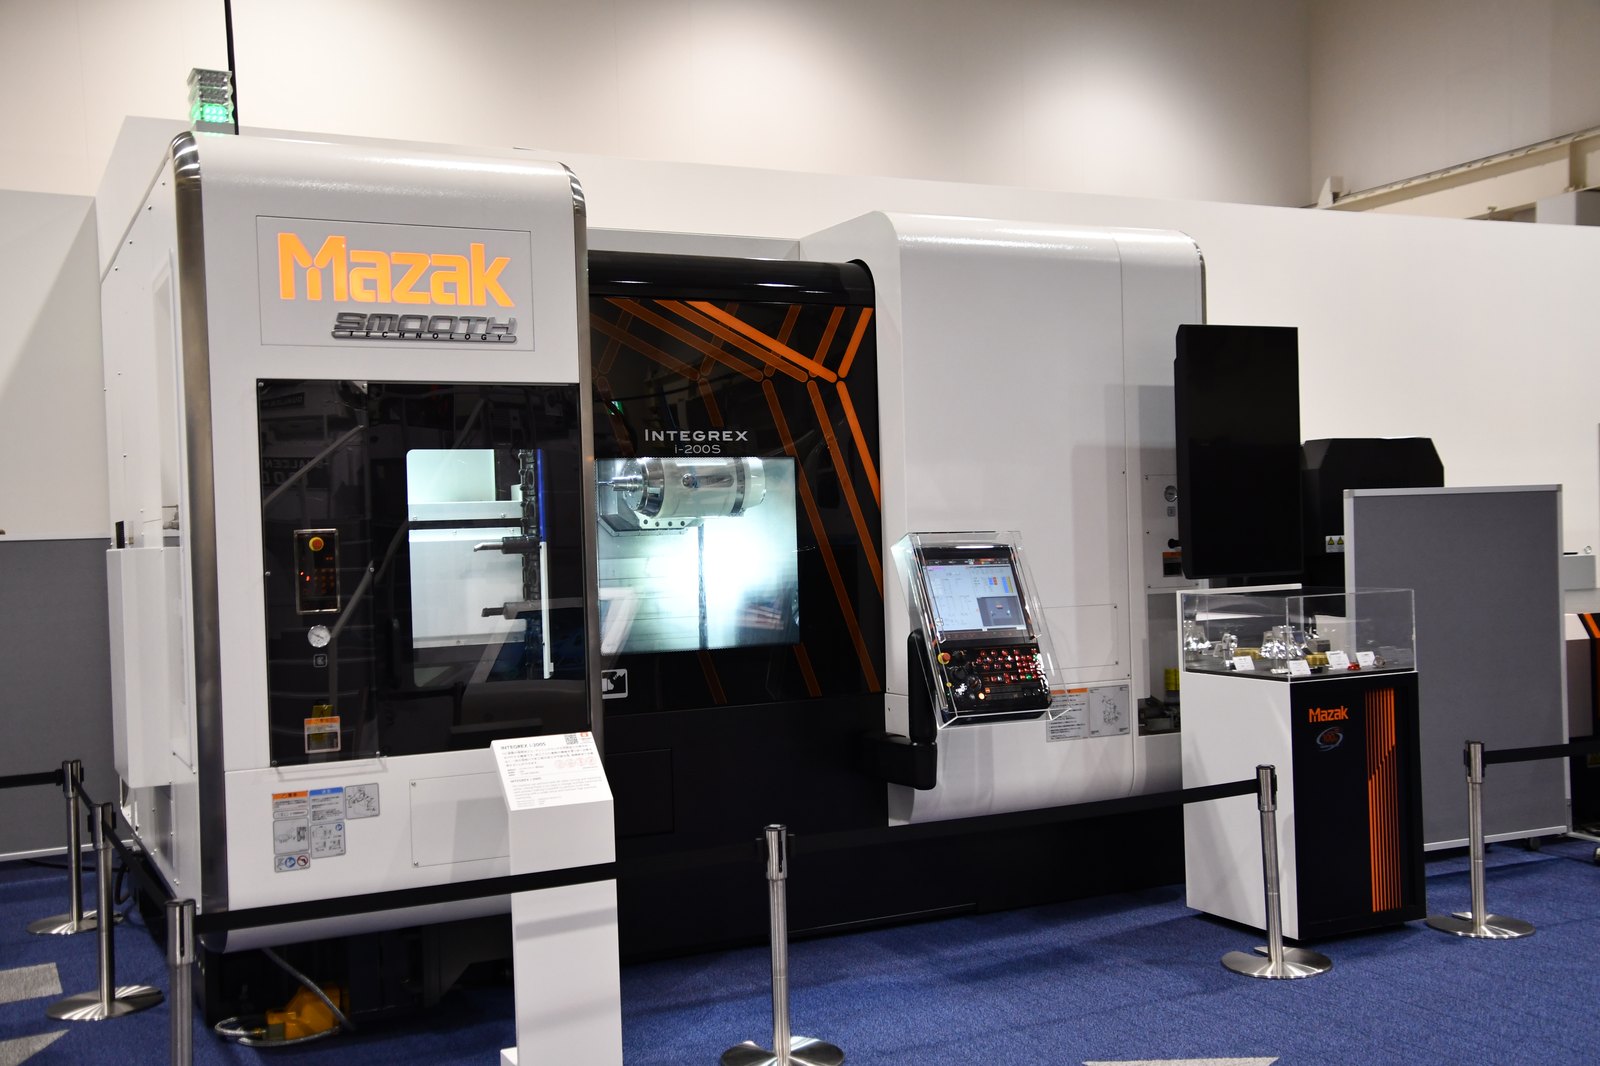
Machine tools is the chapter in this article where statistical basis is most easily gotten wrong, so the yardsticks are laid out first.
- Production value (production): the value of machine tools actually completed in production. Gardner Intelligence's annual World Machine Tool Survey uses this basis.
- Consumption (consumption): production value plus imports minus exports, measuring how many machine tools a country bought. Published in the same report.
- Production value and consumption (denominated in RMB): the basis used by the China Machine Tool & Tool Builders' Association (CMTBA), with a statistical scope of "metal-cutting and metal-forming machine tools," drawn mainly from key monitored enterprises.
- Orders received (order value): the value of new orders published monthly by the Japan Machine Tool Builders' Association (JMTBA). This is separated from actual production by a production-scheduling lag of several months to more than a year.
These four cannot be added, subtracted, or converted into one another. Comparing JMTBA's order value directly against Gardner's production value is the most common type of error in machine tool data.
5.2 Production Value and Consumption: Two No. 1s
According to Gardner Intelligence's 57th World Machine Tool Survey, for 2024:
| Country or region | Production value (US$100 million) | Consumption (US$100 million) |
|---|---|---|
| China | 273 | 246 |
| Germany | 109 | 53 |
| Japan | 79 | 29 |
| United States | 71 | 118 |
| Italy | 66 | 34 |
| South Korea | 45 | 29 |
| Taiwan, China | 29 | — |
| Global total (54 countries) | 834 (883 in 2023) | 800 (851 in 2023) |
(Note: This article did not directly access Gardner's paid original report; the figures above are taken from public trade-media coverage citing that report.)
China's production value is 3.5 times Japan's and 2.5 times Germany's, and exceeds the combined total of Germany, Japan, and the United States (US$25.9 billion). China has been the world's largest machine tool consumer since 2002 and the world's largest machine tool producer since 2009; before that, Japan had held the top spot in production value for 27 consecutive years starting in 1982.
On CMTBA's own RMB-denominated basis, China's metal-cutting and metal-forming machine tools had production value of RMB 205 billion and consumption of RMB 185.6 billion in 2024; production value of RMB 219.8 billion and consumption of RMB 189.2 billion in 2025. On the whole-industry basis (machine tools and tools, including abrasives and grinding wheels), 2025 operating revenue was RMB 1,057.1 billion, total profit RMB 42.1 billion, and profit margin 4.0%; 2024 operating revenue was RMB 1,040.7 billion, total profit RMB 26.5 billion, and profit margin 2.6%. The three statistical bases — machine tools and tools, metal-cutting and metal-forming machine tools, and CNC machine tools — differ in scale by a factor of dozens, and which one is meant must be specified when citing.
That 4.0% profit margin is worth a closer look. In an industry with operating revenue exceeding RMB 1 trillion, total profit was RMB 42.1 billion; and the year before, the profit margin was only 2.6%. For comparison, FANUC's operating margin over the same period was 21.4%.
5.3 A Common Argument That Must Be Corrected
On the claim that China's machine tool industry is "big but not strong," the most widely circulated argument runs: "production value may be No. 1, but the high end depends on imports, so there is a huge trade gap."
This argument does not hold up against the data.
On Gardner's basis, China's 2024 machine tool production value was US$27.3 billion and consumption was US$24.6 billion — production value exceeded consumption by US$2.7 billion, i.e., a net export position. On CMTBA's customs basis, 2025 exports of metal-cutting and metal-forming machine tools were US$9.68 billion and imports were US$5.39 billion, likewise a surplus. Whichever basis is used, China's machine tool trade is, in aggregate value, a net exporter, not a net importer.
So if "big but not strong" is true, its evidence cannot be the direction of the trade balance. The real evidence lies elsewhere.
5.4 Unit Price: Three Thousand Units versus Thirty Thousand Units
China customs data on CNC machine tool imports and exports is as follows:
| Period | Average import price | Average export price | Ratio |
|---|---|---|---|
| Full year 2023 | US$154,200/unit | US$27,900/unit | about 5.5x |
| Jan–Apr 2024 | US$103,200/unit | US$22,000/unit | about 4.7x |
In 2023, China imported 3,997 CNC machine tool units and exported 29,111 units. Export units were 7.3 times import units, and export volume grew by nearly half year-on-year; yet total import and export value combined was US$1.429 billion, with a surplus of only US$197 million.
Fewer than four thousand units imported, nearly thirty thousand exported, and the two sides' totals in dollar value almost balance out. This is the true shape of "big but not strong": not buying a lot and selling a little, but rather that every unit bought back is worth about five and a half units sold.
This unit-price gap of more than fivefold is the most forceful number in this chapter. It answers two questions at once: China's machine tool industry scale is real (an annual export volume of nearly thirty thousand units cannot be faked), and China's machine tool industry grade gap is also real (the price of one imported machine can buy five exported machines). Both things are true at once, without contradiction.
A qualification is needed: this dataset's category is "CNC machine tools," a subset of "metal-cutting and metal-forming machine tools," not all machine tools; and we did not obtain updated data for 2025, nor unit-price data broken down by country of origin.
5.5 Export Dependence: Another Face of Japan's Machine Tool Industry
JMTBA's confirmed figures for fiscal year 2023 are: production value of 1,052.8 billion yen (down 2.4% year-on-year), of which CNC machine tools accounted for 93.1%; export value of 830.4 billion yen (down 3.1% year-on-year), of which CNC machine tools accounted for 96.5%; and import value of 85.5 billion yen.
Dividing exports by production yields 78.9%. Since these are two figures in the same currency, the same year, and from the same institution, this ratio, calculated by direct division, is reliable.
The corresponding ratio on the China side can only be estimated: converting CMTBA's 2024 metal-cutting and metal-forming machine tool production value of RMB 205 billion into US dollars and comparing it against that year's export value yields about 28.8%; using Gardner's US$27.3 billion production value as the denominator instead yields about 30.1%. Both calculations land around three-tenths. This is a cross-currency, cross-basis estimate, not an official "export ratio" published by any institution, and this qualification must accompany any citation of it.
Nearly eight-tenths versus three-tenths — this comparison says more than the production-value rankings do. The scale of Japan's machine tool industry is determined by overseas demand: domestic machine tool consumption is only US$2.9 billion while production value is US$7.9 billion, and the US$5 billion gap between the two must find buyers overseas. It is not "having spare capacity to export" but "cannot survive without exporting." China's machine tool industry is the opposite: with production value of US$27.3 billion and consumption of US$24.6 billion, the vast majority of output is absorbed domestically — the scale of China's machine tool industry is underpinned by the scale of China's own manufacturing investment.
These two structures show no clear advantage over each other during an upcycle, but the difference is enormous during a downcycle. A domestic-demand-driven industry follows its own country's investment cycle; an export-driven industry follows the global investment cycle, and must additionally absorb currency-rate swings.
5.6 Who Is Buying Japan's Machine Tools
JMTBA's orders received data for fiscal year 2025: total value of 1.6043 trillion yen, up 8% year-on-year; of which domestic demand was 440.86 billion yen, down 0.2% year-on-year, and foreign demand was 1.16346 trillion yen, up 11.5% year-on-year, a historic high.
By region, orders from China exceeded 300 billion yen, marking the second consecutive year above 300 billion yen and a historic high; North America hit a record high of 360 billion yen; Europe stayed below 200 billion yen for a second consecutive year. Using the "over 300 billion" floor for the calculation, China's orders account for more than a quarter of foreign demand.
Moving into 2026, this trend accelerated. Cumulative orders received for January–June 2026 were 1.05501 trillion yen, up 35.7% year-on-year, of which domestic demand was 272.89 billion yen and foreign demand was 782.39 billion yen; total orders received in June alone were 203.51 billion yen, up 52.8% year-on-year, surpassing 200 billion yen for the first time, of which foreign demand was 145.499 billion yen.
Placing these figures alongside the structure described in Section 5.5, a loop becomes clear: about eight-tenths of Japan's machine tool industry production value depends on exports, more than a quarter of its foreign demand comes from China, and China's orders in this category are mainly driven by equipment investment in the electric vehicle and electronics and information industries. In other words, the pace of China's manufacturing capacity expansion is directly a major variable in the fortunes of Japan's machine tool industry. Conversely, China's high-end machining capability is, to a considerable extent, built on these imported machine tools. The two sides' industry cycles are interlocked, and a policy shift on either side leaves a traceable mark on the other's books.
JMTBA has 114 regular member companies (as of April 2026), and member companies' output accounts for more than nine-tenths of Japan's total domestic machine tool production value. A membership group on the order of a hundred companies underpins US$7.9 billion in annual production value and a near-eight-tenths export rate — this is a highly concentrated, highly specialized industrial structure.
5.7 Domestic Content Ratio: The Confusion Itself Is the Answer
In writing about the domestic content ratio of high-end CNC systems, we ran into the thorniest data problem in this article.
The companies working at this layer can be counted — Huazhong CNC and Guangzhou CNC are the two largest domestic CNC system makers — but from publicly available channels, China's CNC system "domestic content ratio" carries at least five mutually conflicting figures: about 6% (on a high-end CNC machine tool basis, media reporting of Ministry of Industry and Information Technology data), about 10% to 15% (on a high-grade five-axis machining center CNC system basis), about 20% (on a unit-count basis), about 34% (on a market-share basis, compiled by research institutions), and about 50% (a 2025 projected figure, a consulting-firm forecast rather than an actual value).
Not one of these five figures can be traced back to a primary public document from the Ministry of Industry and Information Technology or CMTBA.
The domestic content ratio for five-axis machining centers is the same story: publicly cited figures swing between about 10% and 25% — Kede CNC is one of the few Chinese firms to command both a high-end CNC system and a five-axis machine tool development programme in-house, but the progress of a single company says nothing about the self-sufficiency of the whole industry. We checked, article by article, the original texts of CMTBA's economic operation reports for 2024 and 2025, and neither report discloses production volume, sales volume, or domestic content ratio data for five-axis machining centers.
Faced with this situation, this article's approach is: take no side, give no single number, and write the confusion itself down as the conclusion.
The root of the confusion lies in the denominator. The term "domestic content ratio" has an entirely different denominator depending on context: counted by unit, a domestic economy-grade system priced at RMB 100,000 and an imported five-axis system priced at RMB 1 million each count as one unit, so the domestic content ratio naturally looks high; counted by sales value, the same two units make the domestic content ratio drop immediately; and narrowing further to the "high-grade" sub-tier changes the denominator yet again. Three denominators can produce three answers differing by several times over, and public citations often drop the qualifiers, leaving only a bare percentage.
So a more honest statement than offering one falsely precise number is this: China's degree of self-sufficiency in high-end CNC systems, under publicly checkable statistical bases, ranges anywhere from single digits to three-tenths, depending on what denominator is used — and this indicator has no authoritative primary public statistic.
Likewise, on the quantified gap between Chinese and Japanese machine tools in mean time between failures and positioning accuracy grades, we found no primary comparative data at all from associations or academic papers. This article adopts none of the various hour figures and accuracy grades circulating informally. The import dependence of high-end functional components (ball screws, linear encoders, rotary encoders, high-speed electric spindles) is the same story — only directional industry consensus exists, with no citable primary figure.
5.8 Industry Structure: Two Bankruptcy Reorganizations and a New Wave of Companies
Two major events occurred in China's machine tool industry over the past decade; only the years and facts are recorded here. Dalian Machine Tool was placed into court-ordered bankruptcy reorganization proceedings in November 2017, with the restructuring finalized through investment by China General Technology Group in April 2019. Shenyang Machine Tool had its reorganization plan approved by court ruling on November 16, 2019; China General Technology Group invested RMB 3.5 billion for a 57% stake in Shenji Group and RMB 1.8 billion for a 29.99% stake in Shenji Co., Ltd.
Two former industry leaders entered judicial reorganization one after the other within two years, while over the same period China's machine tool production value held steady at No. 1 globally — that these two things happened at the same time is itself an annotation on the claim of being "No. 1 in production value." Production-value statistics measure the entire country's output; they guarantee the survival of no single specific enterprise. Expansion in scale and clearing-out in structure can proceed simultaneously.
Today's Chinese machine tool industry is a layered structure where old and new coexist. Beyond this older tier of factories — Shenyang Machine Tool, Dalian Machine Tool, Jinan No.2 Machine Tool, Wuhan Heavy Duty Machine Tool, Qinchuan Machine Tool, and Beijing No.1 Machine Tool — a different set of names has emerged: Haitian Precision, Niuwei CNC, Chuangshiji, Guosheng Zhike, Beijing Jingdiao, and Kede CNC. On the CNC system side there are Huazhong CNC and Guangzhou CNC; on the functional components side there are Nanjing Gongyi Equipment and Haozhi Electromechanical; and on the tooling side there are Zhuzhou Diamond and Oke Precision. This list's length coexists with that blank spot where "no primary figure could be found for the five-axis domestic content ratio." Enterprises can be counted; capability cannot be measured — this is precisely the situation this article must repeatedly confront.
Chapter 6 Equipment: The Height of the Finished Machine and the Depth of the Component
Let us start with one incident. It matters more than any single number in this chapter.
The International Federation of Robotics (IFR) publishes World Robotics every year. One of its core indicators is robot density, defined as the number of industrial robots per 10,000 manufacturing employees. It measures the level of automation, and it is one of the most frequently cited indicators in cross-country comparisons.
In November 2024, the IFR's World Robotics 2024 gave the density rankings for 2023:
| Country/Region | Density (units per 10,000 manufacturing employees) | Rank |
|---|---|---|
| South Korea | 1,012 | 1 |
| Singapore | 770 | 2 |
| China | 470 | 3 |
| Germany | 429 | 4 |
| Japan | 419 | 5 |
| United States | 295 | — |
| Global average | 162 | — |
These figures were widely cited, and the conclusion seemed clear: China's robot density had already overtaken Germany and Japan, vaulting to third place in the world.
In April 2026, the same federation published an updated set of density figures, giving the rankings for 2024:
| Country/Region | Density (units per 10,000 manufacturing employees) | Rank |
|---|---|---|
| South Korea | 1,220 | 1 |
| Singapore | 818 | 2 |
| Germany | 449 | 3 |
| Japan | 446 | 4 |
| United States | 307 | 8 |
| China | 166 | 22 |
China fell from 470 to 166, from third place in the world to twenty-second, from above Germany and Japan to less than four-tenths of their level.
Seventeen months separated the two reports.
In those seventeen months, China's operational stock of robots did not decline — the same federation's report states that China's operational stock of industrial robots surpassed 2 million units in 2024, the largest in the world. Nor did China's annual installations decline — 295,000 units in 2024, an all-time high, accounting for 54% of the global total.
What changed was the denominator. The federation's press release states, in so many words, that the figure was recalculated "based on updated labor market data from China's National Bureau of Statistics." In other words, the number of people employed in China's manufacturing sector was revised upward, the denominator of the density fraction grew larger, and the quotient shrank accordingly. Exactly what value the denominator changed from, and to, the press release does not say.
The same institution, the same indicator, the same country — a single revision to the statistical basis of the denominator turned the conclusion from "third in the world, having overtaken Germany and Japan" into "twenty-second in the world, far below Germany and Japan."
That revision says everything this article is about. It reminds us of three things: first, the credibility of any ratio-based indicator depends on its denominator, and the denominator is often harder to measure reliably than the numerator; second, as Chapter 9 shows, Japan alone has three official statistical bases for manufacturing employment that differ from one another by about 2.7 million people, and the denominator on the China side is likewise being revised again and again; third, the most dangerous thing is not that a number is wrong, but that a number gets cited detached from the statistical basis behind it — the widely circulated "470, third in the world" will go on circulating through countless secondhand citations long after the original report has itself been updated.
This article's approach is to list both figures, explain the source of the discrepancy, and take no side. As for exactly which year, and under which statistical basis, China's robot density actually overtook that of Japan and Germany, we were unable to obtain year-by-year trend data, so we draw no conclusion on that point.
6.2 Installations and Operational Stock: This Layer Is Clear
Density may be miscalculated, but the numerator itself is clear. The IFR's World Robotics 2025 gives the following 2024 installation figures:
| Country | 2024 installations | Year-on-year |
|---|---|---|
| China | 295,000 units | all-time high |
| Japan | 44,500 units | -4% |
| United States | 34,200 units | -9% |
| South Korea | 30,600 units | -3% |
| Germany | 26,982 units | -5% |
| Global | 542,000 units | above 500,000 for the fourth consecutive year |
China accounted for 54% of the global total, 6.6 times Japan's figure. By region, Asia accounted for 74%, Europe 16%, and the Americas 9%.
China's operational stock surpassed 2 million units in 2024, the largest in the world. (We were unable to obtain a figure for Japan's operational stock in this round of research, so no China-Japan comparison of operational stock is offered.)
One detail is worth noting: in the very year China's installations hit a record high, the four other major markets — Japan, the United States, South Korea, and Germany — all declined, by 3% to 9%. China's 54% share is partly the product of its own growth, and partly the product of everyone else's decline. These two components cannot be separated out within the total-share figure, but they must be kept separate when judging the trend.
(Complete 2025 data has not yet been published. The federation's June 2026 press release disclosed that the United States installed 38,000 units in 2025, up 11% year-on-year, and estimated that China's figure was roughly ten times that of the United States — this is an estimate, not a statistic, and this article does not adopt it.)
6.3 The Supply Side: A Market Changing Hands
Installation figures tell us who is using the robots. Market share tells us who is making them.
The IFR's World Robotics 2025 states that domestic Chinese manufacturers' share of the Chinese market reached 57% in 2024, up from roughly 28% a decade earlier.
A doubling in ten years, from less than three-tenths to nearly six-tenths. This is one of the rare pieces of evidence in this article for import substitution that is both clearly directional and large in magnitude; Estun Automation and Inovance Technology are the two largest domestic manufacturers on that curve.
Yet the seemingly simple question of "which year did it cross 50%" turns out to be yet another demonstration of statistical basis at work. We found three different accounts: the IFR says 57% in 2024; data from GGII (Gaogong Industry Research Institute), cited by multiple financial media outlets, says the domestic share first crossed 50% in 2023, reaching 52.45%, on a sales-volume basis; and data published in November 2025 by the Robotics Branch of the China Machinery Industry Federation says the domestic-brand share first crossed 50% in 2024, reaching 58.5%, with domestic-brand sales that year at 177,000 units.
Both sources use the word "first" — but the years differ, and so do the figures. None of the reports we found specify whether they use a sales-volume basis or a sales-value basis, whether collaborative robots are counted, or how domestic versus foreign ownership is determined. The three figures are broadly consistent in order of magnitude (52.45% → 57% and 58.5%), but this article does not pick any one of them as "the year it crossed fifty percent," and states only that it crossed fifty percent sometime between 2023 and 2024, with the exact year depending on the statistical basis used.
On the Japanese side, the best primary data on supply-side structure comes from the full-year 2025 statistics published by the Japan Robot Association (JARA):
| Indicator | 2024 | 2025 | Year-on-year |
|---|---|---|---|
| Orders | 182,464 units | 218,987 units | +20.0% |
| Production | 176,215 units | 207,004 units | +17.5% |
| Domestic shipments | 46,267 units | 37,816 units | -18.3% |
| Exports | 135,145 units | 173,323 units | +28.2% |
| Exports as share of shipment units | 74.5% | 82.1% | — |
In value terms, 2025 production totaled 945.269 billion yen, and exports totaled 789.657 billion yen.
More than eight-tenths of Japan's robot-industry shipments rely on exports, while domestic shipments actually fell 18.3% in a year of overall growth. This is the same structure as Chapter 5's finding that close to eight-tenths of Japan's machine-tool output value depends on exports: domestic demand can no longer support domestic capacity, and the scale of the industry is being determined by overseas markets.
Looking at export concentration by application sector in 2025: clean-room-grade robots for electronic components and semiconductors shipped 28,658 units, of which 18,708 were exported (65.3%); machinery-equipment-category robots shipped 4,676 units, of which 3,938 were exported (84.2%); and automotive and auto-parts-category robots shipped 9,511 units, of which 7,050 were exported (74.1%).
6.4 Reducers: The Finished Machine Has Changed Hands, the Joint Has Not
Among the core components of an industrial robot, precision reduction gears present the highest barrier to entry of them all. They determine an arm's repeat positioning accuracy, load capacity, and service life, and they typically account for two- to three-tenths of the cost of the finished machine.
Nabtesco states on its own official product pages that its share of the global market for precision reduction gears used in the joints of medium and large industrial robots is approximately 60% (a company self-estimate, with no specific year given).
On the China side, Leaderdrive states on its own official site that its share of the domestic market for strain wave (harmonic) reducers is above 60%, and that as of 2025, annual sales of its 21 series of strain wave reducers exceeded 300,000 units (a company self-statement, with no specific statistical year given).
The two 60% figures are not describing the same thing. Nabtesco's 60% refers to the global market, medium and large robot joints, and rotary vector (RV) reducers; Leaderdrive's 60% refers to the Chinese market and strain wave reducers specifically. Strain wave reducers are compact and highly precise, and are mainly used in small robots and the end joints of robotic arms; RV reducers carry heavier loads and are used in the base and main-arm joints of large robots. The two technical paths have different barriers to entry and different competitive landscapes.
(Harmonic Drive Systems' global market share in strain wave reducers, and figures on Shuanghuan Driveline's related business, we were unable to obtain from primary sources this round, so they are not listed. The single data source on China-Japan servo-system market shares sits behind a paywall, and is likewise not listed.)
What can be concluded is limited but clear: China's domestic share of finished industrial robots has already crossed the halfway mark, while in the most critical component — precision reduction gears — at least in the segment of medium and large robot joints, the global landscape is still dominated by a single Japanese company. Domestic substitution in the finished machine and domestic substitution in the component are two curves running at entirely different paces — this is the same shape as Chapter 3's finding on shipbuilding, "first in final assembly, with local-content in the supporting supply chain still stuck where it was a decade ago," and the same shape as Chapter 5's finding on machine tools, "first in output value, at one-fifth the unit price."
The same shape recurring across three otherwise unrelated industries suggests that it is not the accidental problem of any one industry, but a shared characteristic of a stage of development.
6.5 Construction Machinery: One Set of Japanese Numbers We Could Get, and a Pile of Comparisons We Could Not
For this section on construction machinery, we were only able to obtain complete primary data for the Japan side; the China-side association data could not be obtained.
According to shipment statistics published by the Construction Equipment Manufacturers Association of Japan (CEMA) — an original table, not a secondhand citation — for calendar year 2025, domestic shipments of equipment (excluding spare parts) came to 879.13 billion yen, exports came to 2,087.265 billion yen, and the combined total was 2,966.395 billion yen, putting exports at 70.36% of the total; under the grand total including spare parts, exports came to 69.72%. Broken out by category, hydraulic excavators alone had domestic shipments of 257.984 billion yen and exports of 891.702 billion yen, an export share of 77.6%. The corresponding shares for 2024 were 68.75% and 73.8% respectively — both rose between the two years.
This export share of 70% to 78% is exactly the same shape as Japan's machine-tool industry in Chapter 5, where close to eight-tenths of output value depends on exports, and as Japan's robot industry earlier in this chapter, where more than eight-tenths of shipments depend on exports. Three different equipment industries, one and the same structure: the scale of Japan's equipment-manufacturing sector is determined by overseas markets, with the domestic market absorbing less than three-tenths.
On the China side, the China Construction Machinery Association's official website repeatedly timed out in this round, and we were unable to obtain excavator annual sales volume or export share. The only figure we obtained was a self-disclosure by XCMG Group in its own official press release: by 2025 sales revenue, the company ranked third globally on the 2026 Yellow Table, with construction-machinery equipment sales of roughly 14 billion US dollars and a global market share of 5.8%, making it the only Chinese manufacturer in the global top five; over the same period the company's operating revenue was 100.823 billion yuan, of which overseas revenue was 48.599 billion yuan, or 48.20%.
It should be noted that this ranking and share figure are a self-citation by the company — the page hosting the list is dynamically rendered, and we were unable to directly verify the original ranking. Likewise, the most recent rankings and revenue figures for Komatsu, Hitachi Construction Machinery, Zoomlion, and LiuGong were all unobtainable in this round; the handful of rankings previously in circulation correspond to 2012 and 2019 respectively, are seriously out of date, and this article does not use any of them.
As originally planned, this chapter was also meant to include a China-Japan comparison of capabilities in power generation equipment and heavy-duty gas turbines, and revenue and market share for rail-transit equipment. Neither of these met this article's evidentiary standard in this round either: the China Electrical Equipment Industrial Association's official website contains no specific output figures, and the National Bureau of Statistics' data-query interface blocked access; the file size of CRRC's latest annual report exceeded our crawl limit, and the third-party data source for its global market share statistical basis was inaccessible.
One supplementary comparison we were able to make comes from the UN Comtrade database: in 2024, Japan's exports to China of machinery (HS Chapter 84) totaled 30.508 billion US dollars, and of electrical machinery and equipment (HS Chapter 85) totaled 22.276 billion US dollars, for a combined 52.784 billion US dollars; by our own calculation from these figures, China absorbed 24.26% of Japan's machinery exports and 22.04% of its electrical-machinery exports. For every four machines Japan sells, roughly one is sold to China.
Under this article's own rules, what cannot be obtained is not written. It is disclosed here honestly so that readers know this chapter's coverage is incomplete — it covers industrial robots and the Japan side of construction machinery, but not China's construction-machinery sales volume, power-generation equipment, or rail-transit equipment.
There is one further matter this chapter has not handled, though it has already surfaced in the numbers. The same structure recurs throughout: the scale of Japanese equipment manufacturing is determined by overseas markets, and domestic demand cannot sustain domestic capacity — across machine tools, robots, and construction machinery, export shares run at close to eight-tenths, above eight-tenths, and above seven-tenths respectively. But since 2023 a new source of demand has entered that structure, one that does not depend on exports and is large enough to change those proportions. It did not arise from the market. It was arranged by a cabinet decision. The next chapter deals with it.
It should be noted that the equipment-manufacturing enterprises on the China side that this article was able to verify are not few in number: SANY Group, XCMG, Zoomlion, LiuGong, Shantui, and China Railway Construction Heavy Industry on the construction-machinery and tunneling-equipment side; CRRC, CRRC Zhuzhou Locomotive, and CRRC Times Electric on the rail-transit side; TBEA on the power-transmission-and-transformation side; Weichai Power on the power-plant side; Shanghai Zhenhua Heavy Industries (ZPMC) on the port-machinery side; Estun Automation, Inovance Technology, JAKA Robotics, and Topstar on the robotics-and-automation side; and Leaderdrive, Shuanghuan Driveline, and Zhongda Leader on the reducer side. The list of companies can be drawn up; what is missing is comparable capability data. All this article can do is mark out the gap.
Chapter 7 Forty-Three Trillion Yen: A Procurement Demand in Industrial Terms
The previous chapter ended on a structure: in Japan's equipment manufacturing, close to eight-tenths of machine tool output value depends on exports, more than eight-tenths of robot shipments depend on exports, and more than seven-tenths of construction machinery shipments depend on exports — domestic demand cannot sustain domestic capacity, and scale is determined by overseas markets.
This chapter deals with something new inside that same structure: a source of demand that does not depend on exports.
7.1 Three Figures, Three Statistical Bases, Three Multiples
On 16 December 2022, the Japanese government adopted three documents at a single cabinet meeting: the National Security Strategy, the National Defense Strategy, and the Defense Buildup Program. The first two are direction. The third is money.
Section XIII of the Defense Buildup Program is titled "Required Expenses etc." It has three clauses and gives three figures. Those three figures are frequently cited interchangeably, and they do not measure the same thing — the exercise this article has performed in each of the preceding six chapters has to be performed once more here.
Clause one: for the five years from FY2023 to FY2027, the amount corresponding to "the level of defense capability development necessary to implement this program" is on the order of 43 trillion yen.
Clause two: the "defense-related expenditure" accompanying each fiscal year's budget formulation during the program period is on the order of 40.5 trillion yen, of which FY2027 accounts for approximately 8.9 trillion yen. This clause carries two premised measures: further acceleration of Self-Defense Force facility development, on the order of 1.6 trillion yen; and use of general-account fiscal surpluses should they exceed projections, on the order of 900 billion yen.
Clause three: the "contract value (materiel expenses)" for newly required projects to implement the program is on the order of 43.5 trillion yen, excluding amounts payable outside the program period under contracts contributing to maintenance efficiency.
The preceding program was the Medium Term Defense Program, adopted on 18 December 2018 and covering FY2019 to FY2023. Its Section V, "Required Expenses," likewise has three clauses: the level of defense capability development, approximately 27.47 trillion yen at FY2018 prices; defense-related expenditure, approximately 25.5 trillion yen; and contract value (materiel expenses), approximately 17.17 trillion yen at FY2018 prices, stated explicitly as a ceiling.
Placing the two programs side by side gives three multiples:
| Statistical Basis | 2019–2023 | 2023–2027 | Multiple |
|---|---|---|---|
| Required expenses (level of defense capability development) | 27.47 trillion yen | approx. 43 trillion yen | 1.57× |
| Defense-related expenditure (sum of annual budgets) | 25.5 trillion yen | approx. 40.5 trillion yen | 1.59× |
| Contract value (materiel expenses) | 17.17 trillion yen | approx. 43.5 trillion yen | 2.53× |
Three multiples: two around 1.6, one at 2.53. Where does the difference come from?
The first two bases measure "how much money is allocated across these five years." The third measures "how many orders are signed across these five years." For industry, only the third figure is an order book. A contract signed this year may be paid out over the following five to ten years; the budget basis records the payment, the contract basis records the signature. Companies schedule production, invest in equipment, and hire against contracts, not against payments.
So looking only at the most frequently quoted 1.57× systematically understates what this expansion means on the industrial side. The increase in orders actually reaching Japanese manufacturers is more than half again larger than the headline aggregate suggests.
This comparison requires two qualifications, both drawn from the texts themselves. First, the contract-value clauses in the two programs are verbatim parallel — both read "contract value (materiel expenses) for projects newly required to implement this program," and both carry the same exclusion for amounts payable outside the program period under maintenance-efficiency contracts — so they can be compared; but the older program specifies "at FY2018 prices" while the newer one states no price base year, so price changes between the two have not been stripped out. Second, the older program frames its figure as a ceiling; the newer one carries no such limiting language. Both differences push the 2.53× figure upward, but neither is enough to pull it back into the 1.6 range.
7.2 Placing It Against Japan's Own Industrial Yardsticks
Spread across five years, 43.5 trillion yen comes to roughly 8.7 trillion yen a year.
What order of magnitude is that? The preceding chapters happen to have measured several Japanese manufacturing sectors:
| Comparison | Value | 8.7 trillion yen per year equals |
|---|---|---|
| Japanese machine tool output value (2024) | US$7.9 billion, about 1.2 trillion yen at that year's average rate | about 7× |
| Japanese robot production value (2025) | 945.269 billion yen | about 9× |
| Japanese construction machinery shipments (2025, equipment excluding spare parts) | 2,966.395 billion yen | about 2.9× |
| Japanese nominal manufacturing value added (FY2024) | 110.99 trillion yen | about 7.8% |
A disclosure is required immediately: contract value, output value, shipment value, and value added are four different quantities and, strictly speaking, cannot be compared. The table above serves only as an order-of-magnitude reference, answering one question — is this procurement demand large or small set against Japanese manufacturing? All four ratios were calculated by this article and are not published by any institution.
The answer is: large. It is roughly seven times the annual output value of Japan's entire machine tool industry, about nine times its robot industry, and close to three times its construction machinery shipments; even measured against the value added of the whole of manufacturing, it comes to nearly eight percent.
Set that against the structure from the previous chapter and the implication emerges. The chronic problem of Japanese equipment manufacturing has been insufficient domestic demand: machine tool consumption at home is only US$2.9 billion against output value of US$7.9 billion; domestic robot shipments actually fell 18.3% in 2025, a growth year; domestic construction machinery shipments account for under three-tenths of the total. Now there is a source of demand that runs for five consecutive years, is measured in trillions, carries government credit, and does not rise and fall with the overseas capital-expenditure cycle.
For a manufacturing system whose domestic demand has been shrinking for decades, this is not an ordinary order. It is a change in the structure of demand.
7.3 A Fourth and Fifth Statistical Basis, and a Denominator Held Fixed
The annual initial budget supplies two more bases, and there is a line separating even those two:
| Fiscal year | Ministry of Defense budget | Total defense-related expenditure | Year-on-year (total) |
|---|---|---|---|
| 2023 | 6.6001 trillion yen | 6.8219 trillion yen | up roughly 26–27% |
| 2024 | 7.7249 trillion yen | 7.9496 trillion yen | +16.5% |
| 2025 | 8.4748 trillion yen | 8.7005 trillion yen | +9.4% |
| 2026 | 8.8093 trillion yen | 9.0353 trillion yen | +3.8% |
The line separating the two columns is expenditure related to SACO and the realignment of US forces in Japan, running 220 to 226 billion yen a year. Across three years, total defense-related expenditure grew 32.4%.
At this point the same subject has five official figures: the program total, the five-year defense-related expenditure, the contract value, the annual Ministry of Defense budget, and the annual total defense-related expenditure. All are official; none is wrong. This chapter is therefore the most concentrated demonstration in the article of its central discipline: it is not that figures are true or false, but that each answers a different question — and whoever is citing them tends to take whichever is most convenient.
The target side has an original text too. Section VI(2) of the National Security Strategy states that by FY2027, measures shall be taken so that the budget level for the fundamental reinforcement of defense capability together with complementary initiatives reaches 2 percent of current gross domestic product. The numerator is not "defense expenditure" but "the fundamental reinforcement of defense capability together with complementary initiatives"; the denominator is "current" gross domestic product. Both qualifications are written into the text.
The actuals come from footnotes in the Defense White Paper: for FY2024, expenses subject to the Defense Buildup Program plus the expenses of complementary initiatives totalled 8.9 trillion yen, which against gross domestic product at the time the National Security Strategy was formulated — that is, FY2022 — comes to about 1.6%; for FY2025 the total was 9.9 trillion yen, or about 1.8% on the same comparison. For FY2023 and FY2026, primary official documents give no percentage specific to those years, so none is given here.
One detail is worth pausing on: the White Paper's percentages hold the denominator fixed at FY2022 gross domestic product rather than using the current year's. In years when nominal gross domestic product rises, a ratio computed against a fixed denominator comes out higher than one computed against the current-year denominator. And the strategy's own text says only "current gross domestic product" — the qualifier "2022" is an official gloss the Ministry of Defense added when restating the passage in the White Paper, not language the primary document itself contains verbatim. In a single percentage, the scope of the numerator, the year of the denominator, and who gets to define that year are all three movable.
7.4 The Export Side: A Change of Statistical Basis
Beyond the demand side, something has also changed on the side of whether output can be sold abroad.
On 1 April 2014, Japan established the Three Principles on Defense Equipment Transfers by National Security Council decision and cabinet decision. The header of the Implementation Guidelines records the subsequent amendment history verbatim: partial amendments on 24 November 2015, 22 March 2016, 8 March 2022, and 22 December 2023. In other words, there was only one amendment during 2023 — the one on 22 December, made jointly by an extraordinary cabinet meeting and the National Security Council. The Ministry of Economy, Trade and Industry's announcement that day describes the amendment as intended to make defense equipment transfers possible across a broader range of fields.
Two provisions in the amended Guidelines bear directly on finished products, and their clause numbers are traceable. Article 1(2)(i)(e)② lists the so-called "five categories" of finished products: finished products relating to cooperation in rescue, transport, warning, surveillance, and minesweeping, including weapons under the Self-Defense Forces Act necessary for carrying out those primary duties or for self-protection. Article 1(2)(i)(c) concerns finished products of licensed production being returned to the licensing country.
The source hierarchy needs stating plainly: those provisions were read verbatim from the current post-amendment text, but we did not obtain the pre-amendment version for a clause-by-clause comparison, and therefore cannot determine whether these two provisions were newly added in this amendment or already existed and were merely adjusted. This article states only what the current provisions say, not what this amendment added. Various specific cases circulating in secondhand accounts were likewise not verified against a primary source and are not written here. The full course of this framework's evolution from the postwar export prohibition to the present belongs to another article in this series; see Dissolution and Revival.
On the record of actual transfers there is one official figure. The eleventh Annual Report on the Status of Permissions for Overseas Transfer of Defense Equipment, issued by the Ministry of Economy, Trade and Industry, discloses that in FY2024 the Minister granted 1,211 individual permissions for overseas transfers of defense equipment.
The implication in industrial terms is clear. Where a category has a single domestic buyer, capacity planning is bounded by the ceiling of domestic procurement; once transfers abroad are permitted, that ceiling loosens. The previous chapter observed that the scale of Japanese equipment manufacturing is determined by overseas markets — a statement that until now largely did not apply to the defense segment, because that segment barely exported at all. That boundary is now moving.
7.5 Where the Orders Land: Three Sets of Primary Figures
Beyond budgets and institutions, three sets of figures show what this demand looks like on the ground.
The first, and the hardest evidence in this chapter: the Acquisition, Technology and Logistics Agency's central procurement contract value. This is neither a budget allocation nor a program ceiling but the procurement contracts actually signed each year — same agency, same statistical basis, published annually:
| Fiscal year | Contract value (100 million yen) |
|---|---|
| 2015 | 18,126 |
| 2016 | 18,397 |
| 2017 | 15,764 |
| 2018 | 14,402 |
| 2019 | 18,243 |
| 2020 | 17,121 |
| 2021 | 18,031 |
| 2022 | 17,208 |
| 2023 | 55,737 |
| 2024 | 57,943 |
| 2025 | 47,887 |
For eight years the figure drifted between 1.44 and 1.84 trillion yen with no trend. Then in 2023 it jumped to 5.57 trillion yen — 3.24 times in a single year. The 2015–2022 eight-year average was 1.72 trillion yen; the 2023–2025 three-year average was 5.39 trillion yen, a ratio of 3.14 between the two periods.
FY2023 was the first year of execution after the Defense Buildup Program was adopted in December 2022.
A statistical-basis point has to be picked up here, or two figures in this article will look as though they contradict each other: section 7.2 put the program's contract value at roughly 8.7 trillion yen a year averaged over five years, while central procurement here runs 5.57 trillion yen in 2023 and 5.79 trillion in 2024. They are not the same basket. By the Acquisition, Technology and Logistics Agency's own definition, "central procurement" is the agency's unified procurement of the major equipment and services designated by the Minister; items not so designated — along with three exceptions even among designated items, namely single contracts of 2.5 million yen or less, cases of particular urgency, and cases specially approved by the Minister — are procured by the individual organs themselves and are called "local procurement." Central procurement is therefore only part of defense procurement, and excludes local procurement.
Two official figures from the same year, both on a contract basis, set out the relationship: of the FY2024 new contract value authorised under national treasury obligations, the portion covered by the Defense Buildup Program was 9.3625 trillion yen, while central procurement executed that year was 5.7943 trillion yen — the latter about 61.9% of the former. The Ministry of Finance document supplies a direct confirmation as well: it states that this 9.3625 trillion yen was provided for "in light of the ceiling on new contract value stipulated in the Defense Buildup Program (on the order of 43.5 trillion yen)." In other words, the annual "new contract value" and the program's 43.5 trillion yen are the same measure to begin with; the five-year average of 8.7 trillion and that year's 9.3625 trillion differ by a factor of 1.08, which is the same order of magnitude.
Two qualifications should also be stated. First, central procurement performance is the result of contracts actually signed in the year, while new contract value is a budgetary contracting authorisation; they are not the same act, so 61.9% is an indicative proportion rather than a strict share. Second, the central procurement item list includes foodstuffs, and food expenses sit under "personnel and provisions expenses" rather than "materiel expenses" in the defense budget, so central procurement is not strictly nested within contract value (materiel expenses). As for the annual total of local procurement, the agency's document gives the definition but not the amount; we did not verify it, and therefore cannot reconstruct an exact reconciliation.
This curve comes closer than any of the budget bases to what industry actually experiences: for a company taking the work, a five-year program is news and an annual budget is background, but only the contract value is a job. And the step in the contract value is steeper than the multiple on any budget basis.
The second: the split between defense and civil demand in aircraft production. The Society of Japanese Aerospace Companies' statistics are the only official industry-basis decomposition this article was able to find. FY2024 aircraft production totalled 2.0619 trillion yen, passing 2 trillion yen for the first time in five years, up 22% year on year; of that, civil demand was 1.4333 trillion yen, or 69.5%, up 19%, and defense demand was 628.6 billion yen, or 30.5%, up 31%. The previous fiscal year's total was 1.6868 trillion yen, with civil at 71.5% and defense at 28.5%.
In one year the defense share moved from 28.5% to 30.5%, and defense demand grew faster than civil demand. That is direct evidence of the internal composition of an industry shifting, not an outside inference. (These figures come from specialist media reporting of the association's preliminary numbers rather than the association's own published table, so they sit one tier lower on source hierarchy.)
The third: arms revenue on an international basis. The Stockholm International Peace Research Institute's annual report, published in December 2025, shows the world's 100 largest arms producers with combined arms revenue of US$679 billion in 2024, up 5.9% in real terms and the highest in the institute's records; of that, Japan's five listed companies accounted for a combined US$13.3 billion, up 40% year on year, with all five posting double-digit growth. The institute attributes the increase to Japanese domestic demand.
This set requires particular care, however. The institute states in its own methodology that its "arms revenue" sometimes uses a company's self-reported defense share and sometimes the total revenue of a defense segment — which may contain undifferentiated civil business — and that where a company does not report publicly, the institute estimates. So it is not the same thing as the segment revenues companies disclose themselves; the two cannot be added together or substituted for one another.
Which leads to the last statistical-basis problem in this chapter.
7.6 "How Much of This Company Is Defense?" — A Question With No Single Answer
From the companies' own FY2024 filings: one discloses "Aircraft, Defense and Space" as a single segment with revenue of 1.0306 trillion yen, 20.5% of group revenue — but that segment contains commercial aviation. Another discloses an "Aerospace Systems" segment at 567.8 billion yen while separately giving a narrower line, "to the Ministry of Defense," at 400.8 billion yen, or 18.8% of company revenue. A third discloses "Aero Engine, Space and Defense" at 555.7 billion yen and also a narrower line, "defense aero engines and equipment," at 150.2 billion yen. A fourth discloses "Defense and Space Systems" at 353.8 billion yen, up 37%, with orders received of 761.7 billion yen, up 53%. Three further companies with substantial defense contract awards do not break out a defense segment at all — and a contract award is not a segment revenue; one cannot stand in for the other.
Four companies, four ways of drawing the boundary, and two of them publishing two lines each of differing width.
So at the level of public disclosure, "how much of this company is defense" has no single answer. This article therefore does not assemble these percentages into a table that would look comparable — doing so would manufacture a precision that does not exist. What can be said is only the direction: in the same year, all of these figures rose, by margins ranging from a third to well over four-fifths, and their statistical bases differ from one another.
7.7 Where This Chapter Comes Down
Everything above consists of budget clauses, decision dates, and facts stated in industrial terms. This article does not make, and will not make, assessments of fighting power, comparisons of equipment, or projections of war in any form — those are neither questions industrial data can answer nor the direction this article points in.
But with the facts laid out this far, several things have to be said plainly.
This is the largest expansion of Japanese defense procurement in the eighty years since 1945. On the comparable required-expenses basis it is 1.57 times the previous program; on the contract-value basis — the one that actually reaches companies — it is 2.53 times. And it occurred alongside a change in the rules governing transfers of that same capacity abroad, less than a year and a half apart.
Industrial history has left ample record of this combination: reorganising part of a manufacturing base around defense procurement while simultaneously lifting export restrictions on that capacity has never, in industrial history, been a neutral technical adjustment. What changes is not only where orders flow, but which direction engineers accumulate expertise in, what standards supply chains are built to, and whose demand companies stake their return expectations on when they expand. Such changes have momentum, and they do not reverse easily.
This article therefore maintains explicit vigilance toward the revival of militarism and toward remilitarization. That judgment rests not on any single figure but on the direction of the whole set of moves: the scale of the budget, the increase measured on the contract basis, and the loosening of export restrictions all point the same way. And it must be equally clear who is being criticised — the forces and the institutional choices driving that direction, not Japan's factories, not its workers, and not the path of peaceful development Japan has followed since 1945. That path is the precondition for eighty years of Japanese economic achievement and for very nearly all of the industrial cooperation across East Asia in these decades.
Chapter 8 Supporting Industries: How Do You Measure a Country's Component Depth
8.1 Starting From a Single Bearing
When Chapter 3 discussed shipbuilding, its section on the local-content rate of the supporting supply chain left a gap: China's actual figures for the years after 2020 have never again been officially disclosed. When Chapter 5 discussed machine tools, the import dependency of functional components likewise could not be found in a primary source. This chapter is here to deal with that recurring gap — whether a country's "component depth" can be measured at all, and with what.
Let us start with bearings, because they are the common foundation beneath all rotating machinery. A ship's main shaft needs bearings; a machine tool's motorized spindle needs bearings; wind-turbine gearboxes, high-speed-rail bogies, and robot joints all need bearings. A bearing is small, cheap, and unremarkable, but it determines how fast, how long, and how precisely the machine sitting on top of it can turn.
The largest players in China's bearing industry — ZWZ Bearing, LYC Bearing, and Renben Group — all go back decades; the scale figures for the industry as a whole come from the China Bearing Industry Association: bearing output in 2025 was 25.6 billion sets, up roughly 8% year-on-year; export earnings were 6.787 billion US dollars; industry operating revenue grew 6.6% year-on-year, and full-year revenue was projected to surpass 240 billion yuan. The association has over 330 member enterprises, accounting for more than 70% of the entire industry by total sales.
(A note on statistical basis: the figures above were obtained from secondhand citations, since the statistics section of the China Bearing Industry Association's official website loads dynamically and we were unable to read the original tables directly; there is also an internal inconsistency across different secondhand sources on the production series — for instance, another source puts 2023 output at roughly 27.5 billion sets, and the path of increase or decrease between that figure and the 25.6 billion sets for 2025 cannot be reconciled. This article reproduces the association's statistical basis as given and flags this layer of uncertainty.)
25.6 billion sets is an enormous number. If China's annual bearing output were divided evenly across its population of 1.4 billion, it would come to 18 sets per person.
Now look at the unit price.
8.2 Fourfold: The Same Shape, Again
For China's bearing import and export unit prices, the 2025 figures cited by multiple financial and trade media outlets from customs statistics are: exports of 1,292,800 tons worth 6.537 billion US dollars, for an average export price of roughly 5,100 US dollars per ton; imports of 156,600 tons worth 3.446 billion US dollars, for an average import price of roughly 22,000 US dollars per ton. The average import price is about 4.3 times the average export price.
Another secondhand-citation source gives 2025 export figures of 863,800 tons and 5.069 billion US dollars, for an average export price of 5,900 US dollars per ton — differing from the first set by three to five tenths, presumably because the customs codes used cover a different scope (whether plain bearings and bearing parts are included). A set of secondhand 2024 figures reads: exports of 806,200 tons worth 4.978 billion US dollars, at an average price of 6,200 US dollars per ton; imports for the first eleven months totaling 3.206 billion US dollars and 150,500 tons, at an average price of 21,300 US dollars per ton — and that piece states outright, in its own words, that "the average import price is roughly four times the average export price."
It must be said plainly: all of the above are secondhand citations from media outlets; we did not directly verify the original tables from the General Administration of Customs. The total export volumes across different sources differ by three to five tenths, which shows that at least one of the sets uses a different statistical scope than the other. This article therefore adopts only the conclusion the two sources point to in common — that China's bearing import unit price runs at roughly four times its export unit price — and does not treat either source's absolute figures as definitive.
Now let us set the numbers from three chapters side by side:
| Product Category | Import Unit Price ÷ Export Unit Price | Statistical Basis and Source Tier |
|---|---|---|
| Steel (2024) | approx. 2.2x | China Iron and Steel Association, citing customs data |
| Bearings (2024–2025) | roughly 4x | multiple media outlets citing customs statistics, primary source not verified |
| CNC machine tools (2023) | approx. 5.5x | customs data compiled by a research institution |
From steel to bearings to CNC machine tools, the multiple keeps widening. This is not a coincidence — it is a clear pattern: the further back in the industrial chain a product sits, the more processing steps it goes through, and the higher the precision it requires, the larger China's unit-price gap becomes. Steel is a material, a bearing is a component, and a machine tool is a machine that processes components; at each higher layer, one more portion of unmeasurable quality difference accumulates, and the price gap the market sets for that difference grows by one more increment.
This pattern answers this article's title better than any single industry's numbers could. The sheer scale of China's manufacturing sector is beyond dispute, while the gap between that scale and unit price widens as one moves up the layers of the industrial chain — this is what the word "weight" truly means in the title "the weight of capacity": it has heft, but the heft is concentrated in the lower layers.
8.3 Why This Layer Is Hardest to Measure
In the steel and shipbuilding chapters, we were at least able to obtain primary statistics from industry associations and government bodies. At the level of the supporting supply chain, data quality drops off a cliff. In the evidence-gathering for this chapter, a large share of entries ended up landing on "unverified."
The reasons are not hard to understand.
First, the overwhelming majority of enterprises in the supporting supply chain are not publicly listed and carry no mandatory disclosure obligations. Aside from a handful of listed companies, the bearing industry is made up of thousands of small and mid-sized factories whose output, product mix, and customer structure never enter any public filing.
Second, the statistical bases used for supporting-industry product categories are extremely fragmented. Under the single word "bearing" sit dozens of major subcategories — deep-groove ball bearings, tapered roller bearings, self-aligning roller bearings, precision angular-contact bearings, thin-section bearings, slewing bearings, and more — each with a technical barrier and price range that can differ by several orders of magnitude. Any broad-brush "bearing output" figure conceals enormous internal variation.
Third, the most critical indicator of all — the domestic-content rate — lacks any neutral party to measure it. Figures for "the domestic-content rate of such-and-such component" are typically stated separately by the demand side, the supply side, or an industry association, each with its own definition of the denominator — the five mutually conflicting figures on CNC systems in Chapter 5 are the best example of this.
The result: the supporting supply chain is precisely the layer that determines the depth of a country's manufacturing sector, and it is also precisely the layer where public data is thinnest.
The visibility problem at this layer is not only a headache for researchers — it is a headache for the industry itself. A final-assembly yard that needs to source ballast-water treatment systems for a new ship design, a machine-tool builder looking for a domestic motorized spindle for a five-axis machine, a construction-machinery firm wanting to switch its hydraulic main pump to a domestic supplier — all of them face the same question: do factories that meet the requirement even exist, where are they, and how many are there? These enterprises appear on no public rankings, do no brand marketing, and often do not even have a proper website.
What Tianxia Gongchang has been doing over these years is precisely turning this layer from invisible into visible — through the ongoing identification and verification of operating factories across the entire manufacturing sector, covering approximately 4.8 million operating real factories, it lets supporting-industry enterprises that are scattered across the country and leave little public trace be found and searched by product and process. It must be stressed that this figure reflects an industry-wide factory-identification statistical basis, and it is not the same thing as any single-industry enterprise count discussed in this chapter, nor the statistical basis of any national statistics bureau — the two cannot be equated with each other or added together for comparison. This is exactly where the value of industrial research lies: only once the statistical basis has been sorted out can one begin to see things clearly.
On the China side, the scale of verifiable enterprises within the supporting supply chain is genuinely impressive. In bearings there is ZWZ Bearing, LYC Bearing, Renben Group, Xiangyang Bearing, Xinqianglian, and Lixing; in hydraulics there is Hengli Hydraulic and Aidi Precision; in transmission there is NGC, Shuanghuan Driveline, and Zhongda Leader; in passive components there is Fenghua Advanced Technology, Chaozhou Three-Circle Group, Sunlord Electronics, and Faratronic; and in carbon fiber there is Zhongfu Shenying Carbon Fiber, Guangwei Composites, and Jilin Carbon Valley. The list is not short. The problem remains the same line that closed Chapter 5: you can count the enterprises; you cannot measure their capability.
8.4 R&D: The One Set of Figures Where the Two Countries' Statistical Bases Fully Align
Among all the evidence gathered for this chapter, only one set of data satisfies all three conditions at once: a primary source, the same statistical basis for both China and Japan, and the most current year available. It comes from the European Commission's Joint Research Centre's EU Industrial R&D Investment Scoreboard, 2025 edition, covering fiscal year 2024 and published in December 2025.
Among the 2,000 companies with the highest R&D spending in the world:
| Country | Companies Listed | Share of Top 2,000 Aggregate (Scoreboard published figure) | R&D Investment (derived here from the share) |
|---|---|---|---|
| China | 525 | 16.1% | approx. €232.8 billion |
| Japan | 192 | 7.8% | approx. €112.8 billion |
For context, these 2,000 companies are headquartered across 45 countries, with combined 2024 R&D investment of €1.446 trillion.
One point on statistical basis belongs here. What the Scoreboard publishes at the headline level is the percentage share; the absolute amounts in the last column above were derived by this article by multiplying that share by the aggregate total (16.1% × €1,446bn ≈ €232.8bn; 7.8% × €1,446bn ≈ €112.8bn), and are not figures the Scoreboard states directly. Published values and derived values must sit in separate columns rather than being merged into one and presented as facts of the same order — a trap this article actually fell into while drafting: an early version carried an absolute figure that did not reconcile with its own share, and it was caught only by running the check "does the absolute value divided by the aggregate equal the share as reported."
China has 2.7 times as many companies on the list as Japan, and 2.06 times Japan's total R&D investment. But dividing one by the other reveals something else: the average R&D spend of a Chinese company on the list is roughly €443 million, versus roughly €588 million for a Japanese company — a Japanese listed company's per-company R&D intensity runs roughly 30% higher than a Chinese one's.
Two readings of the same data. Read by total and by headcount, China clearly leads. Read by per-company average, Japan is more concentrated. Which reading is correct? Both are — they answer different questions. The total answers "how much did this country pour into R&D in a year"; the per-company average answers "how much does each of this country's most R&D-committed companies spend." The former is about breadth. The latter is about depth.
This set of figures also needs one qualifier: it is a company-level statistical basis, not a national macro R&D statistical basis, and the two must not be conflated. As for the share of GDP that China and Japan each spend on R&D (an OECD statistical basis) and the most recent-year figures for PCT international patent applications (a WIPO statistical basis), we were unable to obtain reliable, current numbers in this round of evidence-gathering — for the former, we found only secondhand citations with outdated years and unclear statistical bases; for the latter, the most recent data is packaged in a download-only file, with no text displayed on the page itself. This article therefore does not write these two items.
8.5 What This Chapter Can and Cannot Conclude
What can be concluded: the scale of China's supporting supply chain is real, and both its verifiable enterprise count and its output are large; and, from materials to components to equipment, the unit-price gap widens layer by layer — a pattern that recurs across three independent product categories, which lends it considerable credibility.
What cannot be concluded: any specific "domestic-content rate" for any particular product category. Multiple indicators this chapter had originally planned to verify — Japanese manufacturers' specific global market shares in bearings, passive components, precision motors, and carbon fiber; the change in the domestic-content rate of main pumps and main valves in Chinese excavators; the age of business owners and the exit rate among Japan's small and mid-sized manufacturers; and a China-Japan comparison of manufacturing labor productivity — none of these met this article's evidentiary standard from a primary source. All these gaps have been fully recorded, and this article does not fill them with estimates.
At the end of a chapter, the most substantive takeaway is often not what was found, but a clear sense of what could not be found, and why. The thinness of data at the level of the supporting supply chain is itself a portrait of that layer's position within the industry: it is important enough to determine the success or failure of everything above it, and it is hidden enough that no statistical system has ever seriously bothered to count it.
Chapter 9 Factor Inputs: Electricity, Labor, and Exchange Rates
The preceding five chapters were about output. This chapter is about input — where the electricity comes from, where the people come from, and a variable that is often overlooked but that affects every cross-border comparison: the exchange rate.
9.1 Electricity: Ten Times the Volume, Half the Price
The physical foundation of manufacturing is electricity.
In 2025, China's total electricity generation across all sectors reached 10,575.25 TWh (105,752.5 hundred-million kWh in the original Chinese release), up 4.8% year-on-year. The by-source figures are in TWh, the same order of magnitude as the total: thermal power 6,327.15 (down 0.7%), hydropower 1,461.67, nuclear power 485.23 (up 7.6%), and wind power 1,127.92 (up 13.1%); combined clean-energy generation from hydro, nuclear, wind, and solar totaled 4,248.1, up 14.4% (solar is not itemized in the same passage; subtracting hydro, nuclear, and wind from the combined figure gives roughly 1,173.28, a figure derived here rather than stated in the release).
Thermal power of 6,327.15 plus clean energy of 4,248.1 comes to exactly 10,575.25, the total — by-source figures reconciling with the total is the cheapest available check on order of magnitude. An early draft of this article mislabelled these very figures by a factor of one hundred, and it was this addition check that caught it.
On the Japanese side, generation in fiscal year 2023 (April 2023 to March 2024) was 926.13 TWh (including in-house corporate generation), down 1.4% year-on-year, of which thermal power accounted for 77.4%, hydropower 9.1%, and nuclear power 8.7%.
What is the ratio between the two countries? It depends how you pair the figures. China's 2025 figure against Japan's FY2023 figure gives roughly 11.4 times; China's 2024 figure against Japan's CY2024 figure gives roughly 10.3 times; and using 2025 data for both countries on the same third-party energy-statistics basis (Ember) gives roughly 10.3 times. The conclusion is a range: roughly 10 to 11 times, with the exact multiple depending on whether a fiscal year or a calendar year is used, and whether an official statistical basis or an international-agency estimate is used. This chapter's very first number is, once again, a demonstration of statistical basis at work.
More telling than the volume is the price. Industrial electricity prices run at roughly 0.108 US dollars per kWh in China versus roughly 0.201 US dollars per kWh in Japan — Japan's price is roughly 1.86 times China's.
This figure needs a discount applied to it: it comes from a commercial energy-price aggregation website, labeled as a 2023–2026 average updated in the second quarter of 2026, with no clear indication of whether it includes tax; we made repeated attempts to access primary industrial electricity-price data directly from the International Energy Agency, and all were blocked. This article therefore uses the figure only for a directional judgment — that Japan's industrial electricity price is significantly higher than China's, on the order of roughly double — and does not treat it as a precise value.
The gap in electricity prices lands directly on the cost table for shipbuilding in Chapter 3. The steel cost for a 40,000-DWT bulk carrier in China is only 53% of Japan's, and steelmaking is an extremely energy- and electricity-intensive step; electricity that is nearly half the price and steel that is nearly half the price are not a coincidence. Energy prices transmit into final product costs through material prices — they never appear as an independent line item on any cost table, but they are hidden inside almost every line.
Behind this lies an even more fundamental constraint: Japan's primary energy self-sufficiency rate in fiscal year 2023 was 15.3%, meaning 84.7% of its energy is imported. This curve is worth looking at on its own — 20.2% in FY2010, falling to a historic low of 7.3% in FY2015, 11.3% in FY2020, 12.6% in FY2022, and back up to 15.3% in FY2023. The 7.3% low point in 2015 corresponds to the trough after nuclear power was shut down; the subsequent recovery has come from restarting nuclear plants and a rising share of renewables.
A country with a primary energy self-sufficiency rate of barely fifteen percent will inevitably have higher industrial electricity prices than a country with a far higher self-sufficiency rate. This is not the outcome of a policy choice — it is the outcome of geography. (We were unable to obtain a verifiable official percentage for China's primary energy self-sufficiency rate, so no figure is given.)
9.2 People: Two Different Downward Curves
At the end of 2025, China's total population stood at 1.40489 billion, a decrease of 3.39 million from the end of the previous year, with a natural population growth rate of -2.41‰. Japan's total population in 2024 was 123.8 million, down 550,000 from the previous year; Japan's population peak came in 2010, at 128.06 million.
Both countries are shrinking, but they are at different stages. Japan has been coming down from its peak for fifteen years now; China has just begun.
The structural difference is even larger. Under China's National Bureau of Statistics' official 16-to-59 age bracket, China's working-age population is 851.36 million, or 60.6% of the total population; those aged 60 and above number 323.38 million, or 23.0%; and those aged 65 and above number 223.65 million, or 15.9%. Under the internationally standard 15-to-64 age bracket, Japan's 2024 share was 59.6%, or roughly 73.79 million people; those aged 65 and above numbered 36.24 million, 29.3% of the total — a historic high.
These two sets of figures cannot simply be subtracted from one another. China's official statistical basis uses ages 16 to 59; the internationally standard statistical basis uses ages 15 to 64 — the lower bound differs by one year and the upper bound by five. China's 60.6% and Japan's 59.6% may look close, but they are not actually measuring the same age range. The only thing that can be pinned down is the degree of aging: 29.3% of Japan's population is 65 or older, versus 15.9% of China's — a gap of 13.4 percentage points. This particular comparison can be made, because the statistical basis is consistent on both sides.
Comparing manufacturing employment is even messier. Japan alone has three different official statistical bases: the industry-classification basis from the Labour Force Survey puts manufacturing employment in 2024 at roughly 10.46 million (15.4% of total employment of 67.81 million); the establishment-based basis from the Economic Census puts it at 7.7519 million for 2023 (excluding sole proprietors, across 223,391 manufacturing establishments); and the occupation-classification basis from the Labour Force Survey puts it at 8.64 million for 2024. The three figures differ by as much as roughly 2.7 million people at the extremes. On the China side, the National Bureau of Statistics' annual communiqué publishes only the nationwide total employed population of 725.04 million (end of 2025), without breaking manufacturing out separately, and we were unable to obtain the sector-by-sector employment table from the China Statistical Yearbook.
This article therefore does not attempt a China-Japan comparison of manufacturing employment. When three statistical bases within a single country already differ by 2.7 million people, a cross-border comparison is meaningless.
9.3 Wages: A Comparison That Must Be Discounted
Wages are the comparison this chapter most wanted to make, and the hardest one to get right.
By each country's respective official source: the average annual wage of manufacturing employees at China's urban non-private units was 113,594 yuan in 2025 (107,987 yuan in 2024), equivalent to a monthly average of roughly 9,466 yuan; converted at the 2025 average RMB-to-USD exchange rate of 7.1429, that comes to roughly 1,325 US dollars per month. Japan's total cash earnings in manufacturing were 335,831 yen per month in June 2026; converted at the 2024 average yen-to-USD exchange rate of 151.48, that comes to roughly 2,217 US dollars per month.
By the raw figures, Japan's is roughly 1.7 times China's.
But that 1.7x figure needs three separate discounts applied.
First, the two statistics follow completely different methodologies: China's is an annual wage divided by twelve to get a monthly average, covering urban non-private units; Japan's is the current month's total cash earnings from the Ministry of Health, Labour and Welfare's Monthly Labour Survey, which includes overtime pay and allowances and swings sharply depending on which month bonuses are paid out — within that same survey, December 2025 hit 927,755 yen per month once year-end bonuses were factored in. Using the June figure to represent the full year understates the true level; using the December figure would overstate it.
Second, the exchange rate. The yen-to-USD average was 106.78 in 2020, 109.80 in 2021, 131.38 in 2022, 140.48 in 2023, and 151.48 in 2024. From 2021 to 2024, the average annual USD/JPY exchange rate rose by about 38%; put another way, the same amount of yen converted into about 27.5% fewer dollars in 2024 than it would have at the 2021 exchange rate. That is to say, if the same Japanese wage figure were converted at the 2021 exchange rate, its dollar value would be nearly four-tenths higher. A meaningful share of the China-Japan wage gap measured in dollars comes from exchange-rate movements, not from a change in purchasing power.
Third, the source this task originally specified as the best available — the Japan External Trade Organization (JETRO)'s Comparative Survey of Investment-Related Costs in Major Cities and Regions in Asia and Oceania — is one of the few primary sources that surveys Chinese and Japanese cities using the same methodology at the same time. We found the survey's search-tool page and confirmed that its city coverage lines up exactly (on the Japan side: Mito, Tokyo, Yokohama, Nagoya, Osaka, Kobe, and Fukuoka; on the China side: Guangzhou, Shanghai, Chongqing, Shenzhen, Chengdu, Suzhou, Dalian, Qingdao, Wuhan, and Beijing), but the tool requires interactive querying or a table download, and we were unable to extract absolute values from it in this round.
So the only conclusion this article can draw is: Japan's manufacturing wage level is higher than China's, on the order of one and a half to two times, but the precise multiple is heavily influenced by statistical methodology and by which year's exchange rate is used, so it should not be pinned down as a fixed number. At the same time, recall the shipbuilding cost table from Chapter 3 — for the specific product category of a 40,000-DWT bulk carrier, China's labor-cost index (23) is already higher than Japan's (20). Wage levels and per-unit labor cost are not the same thing; efficiency sits between them.
9.4 Exchange Rates: A Hidden Thread Running Through the Whole Article
The previous section already touched on exchange rates. Here we need to spell it out on its own, because its effects reach far beyond wages.
The five-year series of the yen's average annual exchange rate against the US dollar is:
| Year | Yen/USD (annual average) | Yen/USD (year-end) |
|---|---|---|
| 2020 | 106.78 | 103.33 |
| 2021 | 109.80 | 115.12 |
| 2022 | 131.38 | 132.14 |
| 2023 | 140.48 | 141.40 |
| 2024 | 151.48 | 157.89 |
For the yuan-to-dollar rate over the same period, we obtained only the 2025 annual average of 7.1429, down 0.3% year-on-year; we were unable to verify a reliable continuous primary-source series for 2021 through 2024 in this round, so it is not listed.
Now look back at Gardner Intelligence's table in Chapter 5. Japan's 2024 machine-tool output value was 7.9 billion US dollars. That figure converts the yen output value into dollars using the 2024 exchange rate. Converted at the 2021 exchange rate instead, the same yen output value becomes roughly 10.9 billion US dollars — a ranking that would jump from third to second, level with Germany, without Japan having manufactured a single additional machine tool.
The same logic applies to Japan's manufacturing value added. Under the Cabinet Office's national accounts, Japan's nominal manufacturing value added was 110.99 trillion yen in fiscal year 2024, 117.80 trillion yen in fiscal year 2023, and peaked at 119.24 trillion yen in fiscal year 2022. Converted at the 2024 average exchange rate, fiscal year 2024 comes to roughly 732.7 billion US dollars. Converted at the 2021 exchange rate, that same yen figure comes to roughly 1.01 trillion US dollars.
One apparent contradiction should be addressed in passing: the table in Chapter 2 puts Japan's 2024 manufacturing value added at roughly 788.5 billion US dollars, about 7% away from the 732.7 billion used here. Both are correct — the former comes from the World Bank's calendar-year series in current US dollars, the latter is this article's conversion of the Cabinet Office's fiscal 2024 yen figure at that year's average rate. The year basis (calendar year versus fiscal year) and the conversion method both differ; the two are not interchangeable, and they do not need to be reconciled. The same country, the same indicator, adjacent time windows — and a change of accounting and conversion method produces a 7% difference. For cross-country comparisons priced in dollars, that is the norm, not an anomaly. A 38% swing in the exchange rate can shift a country's manufacturing scale by an entire rung on the international rankings.
This is the concrete payoff of the fourth discipline this article laid down in Chapter 1. Whenever you see a claim of the form "Country A's manufacturing output exceeds/trails Country B's by so many US dollars," the first question to ask is: which year's exchange rate was used to calculate it?
In this sense, the tonnage figures in Chapter 3, the tonnage figures in Chapter 4, and the unit-count figures in Chapter 6 are all more stable than any dollar figure in this article — physical volume does not change because of the exchange rate. This is also why this article uses physical volume wherever it can.
9.5 R&D: One Comparable Statistical Basis and One That Is Not
Start with the comparable one. The World Intellectual Property Organization's statistics on PCT international patent applications for 2023: a global total of 272,600, down 1.8% year-on-year; of which China filed 69,610, accounting for 25.5% of the global total and ranking first; the United States filed 55,678, ranking second; Japan filed 48,879, accounting for 17.9% and ranking third; South Korea filed 22,288; and Germany filed 16,916. China and Japan together account for 43% of the global total.
This set of figures is highly comparable, because it is compiled by a single institution under a single set of rules. (One further note: the figure in China's National Bureau of Statistics communiqué that "in 2025 the China National Intellectual Property Administration, acting as a receiving office, accepted 78,000 international patent applications" is a receiving-office statistical basis, different from the applicant's-country-of-origin statistical basis used above, and the two must not be conflated.)
Now the incomparable one. China's total spending on research and experimental development across all of society in 2025 was 3,926.2 billion yuan, up 8.1% year-on-year, equivalent to 2.80% of GDP; of this, basic-research spending was 277.8 billion yuan, or 7.08% of the total. Japan's fiscal year 2023 R&D spending was 22.05 trillion yen, up 6.5% year-on-year, equivalent to 3.70% of GDP.
The two percentage shares can be compared directly: 2.80% versus 3.70%, with Japan running nearly a full percentage point higher. But the two absolute figures cannot be directly compared — one is in current-price yuan, the other in current-price yen, and converting either into dollars runs straight back into the exchange-rate problem from the previous section; converting into purchasing-power-parity dollars would require an entirely separate dataset, and we were unable to obtain a reliable, year-aligned version of it.
On the Japan side, there is one more structural figure worth recording: of the 22.05 trillion yen in R&D spending, the corporate sector accounted for 16.1 trillion yen, or 73.1%; and within the corporate sector's R&D spending, manufacturing accounted for 13.9 trillion yen. Of the corporate sector's 523,500 researchers, 83.0% (434,400 people) worked in manufacturing. Japan's total number of researchers nationwide was 907,400 (as of the end of March 2024).
Japan's R&D effort is heavily concentrated in manufacturing — more than eight-tenths of corporate researchers work in the manufacturing sector. This is the typical structure of a mature industrial nation, and it also explains why Japan has been able to hold its position in fine-grained components and materials over the long run: those positions are not held by scale — they are held by sustained R&D investment concentrated in the manufacturing process itself.
China's total number of researchers is not directly published in the National Bureau of Statistics communiqué, and this article does not supply a figure.
9.6 Infrastructure: An Asymmetric Comparison
The final set of figures comes from ports.
Among the top twenty container ports worldwide by throughput in 2024, China holds eight places: Shanghai ranks first with 51.506 million TEU; Ningbo-Zhoushan ranks third with 39.308 million TEU; Shenzhen ranks fourth with 33.38 million TEU; Qingdao ranks fifth with 30.87 million TEU; Guangzhou ranks sixth with 26.07 million TEU; Tianjin ranks eighth with 23.29 million TEU; Xiamen ranks fourteenth with 12.255 million TEU; and Taicang ranks eighteenth with 9.67 million TEU.
Japan holds zero.
In 2025, China's port cargo throughput was 18.3 billion tons (up 4.2%), of which foreign-trade cargo accounted for 5.7 billion tons; container throughput was 354.47 million TEU (up 6.8%). On land, 2025 rail freight turnover was 368.691 billion ton-km (up 2.8%), road freight turnover was 795.107 billion ton-km (up 3.5%), and total freight volume across all of society was 59.67 billion tons; total rail mileage was roughly 159,000 to 162,000 km (2024, with a slight discrepancy between sources), of which high-speed rail accounted for more than 50,000 km; and expressway mileage was 190,700 km (end of 2024).
We were unable to obtain a reliably dated, up-to-date version of the corresponding figures on the Japan side — total rail mileage varies by roughly 3,000 km between sources, expressway mileage was found only as of April 2018 at 9,429 km, and freight-turnover data broken down by mode was not obtained in this round. This article therefore does not attempt a quantitative China-Japan comparison of transport infrastructure, and keeps only the one set of port figures whose year and statistical basis are both clear.
Eight to zero in the ports is the most blunt set of figures in this chapter. It is not saying that Japan has no ports — Japan is an island nation with an extremely high density of ports — it is that the indicator of container throughput measures the total logistics volume of manufacturing and consumer markets. For a country to hold eight of the world's top twenty container ports means that a substantial share of the world's industrial goods either leaves from there or arrives there. This position points to the same underlying fact as the shipbuilding share in Chapter 3, the crude-steel share in Chapter 4, and the machine-tool output-value share in Chapter 5 — it is simply the same fact viewed from a different vantage point.
Chapter 10 Beyond the Numbers: Four Things Statistics Cannot Capture
The preceding chapters have measured everything that can be measured. This chapter is about the part that cannot be measured — not because no one bothered to look, but because the existing statistical systems are not designed, by their very construction, to produce this kind of number.
10.1 Capacity Utilization and the Order Cycle
Every output figure is "actual output," not "potential output." Between the two sits a utilization rate.
The steel chapter cited a global capacity utilization rate of 76 percent, a figure calculated by the OECD from its own capacity estimates. The shipbuilding chapter noted that Japan's order backlog at the end of August 2025 amounted to roughly 3.7 years of work. The machine tools chapter drew on order values published by the Japan Machine Tool Builders' Association, and turning an order into output value requires production scheduling in between.
Three industries, three different kinds of "time lag." Steel's utilization is instantaneous — when a blast furnace stops, it stops. Shipbuilding's scheduling runs in years — an order placed today does not become a completion until three to four years later. Machine tools sit in between, at several months to a year.
This lag means that data from the same year is not saying the same thing across the three industries. China's newly booked shipbuilding orders in the first half of 2026, up 173.1 percent year on year, reflect shipowners' judgment about capacity needs in 2029–2030; Japan's machine tool orders over the same period, up 35.7 percent year on year, reflect manufacturers' judgment about equipment investment over the next one to two years; and monthly steel output reflects actual production from the previous month.
Put the three side by side in a single table titled "China-Japan Manufacturing Comparison, First Half of 2026," and it reads as if it were describing one moment in time, when in fact it spans four years of expectation and reality. The time stamp on industrial data deserves more attention than its value.
10.2 Certification, Reliability, and the Thresholds Statistics Never Enter
Chapter 5 noted that we found no first-hand comparative data at all on mean time between failures or positioning accuracy for Chinese and Japanese machine tools. This is not an accident.
A large part of a machine tool's value lies in how much precision remains after eight thousand hours of continuous operation, how stable it stays across a given range of temperature and humidity, and how much spindle clearance develops after a hundred thousand tool changes. These metrics are not unmeasurable — it is simply that no neutral body measures and publishes them continuously on a cross-national statistical basis. Buyers judge for themselves, through trial use, peer reputation, and brand history.
Comparable thresholds exist in other industries too. A classification society's rules determine whether a ship can be insured and financed. Material certification cycles for pressure vessels, nuclear components, and aviation parts run in years. Automotive OEMs' supplier systems require audits through three stages — sample parts, small-batch production, and mass production. All of these are real components of industrial capability, but none of them appear on any output table.
This produces a situation this article has run into again and again: the numbers you can find measure "quantity"; the part you cannot find is usually "quality." The gap in average import/export prices in Chapter 4 and the unit-price multiple in Chapter 5 are especially valuable precisely because they are the price the market puts on a difference in quality — price is the only thing that can convert an unmeasurable quality gap into a number.
This also suggests a way of reading such figures: when you see a country exporting a large volume of a given category at a low unit price, do not rush to call it "low-end." A more accurate way to put it is that, in this category, it has not yet acquired the things that make buyers willing to pay more — that could be precision, could be service life, could be a service network, or could simply be time.
10.3 Stock and Depreciation: A Nation's Industry Has an Age
When annual output is tallied, no one tallies the stock. Yet manufacturing capability is, to a large degree, determined by stock.
The decommissioned Japanese blast furnaces from Chapter 4 are one example. A blast furnace takes years from the decision to build to first ignition, and once it is dismantled, that capacity is permanently gone. The curve of shipbuilding industry employment in Japan from Chapter 3 is another: 91,264 workers in 2016, 68,464 in 2022. A substantial share of the more than twenty thousand who left over that period were skilled workers with decades of experience, and once they retired, the hands-on know-how that never made it onto any blueprint disappeared with them. The term Japan's official documents use is "reduced production capacity due to the aging and retirement of skilled workers."
Now look at China. Chapter 3 noted that 2011 was the peak of the previous cycle in China's shipbuilding industry, followed by years of consolidation, before completions finally surpassed that peak again in 2025. During those years of consolidation, shipyards closed, workers changed trades, and process chains broke as well. The output curve returned to its starting point in 2025, but the people and the accumulated experience behind that curve are not necessarily the same ones.
The other side of stock is the age of equipment. The average service age of a country's operational stock of machine tools, the average age of its blast furnaces, the year its dry docks were built — cross-nationally comparable versions of this data are almost never available through public channels. Yet they largely determine, over the coming decade, who faces greater pressure to reinvest and whose technology will turn over faster.
Industrial capability has an age, and age is a dimension that statistics almost never capture.
10.4 The Lag Built Into the Data Itself
The last point, and the one most easily overlooked, is this: the most recent data available to us in August 2026 is, by its very nature, not "today."
The World Steel Association's World Steel in Figures 2026 cuts off in June 2026, and its content is mainly full-year 2025 data. Gardner Intelligence's world machine tool report, published in 2025, covers 2024 data. The International Federation of Robotics' World Robotics report typically lags by a year. The roadmap document issued by Japan's Ministry of Land, Infrastructure, Transport and Tourism in January 2026 uses employment data current as of April 1, 2025, and its cost comparisons use an even earlier base year.
In other words, the currency of the figures cited in this article ranges from three months to two years. In a period when orders can double year on year and output can fall ten percent year on year, a two-year lag is enough to make a conclusion obsolete.
There is only one way to handle this: label every figure with its year, and when making cross-industry comparisons, favor data from years that are close together. This article has tried to hold to that discipline in every chapter, though some comparisons still span different years — for instance, China's 2024 bearing-steel figures set against Japan's 2025 figures in Chapter 4. Every such cross-year comparison has been flagged, and readers should discount accordingly.
Taken together, these four points point to the same reminder: every table in this article is only a projection of industrial capability, not industrial capability itself. A projection shifts with the angle of the light, and that angle is the statistical basis.
Chapter 11 Ranges for the Trends, and the Assumptions Behind Them
This chapter offers directional judgments on four trend lines. All of the following are ranges and assumptions, not predictions. Each one states the premises under which it holds and the conditions under which it would not. What industrial research can do is lay out the variables clearly, not calculate the answer.
11.1 Shipbuilding: Orders Are Already Booked Past 2029 — the Question Lies Beyond That
The known facts are these: China's newly booked orders in the first half of 2026 totaled 121.06 million DWT, up 173.1 percent year on year — more, in half a year, than any full year's peak in history. Its order backlog at the end of June 2026 stood at 363.25 million DWT, up 54.9 percent year on year. On a CGT basis, China's new orders in the first half totaled 31 million CGT, or 72 percent of the global total.
Shipbuilding's scheduling cycle runs three to four years. This means the delivery peak corresponding to this batch of 2026 orders falls in 2029–2030. Before then, China's shipbuilding completion figures will most likely continue to rise — this is barely even a judgment; it is simply the arithmetic consequence of the orders already on the books.
The real variable lies beyond that delivery peak. Global newbuild orders show a clear cyclicality: 2024 was the largest annual order volume in seventeen years, 2025 fell 27 percent year on year, and the first half of 2026 rose again, 65.8 percent year on year. Swings of this magnitude suggest that the current high level includes a large share of replacement demand and renewal demand driven by new environmental regulations. Once this demand has been worked through, what level orders settle back to will depend on the trajectory of global trade volume, not on shipyard capacity.
The range on the Japanese side is narrower. Three premises apply: first, its share of newly booked orders has already fallen to 8 percent on a gross-tonnage basis (2024); second, the recovery in employment is being sustained by foreign labor; and third, Japan no longer builds high-value categories such as LNG carriers domestically at all. With these three premises holding, the reasonable trajectory for Japan's shipbuilding industry is to stabilize at its contracted scale — reducing internal competition through the consolidation of Imabari Shipbuilding and Japan Marine United, and concentrating limited capacity on the ship types where it still holds an advantage. Japan's official document is titled the "Shipbuilding Industry Regeneration Roadmap"; the word "regeneration" itself reveals how the responsible authorities assess the current state of affairs.
The condition under which this judgment would not hold: if global shipping capacity entered a new round of shortage and Chinese and South Korean yards' order books filled up to the point where they could no longer take on new work, Japan's share could rise passively simply because "no berths were available elsewhere." Share is a relative quantity; it depends not only on oneself but on whether everyone else is already full.
11.2 Steel: China's Question Is How Much to Cut, Japan's Is How Much to Keep
China's crude steel output has fallen for five consecutive years, from a 2020 peak of 1.065 billion tonnes to 961 million tonnes in 2025. The policy direction is clear: in 2025 the Ministry of Industry and Information Technology called for "precise regulation of capacity and output," with capacity replacement in key regions carried out at a reduction ratio of 1.5 to 1.
Assuming the policy direction stays the same and property-sector demand does not reverse, the reasonable range for China's crude steel output is continued slow decline. Monthly data from the first half of 2026 — down 13.9 percent year on year in January, up 0.4 percent year on year in June — shows substantial month-to-month volatility, but the annual direction is unchanged.
What is worth tracking is not the total but the structure: when the EAF steel share, currently 10.6 percent, begins to rise noticeably. That depends on two conditions — whether the social stock of scrap steel reaches the threshold for scaled-up recycling, and whether the relative relationship between electricity prices and scrap prices makes the EAF route economical. Neither condition is one the steel industry can determine on its own.
Japan's problem is of a different kind. Output has already fallen to 80.67 million tonnes, and the two major producers' blast furnace shutdown plans extend through fiscal year 2028, with a new electric furnace coming online as one blast furnace is taken offline. What is worth watching about Japan's steel industry over the next few years is the scale at which it stabilizes after contracting, and how high its EAF share rises. The plans already disclosed point toward a smaller Japanese steel industry, with a higher EAF share and greater reliance on exports and overseas investment.
The condition under which this would not hold: if China, for whatever reason, sharply cut its exports (which reached a record 119.0 million tonnes in 2025), global steel prices and trade flows would be reshuffled, the export environment for Japanese mills would improve markedly, and the pace of contraction described above could slow.
11.3 Machine Tools: The Phase Difference Between Two Curves
Cumulative orders reported by the Japan Machine Tool Builders' Association for January–June 2026 totaled 1.05501 trillion yen, up 35.7 percent year on year, with June alone surpassing 200 billion yen for the first time. Orders from China have exceeded 300 billion yen for two consecutive years, accounting for more than a quarter of external demand.
Between order and delivery lies a gap of several months to a year. So in the second half of 2026 through 2027, Japan's machine tool output value and exports will most likely rise, provided orders are not cancelled on a large scale.
On China's side, the machine tools and tooling industry recorded revenue of 1,057.1 billion yuan in 2025, up 1.6 percent, and total profit of 42.1 billion yuan, up 58.6 percent, with the profit margin recovering from 2.6 percent to 4.0 percent. Profit's elasticity is far greater than revenue's, which suggests the industry is only just recovering from an extremely low level of profitability, not entering a period of high prosperity.
The single indicator worth watching is the more-than-fivefold gap between import and export unit prices noted in Chapter 5. If that multiple narrows noticeably over the next three to five years, it would indicate a substantive shift upward in the tier structure of Chinese machine tools; if it fails to narrow, or even widens, then further gains in the output-value ranking would amount to nothing more than an accumulation of volume. We were unable to obtain updated data beyond 2024, and this is a statistical basis that needs continued tracking.
The condition under which this would not hold: the unit-price gap itself is affected by exchange rates and product mix. If the mix of models China exports shifts from economy-class toward the mid-range, the average export price will rise naturally, but that does not necessarily mean top-end capability has improved. A narrowing multiple cannot automatically be read as technological catch-up; it also has to be checked against whether the absolute number of imported units is falling in tandem.
11.4 Robotics and Equipment: The Numerator Is Rising, the Denominator Is Changing
China installed 295,000 new industrial robots in 2024, accounting for 54 percent of the global total; its operational stock surpassed 2 million units; and domestic manufacturers' share of the Chinese market rose from about 28 percent a decade ago to 57 percent.
Assuming manufacturing equipment investment does not fall off a cliff, the direction of these two curves — installation volume and domestic share — is clear. What calls for caution is the density metric — the revision from 470 to 166 discussed in Chapter 6 shows that as long as the denominator, manufacturing employment, keeps being revised, any international comparison based on density remains unstable. It is advisable to track numerator-type indicators such as installation volume and operational stock, rather than ratio-type indicators such as density.
On Japan's side, its robotics industry produced 207,000 units in 2025, with exports accounting for 82.1 percent of units shipped, while domestic shipments actually fell 18.3 percent. This structure means that the health of Japan's robotics industry is determined mainly by overseas conditions — especially the equipment investment cycles of China and North America.
The trajectory at the core-components layer is the hardest to judge, and the most important. The global landscape for precision reduction gears used in medium and large robot joints is still dominated by a single Japanese company (its own estimated share is about 60 percent), while Chinese manufacturers already hold more than 60 percent of the domestic market for harmonic drives. When these two lines converge at the medium-and-large robot joint segment is the single most worthwhile question to track over the next five years — but public data at this layer is extremely thin.
11.5 The Assumptions Shared by All Four Lines
All four judgments above rest on three shared premises:
First, that global trade and investment do not suffer a structural break. Shipbuilding depends on global shipping demand, machine tools and robotics depend on manufacturing equipment investment, and steel depends on construction and manufacturing steel demand — all three are functions of global demand.
Second, that no major new revision occurs to the statistical basis. The density example in Chapter 6 shows that a single revision to the denominator can move a ranking by nineteen places. Every trend judgment in this article is based on the current statistical basis; if that basis changes, the judgments need to be recalculated.
Third, that the direction of industrial policy remains continuous. China's output regulation and capacity replacement, and Japan's industry consolidation and structural reform, are both important components of the current trends.
Of the three premises, the first is the least controllable. The most honest thing this article can say is this: we cannot predict any of the three. All we can do is write them out, so readers know what the conclusions are hanging from.
Conclusion
After ten chapters of tables, one question comes naturally: so which country is stronger?
This article will not answer it. Not out of evasion, but because at the scale of manufacturing the question is wrongly put — it assumes there is a single universal scale, whereas what these ten chapters have shown, over and over, is the opposite: there are many scales, and switching scales switches the reading.
Start with the blanks that were left. The value per compensated gross tonne of ships built in China and Japan; Japan's average export price per tonne of steel; China's local content ratio for marine equipment after 2020; mean time between failures for Chinese and Japanese machine tools; the China–Japan split in servo systems — these five comparisons, the ones this article most wanted to make, were not made. They were not overlooked; they were deliberately left empty after being checked one by one. Where primary evidence meeting the standard could not be obtained, it is better to leave a row missing from a table than to pick a number out of a secondhand account and fill it in.
Leaving them empty is not a defect. In an age of abundant numbers, what is scarce is never the numbers but their preconditions. The example in Chapter 6 makes the point best: within seventeen months, the International Federation of Robotics moved the same indicator for the same country from 470 to 166, and its ranking from third in the world to twenty-second — for no other reason than that the denominator had been re-counted. Over the same period China's operational stock of robots passed two million units, annual installations hit a record high, and domestic manufacturers' market share approached six-tenths. Everything that happened in the numerator had nothing to do with that collapsing rank.
A number can invert a conclusion without a single fact having moved. That is the power of the statistical basis, and also the danger of misusing it. This article stumbled on the same ground itself: in Chapter 9, an early draft wrote the by-source generation figures in the wrong unit, off by a factor of one hundred; in Chapter 8, an early version of the R&D scoreboard table carried an absolute figure that did not reconcile with its own percentage. Neither was a failure of external information; both were a failure to run the internal arithmetic — an error that one division can expose ought to be exposed by one division before publication.
The same two-sidedness runs through the whole article. China's crude steel output is nearly twelve times Japan's, yet per capita it is less than 5% higher; China's machine tool output value is 3.5 times Japan's, yet each CNC machine tool it exports sells for one-fifth the price of an imported one; China's shipbuilding completions have ranked first in the world for sixteen consecutive years, while the latest official figure for the local content ratio of marine equipment dates from a decade ago. The scale has been built; the depth is still being built — quoting only the first half is complacency, quoting only the second half is self-deprecation, and only both together give the true shape of the industry.
Japan's side likewise takes two sentences. Its crude steel output has fallen out of the world's top three for the first time in 62 years; its share of new shipbuilding orders dropped from 18% to 8% within two years; it no longer builds LNG carriers domestically; and shipbuilding employment stopped falling only with the help of foreign workers. At the same time, close to eight-tenths of its machine tool output value is exported, more than eight-tenths of its robot shipments go abroad, more than seven-tenths of its construction machinery shipments go abroad, more than eight-tenths of its corporate researchers are concentrated in manufacturing, and it still holds most of the global market for the precision reduction gears used in the joints of medium and large robots. The aggregate is retreating while certain specific positions hold — writing only the first half underestimates it, writing only the second half overestimates it. And since 2023 a third sentence has to be added: a defense procurement demand measured in trillions of yen is supplying that shrinking-demand system with a new buyer, one insulated from the overseas capital-expenditure cycle.
The boundaries of this article should also be stated plainly. What it deals with is industry and institutions — capacity, statistical basis, structure, and the budget clauses and decision texts behind the procurement demand in Chapter 7. It makes no assessment of fighting power, no comparison of equipment, and no projection of war; industrial data cannot answer questions of that kind, and this article does not point in that direction. But laying out the facts and then declining to reach a judgment is not neutrality; it merely hands the judgment to the reader to guess at.
The judgments at the end of Chapter 7 are not repeated here. What is added is the one question they did not answer: what is different this time from 1945.
The difference does not lie in whose capacity is larger — all eleven chapters have argued that the word "capacity" first requires asking which ruler is being used. It lies in two other things. One is what the first ten chapters measured repeatedly: China today has an industrial and supply-chain capability of its own, complete across categories — crude steel on the order of a billion tonnes, more than half of world shipbuilding completions, first place in machine tool output value and in industrial robot installations — none of it dependent on any single external supplier. The other does not belong to the realm of industry, yet is harder than industry: the postwar international order, and the settled historical verdict on that war of aggression, are written into documents, and they do not change because a budget table moved in some given year.
Japan chose a path of peaceful development after 1945; its eighty years of economic achievement rest on that path, as does very nearly all of the industrial cooperation that has taken place across East Asia over these decades. History settled long ago what the other path leads to. Attempts to whitewash the history of aggression and attempts to resurrect militarism therefore warrant clear-eyed and sustained vigilance. And the expectation belongs here too: that Japan will stay on that path of peaceful development for a long time to come — the factories, the workers, and the markets of both countries would all be better for it.
For the coming decade, five figures are worth watching more closely than any aggregate ranking: whether the import-to-export unit price multiple for China's CNC machine tools narrows; when the electric arc furnace share of Chinese steel begins to climb in earnest; whether the global position in precision reduction gears for medium and large robot joints loosens; when China resumes disclosing the local content ratio for marine equipment; and on what statistical basis the contract value under Japan's Defense Buildup Program is carried forward once the program expires in 2027. None of the five is a ranking. All five are structure.
Which is to say: in the title "The Weight of Capacity," the word doing the real work is not "weight" but the act of weighing. Weight can of course be measured — but before measuring, the scale has to be put on the table: whose scale, calibrated in which year, measuring cargo or measuring labor. With the scale shown, a reading becomes a fact. Without it, a reading, however large, is only a number.
Sources and Key References
This article was written by the Tianxia Gongchang Industrial Research Institute. Its method: first-hand statistics from government departments, industry associations, and international organisations take priority, followed by the official financial reports and disclosures of listed companies; every figure is recorded together with its issuing institution, statistical basis, and data year; where an indicator has conflicting sources, the range is set out side by side rather than reconciled; derived values and institution-published values are presented in separate columns and never merged; and any claim for which primary evidence could not be verified is excluded from the body of the text. Key sources consulted include:
- The Tianxia Gongchang industrial platform's database of Chinese factories and industrial chain data (www.tianxiagongchang.com)
- World Steel Association, World Steel in Figures 2026 and its monthly crude steel production releases
- OECD Steel Committee, Chair's Statements from the 96th and 99th Sessions; Steel Outlook 2026; and Peer Review of the Japanese Shipbuilding Industry 2026
- Clarksons Research's Global Shipbuilding Review and Gardner Intelligence's World Machine Tool Report — neither original report was read directly for this article; the figures cited come from public reporting by specialist shipping and manufacturing media
- Maritime Bureau of Japan's Ministry of Land, Infrastructure, Transport and Tourism, Current State of the Shipbuilding Industry and a Roadmap for Its Revitalization (January 2026)
- Japanese industry association statistics: the Japan Iron and Steel Federation, the Japan Special Steel Association, the Japan Machine Tool Builders' Association, the Japan Robot Association, and the Construction Equipment Manufacturers Association of Japan
- Japanese official statistics: the Statistics Bureau of Japan's Statistical Handbook of Japan 2025, Bank of Japan foreign exchange rate tables, Cabinet Office national accounts, and the Ministry of Health, Labour and Welfare's Monthly Labour Survey
- Chinese official statistics and policy documents: the National Bureau of Statistics' annual Statistical Communiqué on National Economic and Social Development and China Statistical Yearbook, General Administration of Customs trade statistics, Ministry of Industry and Information Technology policy documents, and State Council Information Office press conferences (via national media reprints)
- Chinese industry association statistics and economic operation reports: CANSI, CISA, CMTBA, and the China Bearing Industry Association
- International organisations and public databases: World Bank Open Data, UN Comtrade, WIPO patent statistics, the International Federation of Robotics' World Robotics, and the European Commission Joint Research Centre's EU Industrial R&D Investment Scoreboard 2025; image licensing information comes from the individual file pages on Wikimedia Commons