China is both the world's largest wind power market and its largest wind turbine manufacturer.
In 2024, both of those titles were refreshed once again: single-year new installations reached approximately 87 GW, representing 65% of the global total; and for the first time in history, the four largest wind turbine manufacturers globally were all Chinese companies.
But behind that impressive scorecard lies a stark industry reality—turbine makers' profits have been squeezed to historic lows. Onshore turbine average bid prices fell to 1,381 yuan/kW, down more than 60% from the peak five years earlier. Goldwind's turbine segment gross margin was just 3.75%, Mingyang Smart Energy at 7.69%—while blade manufacturers, tower producers, and main shaft forging companies supplying those same turbines maintained gross margins of 15%–30%.
The "supply chain orchestrator" earns less than the parts suppliers who serve it—this is the most profound structural paradox of China's wind turbine industry today, and the starting point for understanding every competitive dynamic in the sector.
This report provides a comprehensive review of China's wind turbine industry: technology classification, global competitive landscape, policy environment, market scale, supply chain structure, key company financials and strategies, industrial cluster geography, segment trends, technology frontiers, risk profiles, and forecasts through 2026–2030.
Chapter 1 Definitions and Classifications: How a Wind Turbine Is Built
1.1 What Is a Wind Turbine System
A wind turbine system is a complete electromechanical assembly that converts wind energy into electrical power. The major structural elements visible from outside are the rotor blades, hub, nacelle, and tower; inside the nacelle are the main shaft, gearbox (or a direct-drive arrangement without a gearbox), generator, power converter, yaw system, pitch system, and main control system.
The rotor blades are the turbine's "wings." Modern large-scale blades range from 60 meters to over 130 meters in length, made primarily of glass-fiber reinforced composites or carbon-fiber composites; blade aerodynamic profile directly determines energy-capture efficiency. The three-blade configuration dominates today, balancing aerodynamic efficiency, structural stability, and manufacturing economics.
The nacelle is the turbine's "operations center," mounted on top of the tower and rotating via the yaw system to keep the rotor facing the wind. The nacelle's internal power-transmission path varies with technology choice—the core classification dimension for turbines.
The tower is the turbine's "backbone." Modern onshore tower heights range from 100 to 170 meters; offshore towers combined with monopile foundations can reach over 200 meters total. Higher towers access stronger, steadier wind resources above the atmospheric boundary layer—but bring greater transport, installation, and cost challenges.
1.2 Three Technology Pathways: DFIG, PMDD, and Semi-Direct Drive
By drivetrain structure, wind turbines divide into three main technology pathways, each directly affecting cost structure, reliability, and maintenance strategy.
Doubly-Fed Induction Generator (DFIG): the most widely deployed globally. A multi-stage gearbox steps the rotor speed from ~10–20 rpm up to ~1,000–1,800 rpm to drive a doubly-fed induction generator; the converter handles only ~30% of output power, keeping converter costs low. The mature technology and lighter nacelle weight make DFIG the mainstream choice for Vestas, Siemens Gamesa, Envision, and Windey. The gearbox is the mechanical wear nexus, requiring periodic oil changes and gear replacements.
Permanent Magnet Direct Drive (PMDD): the pathway championed by Goldwind. The rotor drives a low-speed multi-pole permanent magnet synchronous generator directly—no gearbox. A full-power converter handles all generator output. Eliminating the gearbox reduces mechanical losses and maintenance needs, especially valuable in difficult-to-service offshore environments. The trade-off is larger, heavier generators requiring more iron and permanent-magnet material.
Semi-Direct Drive (Medium-Speed PMSG): a middle path using one or two stages of low-speed gearing to bring rotor speed to ~100–300 rpm before driving a medium-speed PMSG. Compared with DFIG, fewer gear stages mean simpler, more reliable gearboxes; versus full direct drive, smaller, lighter generators. Mingyang Smart Energy and Dongfang Electric's large offshore turbines predominantly use this approach.
All three pathways coexist globally. The trend in recent years shows growing share for direct-drive and semi-direct-drive in large offshore turbines, where short maintenance access windows make low-maintenance designs increasingly critical.
1.3 Capacity Classification
Single-unit rated capacity is the most rapidly evolving dimension of wind turbine specification over the past decade.
Onshore turbines: 2–3 MW was mainstream a decade ago; 4–5 MW dominated 2022–2024 new builds; 6–8 MW procurement is accelerating in 2024–2025; 8–10 MW is the emerging trend for large-base sites in Xinjiang and Inner Mongolia.
Offshore turbines: 6–10 MW was mainstream through 2022; 12–16 MW became the offshore standard in 2023–2024; 18–20 MW prototypes proliferated in 2024; and 22–26 MW represents the 2024–2025 frontier, with Dongfang Electric's 26 MW machine setting the global single-unit capacity record.
The relentless capacity increase is the single most important driver of levelized cost of energy (LCOE) reduction: larger swept areas capture more wind energy while fewer turbines reduce per-unit installation, cabling, foundation, and operations and maintenance costs.
1.4 Onshore vs. Offshore: Installation Environment Classification
Onshore wind is the dominant category globally and in China. In 2024, China added approximately 80 GW onshore, accounting for over 90% of national additions. Resources are concentrated in the "Three North" regions (Inner Mongolia, Xinjiang, Gansu, Jilin, Heilongjiang) and the central-east-south provinces (Hunan, Guangxi, Yunnan, Guizhou). Average onshore LCOE has fallen to approximately 0.25–0.35 yuan/kWh, well below coal-fired generation benchmarks.
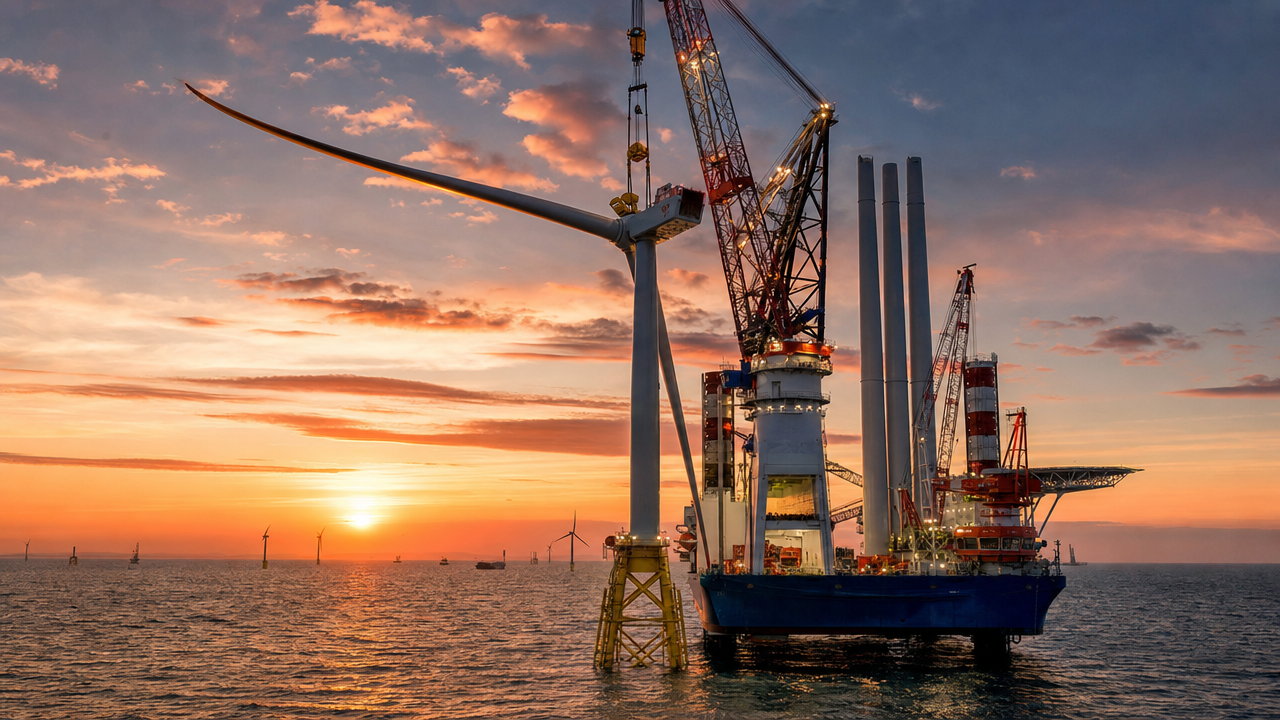
Offshore wind is the fastest-growing segment globally and the most policy-intensive in China. In 2024, China added approximately 7 GW offshore, bringing cumulative installations to over 40 GW, maintaining its position as the world's largest offshore fleet. Offshore turbines face saltwater corrosion, typhoons, and wave loads; reliability and maintenance accessibility requirements are far more demanding than onshore.
Floating offshore wind, designed for water depths exceeding 50 meters, is the emerging frontier. Mingyang Smart Energy has delivered a 16.6 MW floating prototype; commercial-scale floating development is expected to begin in earnest after 2028–2030.
1.5 Supply Chain Overview
The wind turbine value chain, from upstream to downstream: raw materials (steel, glass fiber, carbon fiber, copper, neodymium-iron-boron permanent magnets) → components (blades, towers, main shafts, gearboxes, bearings, converters, control systems) → turbine assembly → installation (installation vessels, cranes) → project operations (developers, grid operators).
Turbine OEMs occupy the "supply chain orchestrator" role—integrating upstream components, managing design and manufacturing, delivering to project developers. Yet OEMs are not the most profitable link in this chain. In 2024, turbine gross margins were typically 3%–10%, while well-positioned component suppliers (blade manufacturers, main shaft forgers) maintained 15%–30% gross margins. This inverted profit distribution—where the orchestrator earns less than its suppliers—is the defining structural feature of China's price-war era in wind power.
1.6 Key Turbine Performance Parameters
Rated power: maximum continuous output at rated wind speed, the primary naming convention.
Cut-in wind speed: the minimum wind speed at which the turbine begins generating, typically 2.5–3.5 m/s. Lower cut-in speeds allow low-wind-speed sites to generate meaningful energy.
Rated wind speed: the wind speed at which rated power is reached, typically 10–12 m/s.
Cut-out wind speed: the maximum allowable wind speed before shutdown, typically 20–25 m/s; typhoon-rated offshore turbines require special control modes.
Rotor diameter: determines swept area. The 2024 mainstream 6 MW onshore rotor diameter is approximately 180–200 meters; 16 MW offshore is approximately 230–252 meters; Dongfang Electric's 26 MW reaches approximately 280 meters.
Hub height: the hub center's elevation above ground, directly affecting available wind resource quality. Ultra-tall towers of 140–170 meters are standard in the low-wind-speed central-east-south markets.
Annual full-load hours: total annual generation expressed as equivalent hours at rated capacity—the primary economic performance metric. Onshore prime sites: approximately 2,500–3,200 hours; offshore: approximately 3,500–4,500 hours.
Availability: the fraction of annual time the turbine is available to generate, with leading OEMs now guaranteeing 97%–98.5%.
1.7 Repowering: Extending the Asset Life Cycle
Wind turbines are designed for 20-year service lives, but an increasing number enter "repowering" programs: old 1.5–2 MW turbines are replaced with modern 5–6 MW machines on the same land, dramatically increasing capacity without new land requirements. China's large wave of early-build onshore turbines—much of the capacity installed during 2012–2018—will approach end-of-life during 2032–2038, creating a new wave of equipment demand that supplements greenfield installations.
1.8 International Certification Standards
Commercial wind turbines must comply with IEC 61400 series standards (IEC 61400-1 for onshore, IEC 61400-3 for offshore) and obtain type certification from accredited bodies (DNV in Europe; CGC/CQC in China). Type certifications from DNV and accredited bodies are required for export to Europe, Japan, South Korea, and Australia—a meaningful entry barrier for Chinese OEMs expanding internationally.
Chapter 2 Global Competitive Landscape: China Claims the Top Four; European Giants Retreat
2.1 2024 Global Wind Power Installations: Another Record Year
In 2024, the global wind industry posted its strongest year on record. According to the Global Wind Energy Council (GWEC), total global new wind capacity additions exceeded 130 GW—a year-on-year increase of over 10% and the third consecutive annual record. China contributed approximately 86–87 GW, or roughly 65% of the global total.
Europe added approximately 20–22 GW in 2024, of which approximately 8–9 GW was offshore. The United States added approximately 7–8 GW; India approximately 7 GW (a fast-growing emerging market); and the remaining Asia-Pacific, Middle East, Latin America, and Africa regions combined for approximately 10–15 GW.
Global cumulative installed wind capacity at end-2024 reached approximately 1,100 GW, with China's 520 GW representing roughly 47%–50% of the world total.
2.2 Global Top Ten OEMs: China Claims the Top Four for the First Time
2024 marked a historic inflection in the global wind turbine competitive landscape: Chinese OEMs claimed the top four positions in global new installation rankings for the first time, taking six of the top ten slots with a combined market share of 62.75%.
Global Top Five by 2024 New Installed Capacity:
| Rank | Company | New Installations | Key Markets |
|---|---|---|---|
| 1 | Goldwind (002202) | 19.3 GW | Primarily China; 42 countries globally |
| 2 | Envision Energy (unlisted) | 14.5 GW | Primarily China; accelerating exports |
| 3 | Windey (300772) | 12.5 GW | Primarily China |
| 4 | Mingyang Smart Energy (601615) | 12.2 GW | Primarily China; Southeast Asia, Middle East |
| 5 | Vestas (Denmark) | ~10 GW | Primarily Europe and North America |
Goldwind's 19.3 GW made it the world's largest wind turbine supplier for the third consecutive year, with a global market share of approximately 15.9%. Vestas, at approximately 10 GW, remained in the top five but delivered only 52 MW in China in 2024—a dramatic retreat from its peak China installation years.
2.3 The Three European Giants and Their Challenges
Vestas (Denmark): In 2024, Vestas achieved revenue of EUR 17.295 billion, up 12.4% year-on-year, with an EBIT margin of 4.3%. Its order backlog reached a record EUR 68.4 billion at year-end, with 2024 order intake of 17 GW valued at a record EUR 19 billion in value terms. Vestas has strategically exited the intensely price-competitive Chinese market, focusing on Europe, North America, and India where service revenue (~35% of sales) supports better margins. Its 2025 revenue guidance of EUR 18–20 billion with EBIT margin of 4%–7% compares favorably with Chinese OEMs' 3%–8% turbine margins.
Siemens Gamesa (Germany/Spain): The most closely-watched distress story in wind energy in recent years. A batch quality failure on its onshore 4.X platform resulted in provisions exceeding EUR 4 billion during 2023–2024. Parent Siemens Energy required EUR 15 billion in German government credit guarantees in October 2023 to avert a liquidity crisis. In 2024, Siemens Gamesa pivoted its commercial focus to offshore wind—where its SG 14-222 DD direct-drive platform reclaimed the #1 global offshore position by new installations. Resolution of onshore losses remains uncertain.
GE Vernova (United States): Spun off from General Electric and listed independently in April 2024, GE Vernova's wind business focuses on North American onshore (Cypress platform) and the Haliade-X 12–14 MW offshore platform, which has faced cost overruns and delivery delays at multiple projects. The offshore wind segment remained in loss in 2024; 2025–2026 is described internally as the "path to offshore profitability." GE Vernova has minimal presence in China.
2.4 Chinese Turbine Exports: Accelerating Globalization
In 2024, China exported approximately 5,193.7 MW (~5.2 GW) of wind turbines—up 41.7% year-on-year and a new annual record. One in every six turbines manufactured in China was exported.
China's share of non-China market orders reached approximately 12 GW in 2024, or 28.6% of the non-China market (versus ~7% in 2022—quadrupling in four years). Primary export destinations included Southeast Asia (Vietnam, Philippines, Indonesia, Thailand), the Middle East and Central Asia (Saudi Arabia, UAE, Kazakhstan), Latin America (Brazil, Chile, Mexico, Argentina), and Africa (South Africa, Ethiopia, Morocco).
Chinese turbine export prices run approximately 20% below European competitors, a function of fully localized supply chains and scale economies rather than pure "low price, low quality" positioning.
2.5 The EU Foreign Subsidies Regulation Investigation
In April 2024, the European Commission launched an investigation under the Foreign Subsidies Regulation (FSR), examining whether Chinese wind turbine manufacturers—with Goldwind as the most prominent target—received market-distorting government subsidies when bidding on European projects. The investigation is expected to run through autumn 2027.
In January 2025, China's Ministry of Commerce determined that the EU's FSR investigation constituted a trade and investment barrier, citing approximately 7.6 billion yuan in lost contract bids and over 8 billion yuan in other affected projects. This regulatory standoff represents the most significant policy risk facing Chinese wind turbine exports in the near term.
Chapter 3 Policy Environment: Dual Carbon Targets, Offshore Planning, and Export Headwinds
3.1 Dual Carbon Targets: Wind Power's Deepest Policy Foundation
In September 2020, President Xi Jinping announced China's commitment to peak carbon emissions before 2030 and achieve carbon neutrality before 2060. This "dual carbon" pledge provides wind power with its deepest and most durable policy mandate.
Under this framework, non-fossil energy must reach 25% of primary energy consumption by 2030, with combined wind and solar capacity reaching at least 1.2 billion kW (1,200 GW). At the end of 2024, wind-plus-solar combined capacity already exceeded 1.15 billion kW—just one step from the target.
The 14th Five-Year Plan (2021–2025) is giving way to the 15th Five-Year Plan (2026–2030), which sets wind power new annual installation targets of no less than 120 GW per year—double the actual pace of the 14th Five-Year Plan period. The policy signal directly fueled the 2024 procurement rush: 123 GW of turbine bids in 2024 (up 91% year-on-year) as the industry front-loaded orders ahead of the 15th Five-Year peak cycle.
3.2 Grid Parity and the New Market Logic
In 2021, China's onshore wind power completed the transition to full grid parity—national subsidies were eliminated. This was a watershed for industry economics. With subsidies gone, LCOE became the sole metric driving developer procurement decisions, collapsing turbine price floors and pushing OEMs into a race to cut costs through larger capacity and scale.
The average onshore turbine bid price fell from approximately 2,200–2,500 yuan/kW in 2021 to approximately 1,381 yuan/kW by 2024—a 40%+ decline in just three years. Offshore wind's grid parity transition is expected in 2025–2026, after which subsidy dependency will largely end for near-shore fixed projects.
3.3 Desert-Gobi-Wasteland Mega-Bases: Reviving the Three-North Regions
Starting in 2021, the government designated a series of "Gobi Desert and Wasteland Large-Scale Base" wind and solar projects—abbreviated as "sago" bases—in Inner Mongolia, Xinjiang, Gansu, Ningxia, and Qinghai, bundled with dedicated ultra-high-voltage (UHV) transmission lines. The first tranche covers 100 GW; a second tranche of 200 GW is under planning. These bases prioritize large turbines (6 MW+) to minimize unit counts and feature 7–9 m/s annual average wind speeds.
3.4 Offshore Wind Policy: The "Dual 30 GW" Provinces
Offshore wind policy is largely driven by provincial governments. Guangdong, Jiangsu, and Fujian are the "Dual 30 GW" provinces:
Guangdong: 30 GW target by 2030; multiple 1 GW+ projects in procurement in 2024; Mingyang Smart Energy has established major offshore R&D and manufacturing bases in Shantou and Zhongshan.
Jiangsu: Currently China's largest offshore province by cumulative installed capacity (over 12 GW by end-2024); Yancheng's International Wind Power City is the premier offshore industrial cluster.
Fujian: China's best wind resources (8–10 m/s annual average) but deepest waters and highest typhoon exposure; Dongfang Electric's 26 MW turbine was first commissioned in Fuqing, Fujian.
3.5 Carbon Market and Green Certificates: Releasing Hidden Demand
China's national carbon market expanded in 2024 to cover steel, cement, non-ferrous metals, and petrochemicals—alongside existing power sector coverage. Rising carbon prices will increase industrial procurement of clean electricity. Green Power Certificate (GEC) trading volumes surged over 300% in 2024, driven by export-oriented manufacturers facing EU CBAM (Carbon Border Adjustment Mechanism) requirements. These trends create additional market-driven demand for wind power output beyond electricity price mechanisms.
3.6 Anti-Involution Policy: Temporary Price Floors
In the second half of 2024, as price competition reached extreme levels, the China Wind Energy Association (CWEA) coordinated voluntary commitments among OEMs to refrain from bidding below cost—a temporary price-support coalition. The mechanism's effectiveness was limited, but it signaled the beginning of a transition from unstructured to more disciplined competition. The National Development and Reform Commission has begun investigating anti-competitive pricing in the energy sector; regulatory pricing guidance is expected to follow, with direct implications for the timing of turbine price recovery.
Chapter 4 China Market Scale: 86 GW, 520 GW, and the Price Floor
4.1 2024 China Wind Power Installations: Historic Peak
China added approximately 87 GW of wind capacity in 2024 (installation basis)—80 GW onshore and 7 GW offshore. This was the single-year record for any country in history. On a grid-connection basis, approximately 82–86 GW was energized in 2024, bringing year-end cumulative installed capacity to approximately 520 GW—roughly equal to the total of all other countries combined.
China's 520 GW represents approximately 8%–10% of the country's total electricity consumption (wind power output was approximately 900 billion kWh in 2024 against national consumption of approximately 9.9 trillion kWh), and is equivalent to approximately 260 Three Gorges Dams in nameplate capacity.
4.2 2024 Procurement Volume: The 123 GW Signal
China's domestic wind turbine procurement reached approximately 123 GW in 2024—up approximately 91% year-on-year. Given the typical 12–24 month lead time from procurement to installation, 2024 procurement volume will primarily translate into 2025–2026 installations, pointing to a strong 100+ GW/year installation peak entering the 15th Five-Year Plan period.
4.3 Onshore: Three-North Plus Central-East-South
Inner Mongolia led national new additions at over 15 GW in 2024; Xinjiang added over 30 GW cumulatively during the 14th Five-Year Plan period. The Three-North regions boast 7–9 m/s annual average wind speeds, vast land, and large-scale project economics.
Central-east-south provinces (Hunan, Guangxi, Yunnan, Guizhou, Anhui, Jiangxi) have grown rapidly. These provinces feature strong local electricity demand that eliminates the need for long-distance transmission, and modern ultra-long blade/ultra-tall tower configurations have made their low-wind-speed sites economically viable. Hunan added approximately 5 GW in 2024; Guangxi approximately 4 GW.
Curtailment rates in Three-North provinces—approximately 5%–10% in Inner Mongolia, Xinjiang, and Gansu—remain a structural challenge, though the long-term trend is clearly downward as UHV transmission capacity expands.
4.4 Offshore: Acceleration Ahead
China added approximately 7 GW offshore in 2024, with cumulative capacity exceeding 40 GW. Against the 14th Five-Year Plan's original 65–70 GW target, actual 14th Five-Year offshore additions are projected at 40–45 GW—a shortfall of approximately 20–25 GW largely attributable to installation vessel constraints and local subsidy negotiation delays. That backlog will compress into the 2026–2027 installation window, supporting accelerated offshore growth in the near term.
4.5 Turbine Prices: The 1,381 Yuan/kW Floor
At approximately 1,381 yuan/kW, 2024's average onshore turbine winning bid price was the lowest on record—down 63% from the approximately 3,800 yuan/kW seen during the 2019 pre-deadline rush. The price collapse reflects: (1) new entrants adding capacity; (2) component localization cutting costs—main bearing localization alone reduced costs by approximately 50%; (3) continuing capacity scale-up improving unit economics; and (4) steel price retracement from 2022 highs. A brief rebound to 1,500–1,600 yuan/kW occurred in late Q4 2024 under the anti-involution self-discipline pact.
Offshore turbine prices averaged approximately 2,748 yuan/kW in 2024—a more moderate decline from ~4,800 yuan/kW in 2021.
4.6 Market Concentration: CR5 at 75%, CR10 at 98.6%
Of 13 OEMs with installed capacity in 2024, the top 5 captured approximately 75% and the top 10 approximately 98.6% of the market. This high concentration reflects the capital-intensive, technology-barrier-and-scale-economics character of turbine manufacturing. The three leading tiers:
| Tier | Companies | 2024 Installation Share |
|---|---|---|
| Tier 1 | Goldwind, Mingyang, Envision | ~50% combined |
| Tier 2 | Windey, SANY Renewable Energy, Envision Electric Wind | ~30% combined |
| Tier 3 | Dongfang Electric, CSSC Haizhuang, others | ~15%–20% combined |
4.7 The Inverted Profit Distribution Problem
The structural paradox at the industry's core: turbine OEMs—the supply chain orchestrators—post the lowest margins, while component suppliers with technical barriers maintain 2–4× higher profitability. Turbine makers are squeezed between powerful developers (price-maximizing buyers) and entrenched component specialists. Breaking out requires either vertical integration (self-manufacture blades and converters) or downstream extension (operations and maintenance services) or export market access to escape domestic price-war conditions.
4.8 Provincial Breakdown: Top Wind Power Provinces
Inner Mongolia led 2024 with over 15 GW new additions; Xinjiang second; Gansu, Ningxia, Jilin, Shandong, Guangdong, Hunan, Jiangsu, and Yunnan rounded out the top ten. Coastal provinces are increasingly driven by offshore; inland provinces by large-base onshore development. Seasonal concentration is notable—approximately 40%–50% of annual installations occur in Q4 (year-end rush), creating supply chain stress that the industry has long sought to address.
4.9 Developer Landscape: The Five Major Power Groups
The demand-side is dominated by the "Five Major Power Groups"—State Energy Investment (Guoneng), China Huaneng, China Datang, State Power Investment (SPIC), and China Huadian—which control approximately 55%–60% of China's wind assets. China Three Gorges Corporation, CGN, and China Resources New Energy are significant additional players. The high procurement concentration of these buyers is a primary structural driver of the intense price competition facing OEMs: five buyers account for perhaps 40–50 GW/year of procurement volume, giving them extraordinary negotiating leverage.
4.10 Wind Power vs. Coal: The Cost Competition That Drives Everything
China's onshore wind LCOE of 0.25–0.35 yuan/kWh (0.20 yuan/kWh at Three-North prime sites) is now meaningfully below benchmark coal power prices of 0.37–0.45 yuan/kWh. Even without subsidies, the economics of wind development are sound. Offshore wind at 0.45–0.65 yuan/kWh still requires provincial feed-in premiums; these are expected to narrow as turbine sizes continue to grow. The fundamental economic competitiveness of onshore wind against coal—unsubsidized—is the bedrock driver of China's continued high-volume installation growth.
Chapter 5 Supply Chain Breakdown: Component Profit Centers and Localization Achievements
5.1 Turbine Cost Structure
A 6 MW onshore turbine's ex-factory cost breaks down approximately as: blades ~20%–25%; tower ~15%–20%; generator ~8%–12%; gearbox ~8%–12% (if applicable); main shaft and hub casting ~5%–8%; converter ~5%–8%; control system and electrical components ~3%–5%; bearings ~4%–6%; bedplate and other structural parts ~5%–8%; assembly and testing ~3%–5%.
Blades and towers together account for approximately 40% of turbine cost; both are material-intensive, so steel and glass-fiber price fluctuations directly transmit to turbine manufacturing cost.
5.2 Blades: High-Barrier, Fully Localized
China's blade industry has achieved global leadership. 2024 blade market scale was approximately 50.7 billion yuan; the 2025 market is projected at approximately 64.4 billion yuan. Leading suppliers: Zhongcai Technology (002080)—the domestic leader at ~25%–30% market share; CRRC Times New Material (600458)—CRRC subsidiary with expanding capacity; and Zhongfu Lianzhong—specializing in large offshore blades.
Key technical trends: carbon fiber pultruded spar caps replacing fiberglass (25%–30% weight reduction); aerodynamic profile optimization for lower cut-in speeds; and pre-fabricated lay-up replacing manual layup. Transport constraints for 100-meter-plus blades (requiring segmented transport or specialized vehicles) represent the primary logistical challenge for onshore large-blade deployment.
5.3 Towers: Steel-Intensive, Domestically Dominated
Tower manufacturing has near-100% localization. The 2024 market was approximately 62.9 billion yuan. Key suppliers: Tianshun Wind Energy (002531)—the largest tower manufacturer; Taisheng Wind Power (300129)—specializing in offshore towers and jacket foundations; and Tianneng Heavy Industry (300569)—serving northern markets.
Tower competitiveness is driven by proximity to installation sites—large-diameter tubes (4–5 meters) are expensive to transport long distances. Hybrid concrete-steel towers enabling 170-meter-plus hub heights are gaining traction in low-wind-speed markets.
5.4 Main Shafts and Castings: The Forging Value Chain
The main shaft transmits all rotor torque and bending loads; demanding forging purity requirements make it one of the higher-barrier component categories. Jinlei Holdings (300443) holds approximately 40%–50% domestic market share in wind main shafts with 2024 revenue of approximately 2.5 billion yuan. Tongyou Heavy Industry (300185) covers large forgings including hub castings.
Main shaft bearings represent the most recently localized high-barrier component. Xinqianglian (300850) and others achieved batch production of main bearings in 2022–2024, with pricing approximately 30%–50% below imported equivalents. This localization milestone eliminated the last significant import-dependent component in the turbine BOM, further strengthening China's cost leadership.
5.5 Gearboxes: Advanced Transmission's High-Stakes Contest
Gearboxes serve the DFIG and semi-direct-drive markets. The 2023 domestic market was approximately 17.9 billion yuan. Nangao Gear (0658.HK)—the global wind gearbox leader with approximately 34% domestic market share in 2024—experienced severe financial difficulties (a reported loss of approximately 656 million yuan in 2024, with investigations into approximately 6.6 billion yuan in fund flows). Delija (603092), with 2024 revenue of approximately 3.715 billion yuan, is a focused gearbox specialist advancing an A-share IPO in 2025.
The structural pressure on gearbox demand from growing direct-drive and semi-direct-drive market shares is a long-term secular headwind for the traditional multi-stage gearbox market.
5.6 Converters: Power Electronics' Success Story
Converters are critical for grid-connected power quality control. Sungrow Power (300274)—originating in solar inverters—has built significant wind converter revenues (approximately 2 billion yuan in 2024). Hewang Electric (603063) holds approximately 30%–35% domestic converter share. As turbine capacity grows from 6 MW to 18 MW and beyond, per-unit converter value scales accordingly—single-unit converter prices have risen from approximately 200,000–300,000 yuan to 800,000–1,200,000 yuan over the past decade. Localization exceeds 85%.
5.7 The Chain's Profit Inversion: A Structural Feature, Not a Bug
Across the supply chain, turbine OEM gross margins (3%–8%) are systematically below component suppliers in technically differentiated segments (blades 15%–20%, main shaft forgings 25%–30%, converters 20%–25%). This is a structural feature of the price-war equilibrium: OEMs face direct developer price pressure and cannot pass it upstream to suppliers with real switching costs. The exit from this structure requires either vertical integration, service revenue development, or market access diversification via export.
Chapter 6 Key Company Profiles: Seven OEMs' 2024 Strategic Maps
6.1 Goldwind (002202): The Global Leader Anchor
Founded 1998, headquartered in Beijing. Goldwind pioneered the PMDD technology pathway in China and has maintained the domestic #1 position for 14 consecutive years.
2024 Key Financials: Revenue approximately 56.7 billion yuan (+12.4%); net profit approximately 1.86 billion yuan; domestic market share 22%; global new installations 19.3 GW; global footprint across 42 countries. In-hand orders exceed 40 GW.
Goldwind's strategic differentiation is the global rollout of direct-drive permanent-magnet technology across low-wind-speed central-east-south sites, high-wind-speed northern mega-bases, and offshore. Its ~6 GW self-owned wind farm operating portfolio generates ~30% of revenue from services and operations, buffering turbine margin cyclicality. Goldwind is the most globally diversified Chinese OEM, with installations in Australia, Chile, Pakistan, South Africa, and Ethiopia.
6.2 Mingyang Smart Energy (601615): Offshore Ambition and Its Costs
Founded 2006, headquartered in Zhongshan, Guangdong. Mingyang is China's signature offshore wind OEM and the most committed advocate of the semi-direct-drive technology pathway.
2024 Key Financials (estimated): Revenue approximately 280–310 billion yuan; net profit approximately 500–800 million yuan under pressure; global new installations 12.2 GW (global #4). Mingyang has the most advanced large offshore product lineup in China: 10–25 MW MySE models across a full capacity spectrum, with 16 MW and 22 MW in batch production and a 25 MW prototype commissioned. It is also the only Chinese OEM to have delivered a floating offshore prototype (16.6 MW, Zhanjiang, Guangdong, 2023).
Mingyang's aggressive export strategy spans Southeast Asia, Spain, South Africa, and Brazil—the largest export order book among Chinese OEMs. Risks include sustained profit pressure from long project cycles, high leverage, and European FSR uncertainty.
6.3 Envision Energy (Unlisted): The Digital Wager
Founded 2007, Wuxi, Jiangsu. China's only major unlisted OEM. 2024 revenue estimated at approximately 280–320 billion yuan; global new installations 14.5 GW (global #2).
Envision's core differentiation is "smart turbine + digital operations": its EnOS platform manages over 110 GW of energy assets; Envision turbines ship with extensive sensors and AI algorithms claiming 3%–5% incremental generation versus industry average under equivalent conditions. The unlisted status affords longer-horizon strategic flexibility, though it constrains balance sheet expansion relative to listed peers.
6.4 SANY Renewable Energy (688349): The New Entrant's Speed and Its Cost
Founded 2008 as SANY Group's wind business; listed on STAR Market in 2022. SANY is the archetypal "new entrant" story—from marginal player pre-2020 to top-five in four years.
2024 Financials: Revenue 17.792 billion yuan (+19.1%); net profit 1.812 billion yuan (-9.7%); new orders over 20 GW.
SANY's competitive strategy—lower price + faster delivery—appeals strongly to developer procurement committees. The weakest point: almost no offshore orders in 2024, missing the higher-margin offshore segment. The profit decline despite strong revenue growth vividly illustrates how the price war erodes OEM economics.
6.5 Windey (300772): The Hidden Champion of China's Interior
Headquartered in Hangzhou, Zhejiang, with primary markets in the interior—Inner Mongolia, Xinjiang, Ningxia, Gansu, Henan, Hunan. Windey is a major beneficiary of the mega-base policy.
2024 Key Metrics: Global new installations 12.5 GW (global #3); revenue approximately 14–16 billion yuan. Windey's competitive moat is deep adaptation to interior-specific conditions: ultra-cold models (designed for -40°C Inner Mongolia winters), high-altitude models (Yunnan-Guizhou plateau low atmospheric pressure), and desert dust-proofing (Xinjiang/Gansu wind sand).
6.6 Envision Electric Wind Power (688660): The Offshore Specialist in Loss
A subsidiary of Shanghai Electric Group (601727), listed on STAR Market in 2021. One of China's earliest offshore pioneers, Envision Electric Wind once held the largest offshore market share. 2024 revenue approximately 9–11 billion yuan; profitability: in loss (third consecutive year 2022–2024).
Parent company Shanghai Electric's 2021 financial scandal created ongoing capital constraints for its listed wind subsidiary. Envision Electric Wind's EW16000-252 (16 MW) machine has achieved batch delivery; restoration to profitability depends on stable offshore order volume and improvement in the parent's financial position.
6.7 Dongfang Electric (600875): The State-Owned Giant's 26 MW Ambition
Founded 1958, Chengdu. Dongfang Electric is a state-owned major power equipment maker, with wind positioned around offshore large-scale leadership.
Group 2024 revenue approximately 60 billion yuan; wind segment approximately 15%–20% of group revenue. Dongfang Electric's defining achievement: the world's first 26 MW offshore wind turbine, with the prototype commissioned at the National Offshore Wind Power R&D and Testing Base in Fuqing, Fujian in 2025. The 26 MW machine reduces unit capacity capital cost by approximately 5% versus 18 MW and increases annual generation by approximately 4%–5%, using a third-generation fully integrated semi-direct-drive design.
6.8 Shanghai Electric, CSSC Haizhuang, and Capital Market Dynamics
Shanghai Electric (601727), parent of Envision Electric Wind, is navigating post-scandal restructuring while maintaining core power equipment capabilities. CSSC Haizhuang, the CSSC group's wind OEM, carries the unique advantage of a parent-company shipbuilding group able to manufacture its own installation vessels—a strategic hedge against the installation vessel bottleneck.
Capital markets have assigned lower valuations to turbine OEMs (P/E of 12–22x) given sustained margin pressure; the investment thesis requires a 3–5 year view to capture the industry consolidation and pricing recovery cycle. Service-oriented OEMs (Goldwind, Envision) with >25% service revenue share command relative valuation premiums.
Chapter 7 Industrial Clusters: The Geographic Map of Wind Power Manufacturing
7.1 Why Industrial Clusters Are the Key to Understanding China Wind Power
Understanding China's wind turbine industry requires looking beyond OEM financial statements to the industrial clusters behind them—the dense concentrations of blade factories, tower yards, converter plants, casting shops, and installation vessel berths that collectively constitute the supply chain network.
China's wind manufacturing competitiveness has never resided in any single company—it is the collective competitive strength of a network of hundreds of factories spanning multiple geographic nodes. It is this network that enables Chinese OEMs to deliver turbines at speeds and prices European competitors cannot replicate.
Tianxia Gongchang platform data spanning hundreds of thousands of energy equipment and related manufacturing factories covers everything from coastal to inland China, from complete turbine assembly to specialized components—this factory network is the material foundation of China's wind power global competitiveness.
7.2 Jiangsu Yancheng: China's Offshore Wind Capital
Yancheng is China's most important offshore wind industrial cluster. The city possesses approximately 800 km of coastline, water depths suited for near-shore offshore development, and proximity to the Yangtze River Delta power market.
Dafeng Port in Yancheng hosts final-assembly bases for Goldwind, Mingyang, Envision, SANY, and (previously) Siemens Gamesa. Key component suppliers—Tianshun (towers), Zhongcai Technology (blades), Xinqianglian (bearings)—have also established production here, creating a complete "turbine + components + export port" cluster.
Jiangsu's cumulative offshore capacity exceeded 12 GW at end-2024, the national leader. The province plans approximately 20 GW additional offshore in the 15th Five-Year Plan period, with Dafeng as the center. The Dafeng port area alone has planned over 30 GW of offshore resource development—one of the largest offshore wind development zones in the world.
7.3 Guangdong Shantou: The Southern Offshore High Ground
Shantou has emerged as a top-tier offshore industrial cluster through its combination of over 30 GW planned offshore resources and the National Offshore Wind Power R&D and Testing Base affiliation. Mingyang Smart Energy has established a major offshore large-machine R&D and manufacturing base in Shantou; Dongfang Electric also maintains production there. Multiple 1 GW+ offshore projects in Jieyang, eastern Guangdong are under construction.
Across coastal Guangdong—Shenzhen for smart operations and digital platforms, Zhuhai and Zhanjiang for floating offshore support infrastructure, and Zhongshan as Mingyang's corporate home—a multi-pole offshore industrial ecosystem is emerging.
7.4 Fujian Putian: Typhoon Corridor Wind Power Hub
Fujian offers China's best wind resources (8–10 m/s coastal annual average) but faces the highest typhoon design standards, placing maximum demands on turbine reliability. Putian Xiuyu Port is Fujian's primary offshore export and manufacturing hub. Dongfang Electric chose Fuqing, Fujian for the global commissioning test of its 26 MW turbine—reflecting the combination of China's best test infrastructure and adjacent production capability.
Fujian has planned multiple 1-million-kW offshore bases (Pingtan, Putian, Zhangzhou), with combined planned capacity exceeding 40 GW—one of the most certain sources of 15th Five-Year Plan offshore additions.
7.5 Shandong Dongying: Onshore Component Manufacturing Base
Dongying hosts a dense cluster of casting companies (hub and bedplate iron castings), flange forgers (tower connection rings), and cable suppliers serving onshore wind. Bohai Strait offshore wind (Bozhong field) is also accelerating; Shandong's onshore large-base potential in Dezhou and Heze adds further manufacturing demand.
7.6 Beijing and Shanghai: R&D Command Centers
Goldwind's headquarters and R&D center in Beijing (Haidian and Changping) have been the crucible for direct-drive permanent-magnet technology development over two decades. Shanghai houses Mingyang's global R&D headquarters, Envision Electric Wind's key engineering teams, and Dongfang Electric's offshore research institute—making it China's densest offshore wind R&D city.
7.7 The Industrial Cluster Lesson: Localization Is the Moat
The core insight from China's industrial cluster geography: local supply chain density is the hardest-to-replicate component of Chinese OEM competitiveness. European turbine prices run 20%–30% above Chinese equivalents not primarily because of labor cost or technology differences, but because European OEMs lack China's dense collaborative cluster networks—they source blades from Asia, gearboxes from Germany, and converters from Denmark, bearing high cross-border integration costs.
Chinese OEMs can accommodate design modifications with supplier responses in weeks, not months. This supply chain agility is the "China speed" in wind power—and it cannot be purchased or legislated into existence; it took decades to accumulate.
Chapter 8 Segment Analysis: Four Key Competitive Dimensions
8.1 Onshore vs. Offshore: The LCOE Crossover
Onshore: average LCOE 0.25–0.35 yuan/kWh; Three-North prime sites as low as 0.20 yuan/kWh—well below coal benchmarks of 0.37–0.45 yuan/kWh. Offshore: approximately 0.45–0.65 yuan/kWh (near-shore fixed), rising to 0.8–1.2 yuan/kWh for deep-water floating. Offshore cost drivers: foundations (20%–30% of project cost), installation vessels (200–400 million yuan/day charter premium), subsea cables (15%–20% of project cost), and higher O&M unit costs (5–10× onshore). With 16–20 MW turbines deployed at scale, Chinese near-shore offshore LCOE could reach 0.35–0.45 yuan/kWh by 2027–2028, potentially achieving subsidy-free commercial viability.
Onshore is the high-volume "mass market" (multiple developers, frequent procurement, intense price transparency, 3%–8% OEM margins). Offshore is the "premium market" (concentrated developers, large project sizes 200 MW–1 GW, higher technical requirements, 10%–15% OEM margins, but longer capital cycles 18–36 months).
8.2 Scale-Up: Not Simply Bigger Is Better
The engineering economics of scale-up are nuanced. Doubling rotor diameter quadruples swept area and roughly doubles annual generation, while halving turbine count eliminates corresponding installation, cable, foundation, and O&M fixed costs. But root loads scale approximately as diameter cubed; fatigue life design complexity increases non-linearly; and installation vessels capable of lifting 26 MW nacelles (600–800-ton hub heights) are critically scarce. The price war and scale-up paradox: OEM R&D investment to deploy larger turbines runs into a price ceiling that transfers most of the LCOE benefit to developers rather than OEMs.
8.3 Domestic vs. Export: Two Business Models
Domestic: vast scale (80–100+ GW/year) but fierce price competition; 3%–10% gross margins; 13 OEMs competing for developer volumes. Export: smaller absolute volumes (China's 12 GW share of non-China markets in 2024) but 15%–25% gross margins; high market development costs; meaningful strategic value in brand-building and long-term global positioning. Four export market archetypes: (1) Europe—largest value but hardest to access (FSR); (2) Latin America—most developed: Envision in Brazil, SANY in Chile; (3) Southeast Asia—proximity advantage, Vietnam offshore potential; (4) Middle East/Central Asia—government-to-government projects, price-sensitive.
8.4 Technology Route Competition: DFIG vs. PMDD vs. Semi-Direct
DFIG currently holds approximately 55%–60% of onshore installations; PMDD approximately 25%–30% (Goldwind-led); semi-direct approximately 15%–20% (primarily large offshore). Forecast through 2030: onshore ratios relatively stable; offshore sees semi-direct and direct-drive combined share exceeding 80% by 2027—driven by the maintenance-access-premium argument in offshore environments.
8.5 Wind EPC: From Equipment Supplier to Turnkey Contractor
Leading OEMs (Goldwind, Windey, SANY) are expanding into wind farm Engineering, Procurement, and Construction (EPC) contracting—capturing blade/tower/cable/substation revenue alongside turbine sales, potentially 2–3× turbine-only revenue at improved consolidated margins. EPC deepens developer relationships but requires more working capital and introduces construction risk.
8.6 Low-Wind-Speed Markets: China's Unique Frontier
Chinese OEMs have developed turbines optimized for 5.5–7.5 m/s annual average wind speeds—sites previously considered uneconomic—through very large rotors (180–210 meter diameters for 4–6 MW platforms) and ultra-tall towers (140–170 meters). This capability has unlocked entire market segments in Hunan, Guangxi, Yunnan, and Guizhou that have no equivalent in Western wind energy. The same technology creates export opportunity in South and Southeast Asian low-wind-speed sites.
Chapter 9 Technology Evolution: From 18 MW to Floating Offshore
9.1 The Capacity Race: 18 MW to 26 MW in Five Years
In 2019, China's largest offshore turbine was in the 6–8 MW range. By 2024, Dongfang Electric had commissioned the world's first 26 MW prototype. The engineering breakthroughs enabling this leap include: CFD-optimized aerodynamic profiles and carbon-fiber pultruded spar caps enabling 130-meter-plus blades; third-generation fully integrated semi-direct-drive designs that integrate the main shaft and generator to reduce interface complexity under extreme loads; 4,000V+ medium-voltage collection reducing copper cross-section requirements at extreme currents; and modular nacelle designs improving installation vessel efficiency.
The forward trajectory: 18–22 MW to be offshore mainstream 2025–2026; 25–30 MW entering engineering in 2027–2028; 30 MW+ under feasibility study for post-2030.
9.2 Floating Offshore Wind: The Deep-Sea Jigsaw Piece
Floating wind unlocks water depths exceeding 50 meters—much of the viable resource in Fujian, Guangdong, and the South China Sea. Three primary floating foundation types: Spar-Buoy (deep-draft cylinder, gravity-stabilized, deep water 80m+); Semi-Submersible (three-/four-column floater, most flexible globally, Mingyang's choice); Tension Leg Platform (TLP, minimal motion, highest engineering risk).
Mingyang's 16.6 MW semi-submersible prototype (Zhanjiang, Guangdong, 2023) is the global largest-capacity deployed floating turbine and the most meaningful operational dataset from typhoon-affected waters. Current floating LCOE of 0.8–1.2 yuan/kWh will need to reach 0.45–0.55 yuan/kWh for commercial scale—a journey requiring 2028–2032 at minimum.
9.3 Digital Twins and Smart O&M
Operations and maintenance costs account for 25%–30% of the wind turbine lifecycle total. Digital twin platforms—real-time synchronized digital models driven by hundreds of on-turbine sensors—enable predictive maintenance (1–6 months advance warning for gearbox, main bearing, and pitch motor failures), yaw optimization, wake management, and remote health monitoring.
Envision's EnOS, Goldwind's WindOS, and Mingyang's MySE Cloud each serve as OEM-anchored SaaS platforms—opened externally to manage third-party turbine fleets, creating service revenue independent of new turbine sales. AI integration is accelerating: blade inspection by drone plus AI image recognition, LLM-assisted maintenance knowledge management, and multi-source sensor fusion for anomaly detection all progressed significantly in 2024–2025.
9.4 Wind-Storage-Solar Integration
Mega-base projects require co-located storage (typically 10%–20% of installed capacity for 2-hour duration). This policy mandate pushes OEMs toward system integration capabilities: designing and warranting wind-storage combined systems, coordinating wind-solar-storage dispatch, and providing holistic EPC delivery. Goldwind and Mingyang have built full-stack capabilities spanning turbines, storage, EPC, and O&M; smaller OEMs face increasing pressure to either partner or be left behind in bundled procurement.
9.5 LiDAR Preview Control and Next-Generation Aerodynamics
LiDAR-based feed-forward pitch control—scanning incoming wind fields 50–300 meters ahead to provide 2–5 seconds of advance warning—has been deployed on select commercial turbines by Goldwind and Envision in 2024. Estimated annual generation improvement: 1%–2%; fatigue load reduction: 3%–8%. Over a 20-year project life, these numbers represent meaningful economics.
Further ahead: high-temperature superconducting (HTS) generators could reduce 30 MW+ generator weight by 30%–50%, but commercial readiness is not expected before 2030. Plasma active flow control for blade aerodynamics remains laboratory-stage.
Chapter 10 Risk Profile: Price War, Offshore Construction, and Trade Barriers
10.1 Risk 1: The Price War and Industry-Wide Margin Risk
At 1,381 yuan/kW, onshore turbine prices have compressed OEM turbine segment margins to 3%–8%, with smaller OEMs potentially at or below cash cost. Any additional price decline or raw material reflation could push portions of the industry to operating losses. The structural root: 13 OEMs competing for concentrated developer procurement; developers with maximum pricing power; and no exit mechanism for excess capacity.
The base case expectation—pricing floors forming in late 2024, recovery to 1,500–1,700 yuan/kW by 2025–2026—depends on anti-involution coordination holding and the natural attrition of weaker competitors. Downside scenario: a new round of capacity expansion by scale-hungry competitors drives another leg down through 2027.
10.2 Risk 2: Offshore Installation Vessel Shortage
Installing a 16 MW+ offshore turbine requires vessels with main crane capacity exceeding 1,000 tons (ideally 3,000+ tons), hook height exceeding 150 meters, and DP3 dynamic positioning. Globally, fewer than 20 vessels of adequate capacity exist; approximately 8–12 operate primarily in Chinese waters. Given China's compressed offshore installation window (approximately 100–150 good-weather days per year, April–August), vessel schedule premiums are extreme. Dongfang, Zhaoshang Industry, and Jinhai Heavy Industry have orders for 3,000-ton-class installation vessels due 2025–2027; relief arrives—but pricing may remain elevated through 2026.
10.3 Risk 3: Overseas Trade Barriers
EU FSR: could force Chinese OEMs to exit European bids or post extraordinary financial guarantees. Long-term, a systemic FSR barrier may require Chinese OEMs to establish European manufacturing (as Chinese automakers are doing) to enter the market—significantly raising cost and time to market. US market: effectively closed to Chinese turbines via 232 tariffs and UFLPA supply chain scrutiny; not a near-term export target for any Chinese OEM. Emerging market local-content requirements: India (40% localization), Vietnam, and Indonesia require local manufacturing investment as a condition of market access.
10.4 Risk 4: Raw Material Price Volatility
Steel (60%–70% of turbine material cost) and copper are the major exposures. The 2024 hot-rolled coil price decline from ~4,200 to ~3,400 yuan/ton was favorable; a 2025–2026 rebound driven by stimulus-related construction demand could re-pressurize margins. Copper price at 70,000–80,000 yuan/ton in 2024 adds cost for generator windings and cables. Carbon fiber supply tightening—as large-blade demand scales—presents a medium-term risk to blade cost trajectories.
10.5 Risk 5: Curtailment and Grid Absorption
National average wind curtailment of approximately 3%–5% in 2024 represents improvement versus 17%–20% during 2016–2017 peak curtailment years; but Inner Mongolia, Xinjiang, and Gansu still see 7%–12%. Resolution requires UHV transmission buildout (multiple projects under construction 2025–2027), mandatory storage co-location, and demand-side response mechanisms. Expected improvement: Three-North curtailment below 5% by 2028.
10.6 Risk 6: Scale-Up Reliability Engineering
The Siemens Gamesa 4.X batch quality failure—a stark precedent—resulted in over EUR 4 billion in provisions. With Dongfang Electric's 26 MW machine having only one operating prototype, commercial reliability data is extremely limited. A turbine 5–8× the rated power of the 3 MW machines that constituted the bulk of China's early fleet carries failure mode consequences that are commensurately larger. The cost of a single blade replacement on a 26 MW machine may exceed 50 million yuan, including downtime losses. Responsible large-scale commercialization requires 3–5 years of prototype operating data.
Chapter 11 2026–2030 Forecast: Installation Peak, Export Surge, and Competitive Reshaping
11.1 China Installation Forecast: 100 GW Per Year as the New Normal
| Year | New Installations (GW) | Offshore (GW) | Offshore Share |
|---|---|---|---|
| 2025E | 100–110 | 10–12 | ~10% |
| 2026E | 110–120 | 12–16 | ~12% |
| 2027E | 115–125 | 15–20 | ~14% |
| 2028E | 120–130 | 20–28 | ~20% |
| 2029E | 125–135 | 25–35 | ~23% |
| 2030E | 130–140 | 30–40 | ~25%–30% |
Key assumptions: the 120 GW/year 15th Five-Year Plan target carries real policy binding force; offshore installations recover from installation vessel constraints as new ship deliveries arrive in 2026–2027; mega-base transmission buildout proceeds on schedule.
China's cumulative installed capacity is projected to reach approximately 1,200–1,300 GW by end-2030, maintaining roughly 45%–50% of the global total.
Global forecast: total global new installations approximately 140 GW in 2025E, rising to approximately 200 GW in 2030E, with a CAGR of approximately 7%–9%. Non-China markets grow at 10%–12% CAGR.
11.2 Offshore Share Rising: From 10% to 30%
Coastal provinces facing land constraints (Guangdong, Zhejiang, Fujian) have no meaningful onshore upside—offshore is the only new capacity option. The 14th Five-Year Plan's approximately 20–25 GW offshore backlog concentrates into 2026–2027. Fourth-generation installation vessels arriving in 2026–2027 ease construction bottlenecks. The 26 MW-class machine's commercial maturation will accelerate offshore buildout efficiency by reducing turbine count per project.
11.3 Turbine Price Recovery: Gradual Normalization
Base case onshore price trajectory: 2025E 1,400–1,600 yuan/kW; 2026–2027E 1,500–1,800 yuan/kW; 2028–2030E 1,600–2,000 yuan/kW. Prerequisites: weaker competitor attrition, developer acceptance of quality-reliability premiums, and regulatory pricing guidance. Offshore: 2,500–3,000 yuan/kW in 2025–2027; potential decline to 2,200–2,600 yuan/kW in 2028–2030 as scale economies mature.
11.4 Export Forecast: From 5 GW to 25 GW
| Year | Export Volume (GW) | Primary Markets |
|---|---|---|
| 2025E | 7–8 | Latin America, Southeast Asia, Middle East |
| 2026E | 10–12 | Latin America, Southeast Asia, Middle East, Africa |
| 2027E | 14–18 | Broad growth; marginal European improvement |
| 2028E | 18–22 | — |
| 2030E | 22–28 | Europe if FSR resolved could exceed expectations |
Growth drivers: non-China market wind CAGR of 10%–15%; Belt and Road policy financing support; improving Chinese OEM brand credibility; local manufacturing investments in key markets.
11.5 Scale-Up Trajectory: 2030 Machine Specifications
Onshore 2025E mainstream: 5–7 MW; 2027E mainstream (large-base): 7–9 MW; 2030E standard (Three-North): 8–10 MW (complex terrain: 5–7 MW constrained by transport). Offshore 2025E mainstream: 14–18 MW; 2027E mainstream: 18–22 MW; 2030E standard: 22–25 MW. By 2030, standard offshore turbines will be 3–4× the rating of 2020 offshore turbines—dramatically reducing per-MW unit count and fixed cost burden.
11.6 Consolidation: Towards Top-Five Dominance
The number of OEMs with new installations may contract from 13 today to 8–10 by 2030; the top-five market share may rise from current 75% toward 85%. Consolidation drivers: 20 MW+ R&D investment (5–10 billion yuan per new model) is unaffordable for small players; vertical integration requirements raise capital thresholds; export market development requires global service network scale.
Post-consolidation competition: the battleground shifts from "price" to "service"—who delivers better digital O&M, longer warranties, more comprehensive global service networks, and deeper systems integration will define the 2030-era competitive hierarchy.
11.7 Investment Value Assessment
Along the value chain, the highest risk-adjusted medium-term opportunity lies in technically differentiated components: main shaft forgings (25%–30% gross margins, stable market position), main bearings (localization just beginning, fastest domestic substitution trajectory), and converters (power electronics barriers, rising per-unit value). Turbine OEM investment is a longer-horizon thesis requiring conviction in the 2026–2030 consolidation and pricing recovery cycle before earnings power emerges.
11.8 AI and LLMs: Early Penetration of Wind Operations
AI-enhanced wind power forecasting (reducing prediction error from ±10%–15% to ±5%–8%), multi-modal fault diagnostics (combining vibration, electrical, thermal, and visual sensor streams), and LLM-assisted maintenance knowledge management are all progressing from pilot to commercial deployment in 2024–2025. These capabilities are important enablers of the service revenue model that will differentiate OEMs post-consolidation—not immediate turbine sales drivers.
Chapter 12 Conclusion: After the Price War, China's Wind Turbine Industry's Long-Term Position
12.1 A Necessary Pain
China's wind turbine industry in 2024 is experiencing growth-phase discomfort: record-high installations, record-low margins. A 26 MW world-record offshore turbine in one month, ruinous price competition in the next. Global market share gains in the morning, Brussels trade investigation in the afternoon.
This contrast is not unique to China wind—it is the standard experience of any renewable energy industry transitioning from subsidy dependency to market-price economics. The sequence is predictable: subsidy era (high margins, high growth, quality averaged away by volume focus) → grid parity transition (price war, margin compression, supply chain localization completion) → post-consolidation recovery (scale winners re-establish margins through services, vertical integration, export market access).
China is moving from the second phase into the third. The report's judgment: 2026 is the pivotal inflection year.
12.2 Three Enduring Competitive Advantages
First, full-supply-chain localization and cost leadership. From blades, towers, and gearboxes to converters and main bearings, Chinese OEMs now source nearly all critical components domestically. Supply chain coordination time is measured in weeks, not months. This "supply chain density" advantage keeps Chinese turbine costs 20%–30% below European equivalents—a gap that will not close via wage increases or exchange rate movements.
Second, the fastest technology iteration cycle in the world. From 6 MW offshore in 2020 to 26 MW in 2025—capacity quadrupled in five years. This pace is rooted in China's 80+ GW/year domestic installation base, which provides the world's largest real-world testing environment for turbine performance. The feedback loop is simply not replicable in markets deploying 5–10 GW/year.
Third, the scale moat built by industrial clusters. Yancheng's offshore cluster, Guangdong's coastal manufacturing base, Xinjiang and Inner Mongolia's mega-base supply networks—these are the crystallization of decades of infrastructure investment and cluster economics. Tianxia Gongchang platform data covering hundreds of thousands of real manufacturing factories reveals the true depth of this production network. From metal castings to power electronics, the factory collaboration web is the material foundation of China's wind power global competitiveness—and no competitor can buy or legislate it into existence within a decade.
12.3 Two Key Uncertainties
Uncertainty 1: The outcome of the EU FSR investigation (resolved by ~2027) will determine whether Europe—the single highest-value export market—is effectively closed to Chinese turbines in the medium term. A systemic barrier forcing European manufacturing investment would significantly increase the timeline and cost of European market access.
Uncertainty 2: The timing of the domestic profitability inflection depends on the pace of competitor attrition and effectiveness of anti-involution coordination. If a new wave of capacity expansion extends the price war into 2027, the consolidation payoff will be delayed and the attrition will be more severe.
12.4 Core Judgments
Near term (2025–2026): Installation peak is assured; OEM profitability improvement will be modest. Offshore volume acceleration improves product mix. Export grows steadily despite European constraints. This is a high-volume, thin-margin phase; the primary value is consolidating market position and deepening supply chain capabilities.
Medium term (2027–2028): Top-five concentration; onshore pricing recovery to 1,600–1,800 yuan/kW; offshore share exceeds 20%; exports surpass 20 GW, making China the world's largest turbine exporter (not just producer).
Long term (2029–2030): China's wind turbine industry enters a high-quality steady state—120–140 GW/year domestic installations, 25%–30% offshore share, 25+ GW exports. Margins improve from "thin volume" toward "technology-service dual-engine." Floating offshore begins commercial scale demonstration for the next growth cycle.
Structural judgment: China's true competitive moat in wind turbines does not reside in any company's income statement—it resides in a supply chain network built by millions of manufacturing factories. The price war will end. The supply chain depth is permanent.
Appendix China Wind Turbine Industry Key Data Reference
A.1 2024 China Wind Power Market Key Metrics
| Metric | Data |
|---|---|
| National new installations (installation basis) | ~87 GW |
| Onshore new installations | ~80 GW |
| Offshore new installations | ~7 GW |
| National cumulative capacity (year-end 2024) | ~520 GW |
| Global share | ~50% |
| Annual procurement volume | ~123 GW |
| Number of OEMs with installations | 13 |
| Top-5 market share combined | ~75% |
| Top-10 market share combined | ~98.6% |
| Average onshore turbine bid price | ~1,381 yuan/kW |
| Average offshore turbine bid price | ~2,748 yuan/kW |
| China turbine exports | ~5,193 MW |
| Export year-on-year growth | +41.7% |
A.2 2024 Global Wind Turbine Top Five
| Rank | Company | Country | New Installations | Global Share |
|---|---|---|---|---|
| 1 | Goldwind (002202) | China | 19.3 GW | ~15.9% |
| 2 | Envision Energy | China | 14.5 GW | ~11.9% |
| 3 | Windey (300772) | China | 12.5 GW | ~10.3% |
| 4 | Mingyang Smart Energy (601615) | China | 12.2 GW | ~10.1% |
| 5 | Vestas | Denmark | ~10 GW | ~8.2% |
A.3 Key OEM 2024 Financial Summary
| Company | Revenue (bn yuan) | Net Profit (bn yuan) | Turbine Gross Margin |
|---|---|---|---|
| Goldwind | ~56.7 | ~1.86 | 3.75% |
| Mingyang Smart | ~28–31 | ~0.5–0.8 | 7.69% |
| SANY Renewable | 17.79 | 1.81 | ~6%–8% |
| Windey | ~14–16 | ~0.3–0.5 | ~5%–8% |
| Envision Electric Wind | ~9–11 | Loss | ~3%–5% |
A.4 Key Component Market Scale (2024)
| Segment | Market Size | Key Companies | Localization Rate |
|---|---|---|---|
| Wind blades | ~50.7 bn yuan | Zhongcai Tech, Times New Material, Zhongfu Lianzhong | >95% |
| Wind towers | ~62.9 bn yuan | Tianshun, Taisheng, Tianneng | ~100% |
| Wind gearboxes | ~17.9 bn yuan | Nangao Gear, Delija, Chongqi | >95% |
| Wind main shafts | ~6–8 bn yuan | Jinlei Holdings, Tongyou Heavy | >90% |
| Wind converters | ~5–7 bn yuan | Sungrow, Hewang, Kenor | >85% |
A.5 China Wind Power 2026–2030 Core Forecast
| Year | New Inst. (GW) | Offshore Share | Exports (GW) | Onshore Price (yuan/kW) |
|---|---|---|---|---|
| 2026 | 110–120 | ~12% | 10–12 | 1,500–1,700 |
| 2027 | 115–125 | ~14% | 14–18 | 1,500–1,800 |
| 2028 | 120–130 | ~20% | 18–22 | 1,600–2,000 |
| 2030 | 130–140 | 25%–30% | 22–28 | 1,600–2,000 |
A.6 Policy Timeline
| Time | Event | Impact |
|---|---|---|
| 2021 | Onshore grid parity achieved | Subsidy eliminated; price war accelerates |
| 2021 | 100 GW sago base first tranche approved | Three-North peak cycle opens |
| 2023 | Anti-involution self-discipline pact | Temporary price floor |
| April 2024 | EU FSR investigation launched | European export constrained |
| October 2024 | Dongfang Electric 26 MW turbine commissioned | Offshore scale-up milestone |
| 2025 | 15th Five-Year Plan published (120 GW/year target) | Policy floor confirmed |
| 2026–2027 | 4th-gen installation vessels delivered | Offshore construction bottleneck eases |
| 2028–2030 | Floating offshore commercial demonstration | Deep-sea market opens |
Data Sources and Major References
Tianxia Gongchang Industrial Research Institute, based on Tianxia Gongchang industrial platform factory and supply chain data, supplemented by public records, official statistics, and authoritative media reporting. Primary data and factual sources include:
- factory data platforms industrial platform wind-power-related factory database (www.tianxiagongchang.com)
- Global Wind Energy Council (GWEC): 2025 Global Wind Report and annual Supply Side Data
- China Wind Energy Association (CWEA): 2024 wind power installation data
- National Energy Administration (NEA): annual wind power grid-connection statistics
- Goldwind (002202), Mingyang Smart Energy (601615), SANY Renewable Energy (688349), Windey (300772), Dongfang Electric (600875), Envision Electric Wind (688660): 2024 annual reports and public disclosures
- Vestas Wind Systems: FY2024 Annual Report and Investor Presentation
- BloombergNEF (BNEF): wind turbine market data reports
- Zhongcai Technology (002080), Tianshun Wind Energy (002531), Jinlei Holdings (300443), Delija (603092), Xinqianglian (300850): annual reports
- China Customs Administration: wind power equipment export statistics
- National Development and Reform Commission, National Energy Administration: policy documents and planning materials
- Xinhua News Agency, The Paper, Securities Times, 21st Century Business Herald, and other authoritative media reports