
Abstract
Look around the room you're sitting in: the air conditioner, the refrigerator, the fan, the elevator, the pump room downstairs — inside almost everything that spins, there is at least one electric motor. According to the International Energy Agency (IEA), motor-driven systems consumed 53% of global electricity use in 2023; in China, an installed base of roughly 3.27 billion kW of motors consumes more than 4.5 trillion kWh a year, accounting for three-quarters of industrial electricity consumption. Yet this ubiquitous industry has almost no brand a consumer could name — the motor is the ultimate illustration of the phrase "ubiquitous and high-volume" (量大面广): it is everywhere, so no one pays attention to it; it is too mature a technology, so it has stayed cheap for a long time. Now, energy-efficiency regulation is forcing it to save power, while new-energy vehicle drive systems and the joints of humanoid robots are pushing it onto the stage where unit prices are highest and precision demands are greatest — this 150-year-old craft is undergoing its plainest and its most cutting-edge transformation at the same time.
This report's core judgments:
- The structural shift toward "declining volume, rising value" (量减价升) has already taken place. Output of AC motors fell from a 2021 peak of 405.018 million kW to 349.885 million kW in 2025, even as industry revenue and profit kept recovering (profit at 3,802 above-scale enterprises grew +22.8% in the first three quarters of 2025); the share of high-efficiency energy-saving motors in output leapt from 39% to 73% over three years — the energy-efficiency changeover is switching the industry from "counting units" to "counting value."
- The club of global giants is being reshuffled. Brazil's WEG overtook ABB for the first time to claim the No. 1 spot in global low-voltage motors with a 16% share; Nidec, the world's largest motor maker, announced its withdrawal from the automotive e-drive business amid an accounting scandal and massive impairment charges; Siemens' century-old motor lineage changed hands to a private-equity buyer for €3.5 billion. A loosening competitive order is precisely the window for challengers.
- New-energy vehicle e-drives are the largest segment by scale and the hardest one in which to turn a profit. China's new-energy passenger vehicle e-drive installations reached 7.758 million units in 2024 (+41.72%), but BYD's in-house supplier FinDreams alone accounted for nearly a third of that, and third-party supplier Jing-Jin Electric did not post its first profit since listing until 2025.
- Humanoid robots are the "most expensive stage" — and also the site of the widest gap between narrative and reality. Capital-market narratives run into the hundreds of billions of RMB, yet China's entire market for frameless torque motors was worth just RMB 209 million in 2024; Tesla's Optimus had an annual target of 5,000 units but actual output of only a few hundred — the gap itself is the conclusion.
- The policy calendar is the demand calendar. The Motor Energy Efficiency Improvement Plan (2021–2023) was fulfilled ahead of target (the share of high-efficiency motors in the installed base reached the 20.2% goal), demonstrating the execution power of China's energy-efficiency policy; the IE5 standard takes effect in October 2025, and the new target of a 35% share for newly added energy-saving motors by 2028 sets the most certain replacement-demand cadence for the next five years.
Key figures at a glance: micro and special motors output reached 16 billion units in 2025, with total industry output value of roughly RMB 290 billion (industry-association basis); China's share of global micro and special motor sales revenue is 33.3%, trailing Japan's 40.8%; Wolong Electric ranks first globally in explosion-proof drives; the EU has mandated IE4 for 75–200kW motors since July 2023, one tier above China's IE3 floor.
Chapter 1: The Electric Motor — Definition, Classification, and the Industry Chain
1.1 What Is an Electric Motor: The Universal Power Source Hidden Behind Every Rotation
The compressor in the air conditioner at home, the fan in the study, the traction machine in the neighborhood elevator, the pump in an office building's central air-conditioning system, the conveyor belt running in a factory workshop, the mechanism behind a traffic signal, the light buzz when a phone vibrates — wherever something is spinning, there is very likely an electric motor behind it. An electric motor is a device that converts electrical energy into mechanical energy to drive a load into rotary or linear motion; its underlying principle traces back to electromagnetic discoveries of the early nineteenth century, but as the universal power component of modern industry, its presence is almost invisible: no one ever sets out to buy something for the sake of the "motor" category itself — people buy air conditioners, cars, washing machines, machine tools, robots — and the motor always stays hidden inside the housing of these finished products, doing work that is never seen.
This state of invisibility is precisely the first key to understanding the motor industry. Unlike chips or batteries, it has not been pushed into the spotlight in recent years, nor does it, like new-energy vehicles, face end-consumer brand awareness directly. Instead, it is an embedded, universal power component absorbed wholesale by downstream manufacturing — its penetration is so broad that it covers nearly every manufacturing category from heavy industry to consumer electronics; its applications are so varied, spanning from kilowatt-class to milliwatt-class, from industrial spindle motors that run continuously for tens of thousands of hours to disposable toy motors, that the range of specifications alone is enough to make the very term "motor industry" feel too coarse a generalization. Understanding this old craft requires starting with what it actually is, how it can be classified, and what kind of industry chain it sits on.
Lining up the universal supporting components of manufacturing makes the motor's distinctiveness clearer. Bearings, fasteners, and seals are likewise hidden inside almost every piece of machinery, but they are passive structural parts — they consume no energy and merely bear force and wear. The motor is different: it is an active energy-conversion device that does work the moment it is powered on, which means it is not merely a component but the energy entry point behind nearly every rotary or translational motion. This difference is what gives the motor a far greater weight in manufacturing's cost structure and energy-consumption structure than its category's name recognition would suggest — the precise scale of its power consumption will be laid out with exact figures later; here the point is simply to establish "energy entry point" as a frame of reference.
1.2 Scope Statement: Focused on Electric Motors, with Generators Addressed in Passing
In engineering usage, the term "electric machine" (电机) actually covers two categories of energy-conversion devices that work in opposite directions: the electric motor, which converts electrical energy into mechanical energy to drive a load into rotation, and the generator, which converts mechanical energy into electrical energy to supply a grid or a load. The two are highly similar in electromagnetic structure — they can even share the same core and windings — and are essentially mirror images of one another: for the same rotating electric machine, running current through it to drive the rotor is how it works as a motor, while having an external force turn the rotor to produce power is how it works as a generator. This reversibility of bidirectional operation is one of the most fundamental physical properties of rotating electric machines.
This report focuses on the "power-consuming" side — the electric motor that draws electricity to drive a load into rotation. It is the ubiquitous, high-volume subject that penetrates nearly the entire downstream of manufacturing, and it is the core object of this report's analysis of market size, competitive landscape, and industrial clusters. The generator side — especially categories tightly bound to power-generation scenarios such as wind power and thermal power — has its own independent industry logic, customer structure, and business cycle; wind-power generators have already been covered by a dedicated study, so this report does not expand on them and will only touch on them briefly where needed in the sections on the industry chain and the global landscape. Another boundary that needs to be drawn clearly concerns the servo motor — in principle, it belongs to a high-precision branch of the electric-motor family, and this report discusses only the structure and market position of the servo motor itself; the driver, controller, and industrial-automation ecosystem built around servo systems fall within the scope of a separate dedicated report and are not expanded upon here.
1.3 Classification by Operating Principle: Six Technology Paths from Induction to Servo
The first dimension for classifying electric motors is electromagnetic principle and control method — this determines how a motor turns, and in turn what kind of equipment it is suited to.
- Induction motor (asynchronous motor): once the stator winding is energized, it produces a rotating magnetic field; the rotor develops eddy currents through electromagnetic induction and is dragged into rotation, with rotor speed always lagging slightly behind the field's synchronous speed — hence "asynchronous." Structurally it has no brushes and no permanent magnets, and works with nothing more than a squirrel-cage or wound rotor. Rugged, low-cost, and easy to maintain, it is the highest-volume category of electric motor in industry and is the near-universal default for continuously running loads such as water pumps, fans, compressors, and conveyors.
- Permanent magnet synchronous motor (PMSM): permanent magnets — usually NdFeB rare-earth magnets — are embedded in the rotor, allowing it to stay in sync with the stator's rotating field without relying on slip. This eliminates the slip losses inherent to induction motors, giving it markedly higher efficiency and power density. It is the mainstream choice on the energy-efficiency upgrade path, and it is by far the dominant technology route for new-energy vehicle drive motors.
- DC motor: brushes and a commutator feed external direct current into the rotor winding, producing continuously commutated torque that drives rotation. It offers fast speed-adjustment response and simple control circuitry, and was the first motor form to achieve industrial-scale speed regulation; but the mechanical wear of brushes and commutator limits its service life and maintenance-free operation, and outside low-cost, low-speed applications it is now being gradually displaced by brushless solutions.
- Brushless DC motor (BLDC): replaces mechanical brushes and commutator with electronic commutation — a driver chip paired with Hall-effect sensors or sensorless detection algorithms. It retains the fast response and simple speed control of the DC motor while eliminating brush wear and the risk of sparking, delivering substantially higher efficiency and longer service life. It is widely used in home appliances, power tools, drones, and electric two-wheelers.
- Stepper motor: rotates through a fixed angle step by step in response to input pulse signals, achieving relatively precise positioning with open-loop control alone — no feedback loop is required, and cost is low. But it is prone to losing steps at high speed or under sudden load changes, and is commonly found in printers, CNC machine-tool feed axes, and positioning/feeding stations on automated production lines.
- Servo motor: forms a closed-loop control system together with position-feedback elements such as encoders, enabling precise control of the rotor's position, speed, and torque. Its dynamic response and control precision far exceed those of the open-loop stepper motor, making it the core actuator in high-end automation equipment such as industrial robots, CNC machine tools, and semiconductor equipment — as noted above, this report addresses only its positioning as a motor category, leaving the surrounding control ecosystem to a dedicated report.
The six paths are not a sequence of mutual replacement so much as a map of distinct ecological niches: the induction motor holds the low-cost, durable bulk of the installed base; the permanent magnet synchronous motor represents the technological frontier of efficiency and power density; the DC motor is ceding ground to brushless solutions; and the stepper and servo motors respectively guard the two ends of low-cost open-loop positioning and high-precision closed-loop control. This is precisely why the forces of energy-efficiency upgrading, new-energy drive systems, and precision automation have each gravitated to a different technology path to carry them forward — the classification at the level of operating principle has, in effect, already mapped out the battlefields for the later chapters on the competitive landscape and technological evolution.
1.4 Classification by Application: From Kilowatt-Class Industrial Motors to Fingernail-Sized Micro and Special Motors
Classification by principle answers how a motor turns; classification by application answers where it is installed and for whom it turns — this is the breakdown that market participants are more accustomed to using, and it maps more closely onto the actual structure of the industry chain and competitive landscape.
- Industrial motors: general-purpose power units built mainly around small and medium-sized induction motors, serving continuously running industrial loads such as pumps, fans, compressors, conveyors, and machine tools; there are also dedicated categories such as high-voltage motors and explosion-proof motors aimed at specific settings like power utilities, chemicals, and mining, which carry higher specification requirements for insulation class and explosion-proof construction. This layer is the most standardized, most directly competitive commodity market in the motor industry, with relatively low per-unit value.
- Micro and special motors: a collective term for micro motors and special-purpose motors, covering home-appliance motors, automotive window-lift and wiper motors, phone vibration motors, drone motors, toy motors, and the like. Per-unit power is typically measured in watts or even milliwatts, but the range of applications is extremely fragmented and product iteration is extremely fast, making this the broadest layer of the motor industry by application spread and the largest by number of model variants.
- Vehicle drive motors: the power heart of new-energy vehicles, with the permanent magnet synchronous motor as the mainstream technology route, tasked with converting the electrical energy of the traction battery into wheel torque. It is the fastest-growing, most technologically intensive, and most capital-market-watched segment of the motor industry in recent years, and process innovations such as hairpin windings, oil cooling, and high-voltage platforms are concentrated in this application.
- Traction motors: the drive power for rail transit, especially high-speed rail trains, and one of the nine core technologies of China's high-speed rail. At the same power rating, permanent magnet traction motors are more compact and more energy-efficient than conventional induction traction motors. This sits near the top of the motor-technology pyramid, one of the few closed tracks dominated by state-backed national teams and almost never open to outside procurement.
It is worth noting that classification by principle and classification by application are not two independent axes but a cross matrix — the same application scenario can often be realized through multiple technology paths: industrial motors include both commodity-grade induction motors and higher-efficiency permanent magnet synchronous upgrades; micro and special motors include both BLDC-powered home-appliance fan motors and stepper-motor-powered printer and automated-line positioning axes; vehicle drive motors are almost uniformly on the permanent magnet synchronous route, while traction motors are rapidly switching from induction to permanent magnet. It is precisely this cross matrix that gives the motor industry's sub-markets combinatorial growth — multiplying six technology paths by four application categories is only the coarsest grid; the range of specifications and models actually present within the industry is far denser than this grid suggests.
Behind the four application categories lie four entirely different business logics: industrial motors are a red ocean fought over existing volume; micro and special motors are an economy of scale built up from fragmented orders; vehicle drive motors are a new battlefield driven jointly by capital and technology; and traction motors are a strategic national asset within a near-monopolistic structure. A single company can well be active across two or three of these layers at once — this is exactly the complexity that the later chapter on the competitive landscape will unpack; here we only build the skeleton, without filling in the numbers.
1.5 The Industry Chain in Full: From Silicon Steel, Copper, and Magnets to the Whole of Downstream Manufacturing
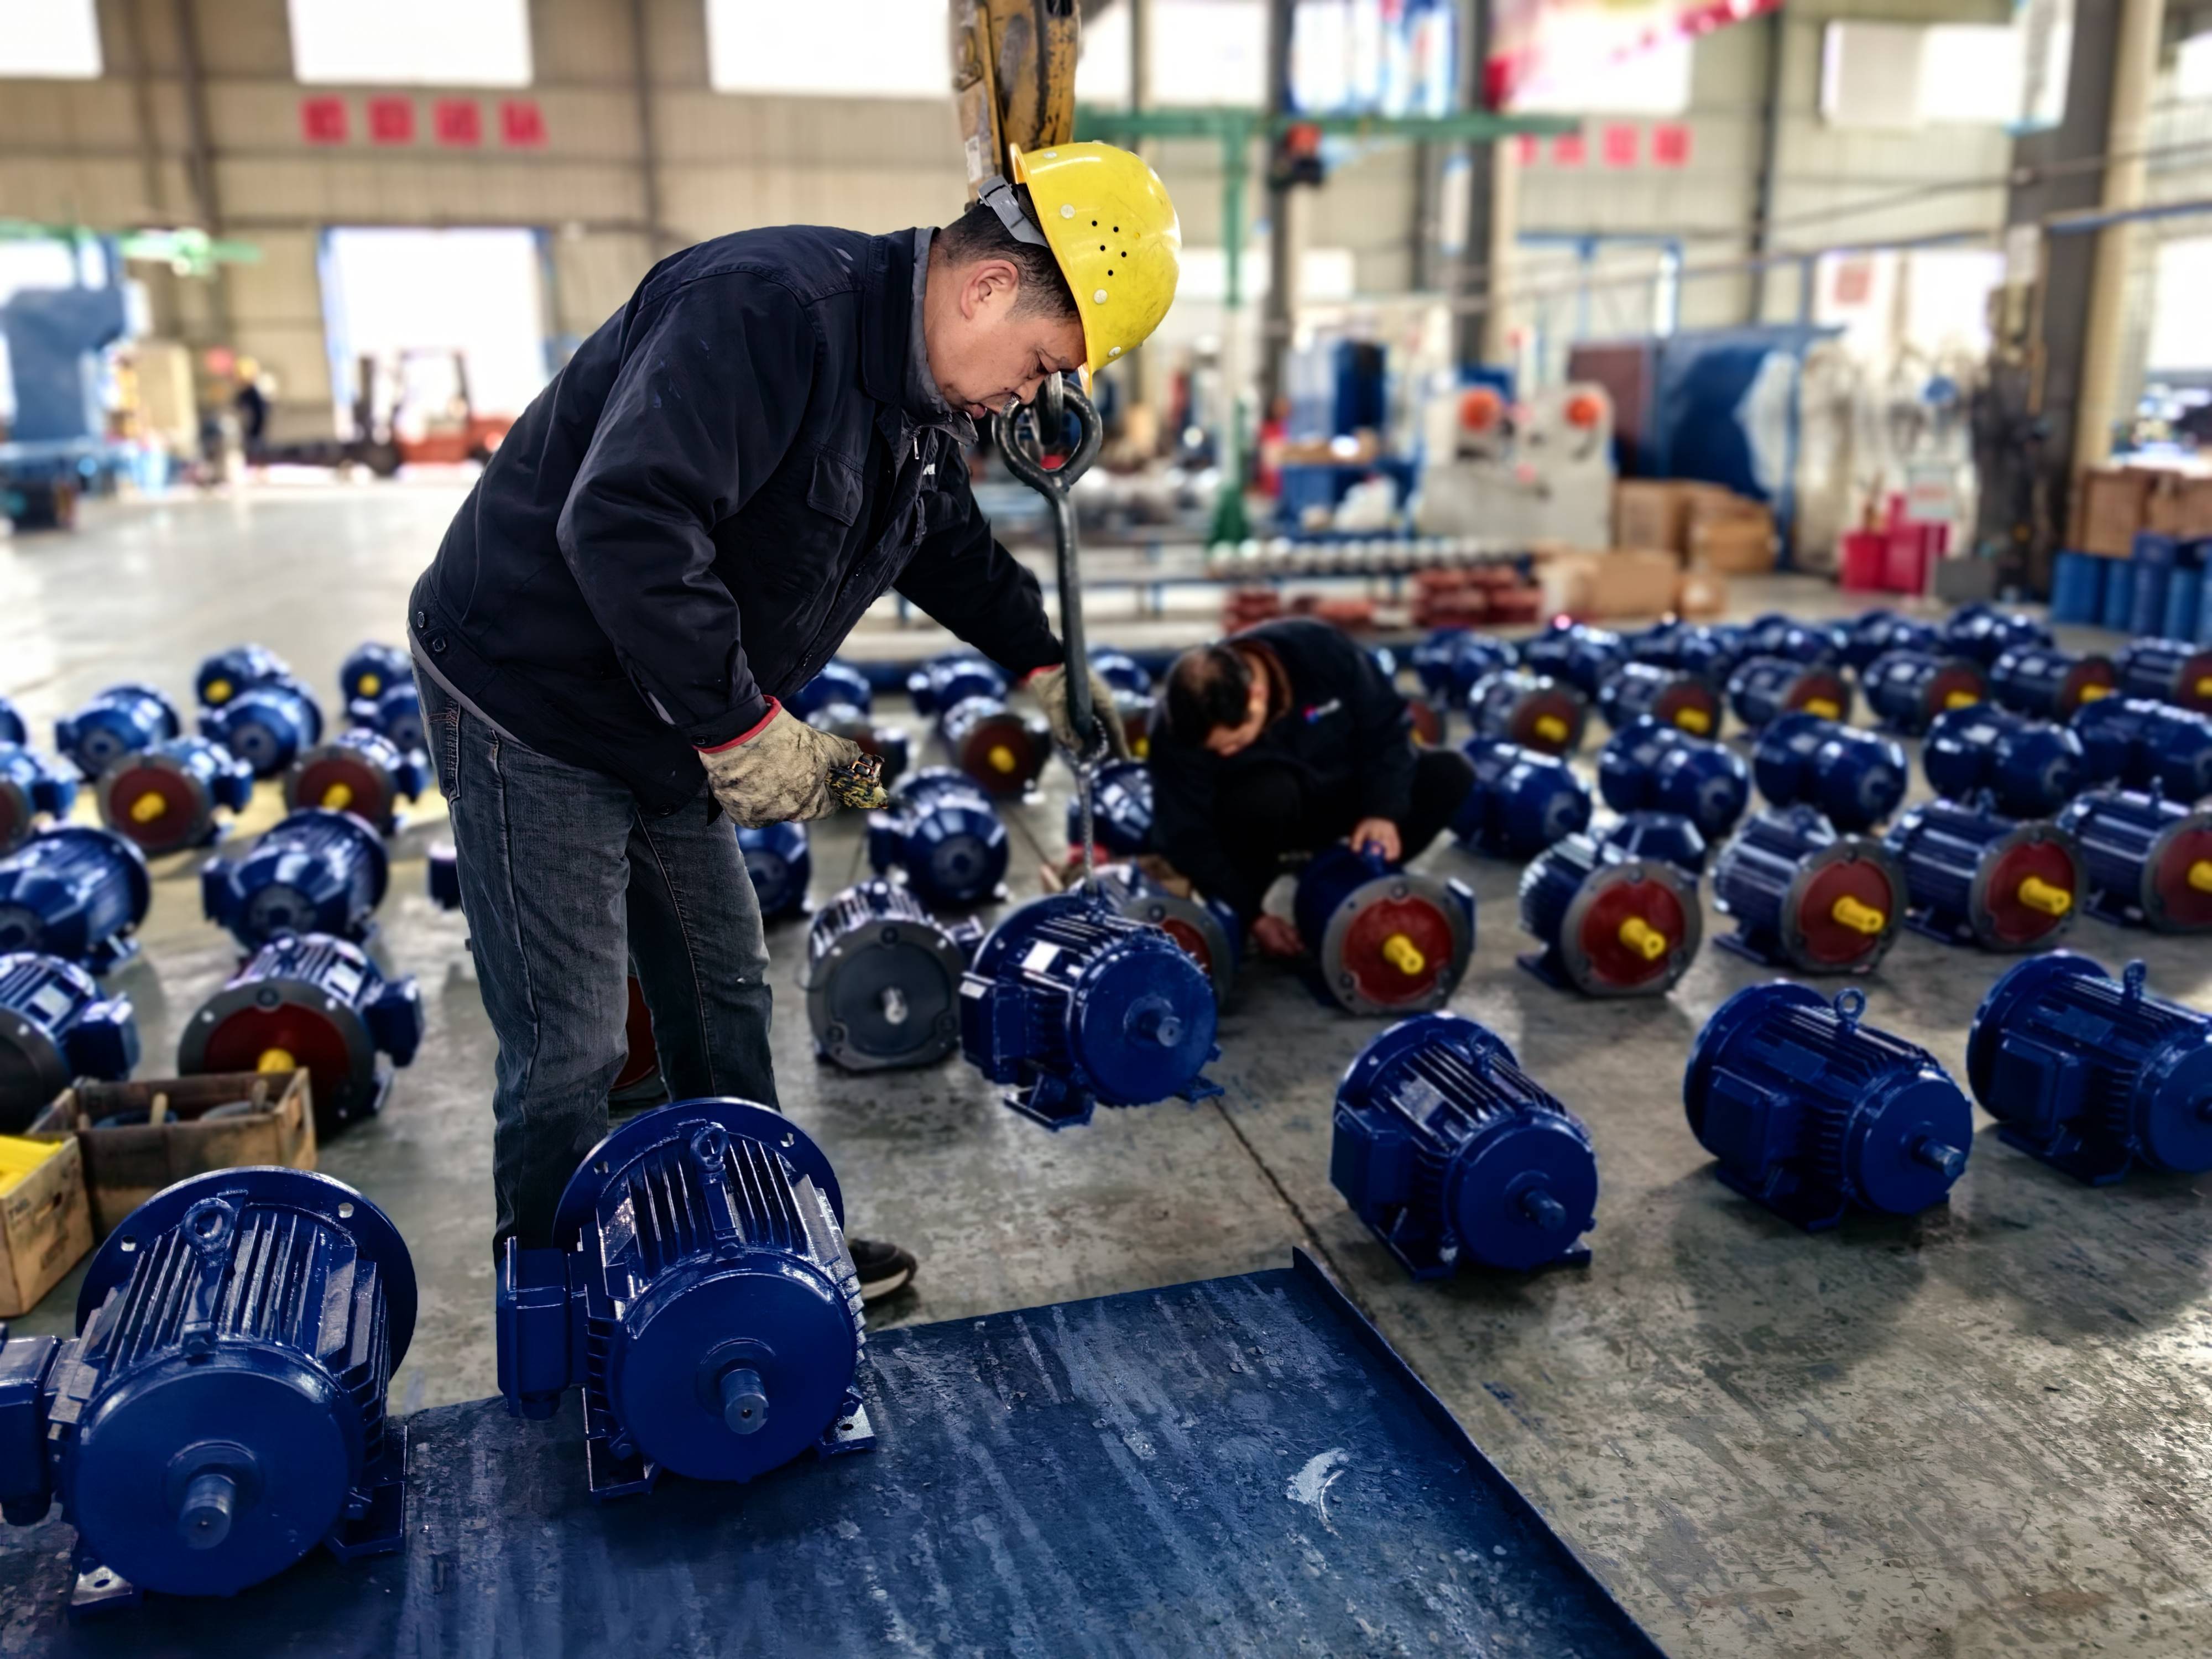
Placed within an industry-chain framework, the motor's structure is quite clear. Upstream lies raw materials and basic components — silicon steel sheet (electrical steel) is stamped and stacked into stator and rotor cores, enameled copper wire is wound into coils, and permanent magnet motors additionally require rare-earth permanent magnets such as NdFeB for their magnets, alongside supporting components such as bearings, insulation materials, and housings. Midstream is the motor assembly process itself — stamping and stacking laminations, winding and inserting coils, machining the rotor, and final assembly and testing — which turns a pile of raw materials into a finished motor that can directly drive a load. Downstream, there is almost no boundary: pumps, fans, compressors, home appliances, automobiles, elevators, machine tools, industrial robots, rail transit, ships, aerospace — any equipment that needs to convert electrical energy into rotary or linear power must procure a motor as part of its powertrain.
This industry chain has a structural feature that is easy to overlook yet critically important: the electric motor almost never appears on a shelf as a final consumer good. The consumer buys an air conditioner with a motor inside, not the motor itself; the factory procures a pump unit fitted with a motor, not the motor as a standalone item. The motor is always a component inside someone else's product, and this componentized status determines its bargaining position within the chain — fluctuations in upstream raw-material prices, especially copper, silicon steel, and rare-earth magnetic materials, pass straight through to motor costs, while downstream assemblers often treat the motor as a comparable, substitutable, standardized purchased item and use that to squeeze the price down. Motor manufacturers are squeezed in the middle from both sides, with neither pricing power over raw materials nor brand premium at the consumer end. This is also one of the roots of the industry's long-standing structure of a huge number of enterprises, most of them individually small in scale — the specific cost structure, the copper-price transmission mechanism, and the distribution of downstream sub-markets are left to the chapter that dissects the industry chain; here only the overall picture is sketched.
1.6 Ubiquitous and High-Volume: The First-Principle Character of the Motor Industry
Overlaying the classification systems and the industry-chain map from the preceding sections is what makes the phrase "ubiquitous and high-volume" (量大面广) truly carry weight — it is not a marketing slogan but the most essential economic structure of this industry.
"High-volume" shows up on two dimensions: first, the scale of output within a single category — whether it is industrial-motor output measured in ten-thousand-kW units or micro and special motor output measured in hundreds of millions of units, the magnitudes are considerable either way; second, the density of the categories themselves — six technology paths crossed with four application categories give rise to hundreds of sub-markets, spanning from kilowatt-class high-voltage motors to milliwatt-class vibration motors, a range of specifications covering six or seven orders of magnitude. "Ubiquitous" shows up in the breadth of downstream penetration: it is almost impossible to find a modern manufacturing category that can entirely bypass the motor — heavy industry needs it to drive pumps and compressors, consumer electronics needs it for micro motors, new-energy vehicles need it for the drive assembly, robots need it as joint actuators, and rail transit needs it for traction power.
Being ubiquitous and high-volume together shape this industry's economic character: extremely fragmented — a thousand different trades procuring separately and customizing their own specifications, making it naturally hard for a handful of enterprises to monopolize; highly standardized yet with narrow room for differentiation — general-purpose motors compete on near-total homogeneity, with price as the primary competitive lever; low per-unit value but a huge aggregate pool — which is exactly what allows the industry to sustain a substantial overall size; and, because of its componentized nature, extremely low brand recognition — as noted in the previous section, the motor is always hidden inside someone else's product, with few opportunities to build awareness directly with end consumers. These four traits explain nearly every phenomenon the later chapters will unpack: why this industry still has no household consumer brand yet has produced a number of global hidden champions; why energy-efficiency regulation can serve as the most effective lever for pulling the whole industry's technology upward; and why industrial clusters always quietly grow up next to other manufacturing clusters rather than occupying the spotlight on their own.
This state of being "overlooked" is not stable. Once a category with enormous scale but long-standing neglect is given new strategic meaning — whether energy-efficiency regulation turns it into a key lever for energy conservation and emissions reduction, or new-energy vehicles and humanoid robots turn it into the most expensive core component by unit price — the very base that was once ignored, precisely because of its size, becomes the point where leverage is strongest. What the chapters that follow will unpack is how this old craft completes a structural repositioning between being overlooked and being depended upon. The electric motor is the heart of industry — a heart that never draws attention to itself, yet never stops turning.
Chapter 2: The Global Landscape — From Faraday to Nidec
The craft of the electric motor is older than nearly every industrial category still in existence today. It was born on a nineteenth-century laboratory bench, matured in twentieth-century factory workshops, and is now being revalued in the joints of twenty-first-century robots. To understand today's map of contending powers — a Japanese company that dominated hard-disk spindle motors for half a century only to stumble in the electric-vehicle race, a Brazilian company that leapfrogged a century-old European powerhouse through a single acquisition, a German giant that sold off its motor lineage entirely to a private-equity fund — one must first go back to those sixty-seven years and see how this craft turned from a physics experiment into a set of industrial standards.
2.1 From Electromagnetic Rotation to Industrial Power: The Sixty-Seven-Year Origin
In 1821, Michael Faraday completed his electromagnetic rotation experiment at the Royal Institution in London: a current-carrying wire rotated continuously around a magnet. This was the first time humanity had turned the interaction between electricity and magnetism into visible mechanical motion, and the physical principle of the electric motor was established from that point on — though it remained only a demonstration device, still a long way from a machine that could actually do work.
Thirteen years later, this principle walked out of the laboratory. In 1834, the German-born scientist Moritz Hermann von Jacobi built the first rotating electric machine of practical significance in St. Petersburg. In 1838, he installed this motor on a small boat and used it to ferry fourteen passengers back and forth along the Neva River — the first time in any real sense that an electric motor had substituted for human or animal power in performing a transport task. Though the power was feeble and the cost high, it proved for the first time that converting electrical energy into mechanical power could support real-world transport needs.
What truly gave the motor an industrial future was the principle of the self-excited generator, proposed by Werner von Siemens in 1866: a generator no longer needed to rely on bulky, expensive permanent magnets to establish its magnetic field, but could instead use the current it generated itself to power the field winding, sharply raising output power and lowering manufacturing cost. This principle not only made the generator practical, but also laid the groundwork for the later mass production of the motor industry — years afterward, when Siemens eventually divested its motor business entirely, that lineage traced right back to this very year.
At the 1873 Vienna World's Fair, an accidental but far-reaching demonstration took place: a running Gramme dynamo was mistakenly connected to the output terminals of another generator, and instead of continuing to generate power, it began spinning like a motor. This accident proved for the first time, to the world at large, that generators and motors are reversible in principle — the same machine turns when powered and supplies power when turned. The discovery connected the two ends of generation and consumption, and was the critical leap that carried the electric machine from a one-way device to a universal power machine.
In 1888, Nikola Tesla's patent for the AC induction motor (No. 381,968) was sold to George Westinghouse's Westinghouse Electric. Compared with the DC motors that dominated at the time, the AC induction motor had a simpler structure, needed no brushes or commutator, cost less to maintain, and could use transformers to transmit power at high voltage over long distances before stepping down for driving loads. This single patent transaction became the starting point from which AC motors gradually displaced DC motors to become the mainstream of industrial power for more than a century afterward. From then on, the spinning heart of the factory workshop belonged overwhelmingly to the AC motor — and that main thread runs all the way through to today's energy-efficiency regulations and the race among new-energy drive motors.
2.2 Global Market Size: A Ruler That Cannot Measure
Much like the predicament of having no authoritative total figure for the size of the China market, the size of the global motor market is likewise an account that cannot be pinned down. The broad motor market's 2024 size is estimated at roughly US$115 billion to US$153 billion, with a huge range across different institutions' estimates, and even conflicting figures across different versions of reports from the same institution; under the micro and special motor definition, the global size falls into a range of roughly US$40 billion to US$49 billion; and the most contaminated figure of all is the new-energy vehicle traction motor definition, where estimates from various parties range from US$10 billion to US$25.6 billion — a spread of more than two-to-one — such that citing any single figure in isolation risks misleading the reader.
Different institutions' differing definitions of the boundary of "the motor" cause global size estimates to diverge by a factor of three — this sentence alone is the single most important key to understanding the global motor market. The root of the divergence is no mystery: some statistical scopes count only the motor body, while others bundle in the accompanying drive, controller, and gearbox; some cover only mid-to-large industrial motors, while others fold in the tens of billions of micro and special motors as well; some value at ex-factory price, others at the price of the finished integrated product. The blurred boundary of the motor industry chain means the question "how big is the global motor market" has no single standard answer that can be directly compared — only by looking separately, definition by definition and category by category, can the true competitive landscape come into focus.
This confusion of definitions also maps directly onto the share battle among several giants discussed later in this chapter. The reason the WEG-versus-ABB contest in the low-voltage motor track can be pinned down to a single percentage point is precisely that the statistical scope used is clearly bounded and highly comparable — not some vague notion of "the global motor market." Conversely, any claim of holding the "No. 1 global motor market share" that does not specify the exact sub-category and statistical basis deserves a question mark before it is taken at face value.
2.3 Nidec: The World's Largest Motor Maker's e-Axle Gamble and Exit
Nidec Corporation (Tokyo Stock Exchange: 6594, formerly Nippon Densan, hereafter Nidec) is widely recognized as the largest motor maker in the world by scale, with a global share of roughly 80% (company-reported basis) in hard-disk drive spindle motors — near-monopoly territory in that particular niche. Revenue in fiscal 2024 (ended March 2025) reached ¥2.61 trillion, up 11.1% year on year and a record high — on financial performance alone, this is a giant still growing steadily.
But what has truly gripped the nerves of the global motor industry is Nidec's gamble on, and eventual exit from, the new-energy vehicle e-Axle system (the integrated three-in-one electric drive unit combining motor, reducer, and inverter/control electronics). In 2019, Nidec was first to achieve mass production in this field, one of the earliest makers in the world to push the integrated e-drive unit to large-scale production, and it was also the flagship strategic project personally led by founder Shigenobu Nagamori. However, the price war that subsequently broke out in China's new-energy vehicle market sharply compressed margins on e-drive systems; in the third quarter of fiscal 2024, Nidec booked roughly ¥59.8 billion in restructuring charges as a result, and over the following half-year the business posted a further loss of ¥87.7 billion. The pressure kept building until May 2026, when Nidec's newly appointed CEO announced the dissolution of the China-Europe e-Axle joint venture and Nidec's formal withdrawal from the business — bringing to a close a flagship project that had once carried the founder's high hopes and personal will.
Emerging at almost the same time as the business exit was an accounting scandal. An independent third-party investigation found more than 1,000 instances of improper accounting treatment within Nidec, and the investigation's conclusions linked this directly to the performance pressure that Nagamori had long imposed on his subordinates; Nagamori himself left the board in December 2025. The investigation at one point warned that the company could face impairment risk of up to roughly ¥250 billion (about US$1.6 billion), and it was only after the final investigation report was released in April 2026 that market sentiment gradually stabilized and the share price recovered. (Caveat: some of the quarterly figures cited in this section are drawn from secondhand media reporting; readers should defer to Nidec's official financial filings for the precise basis.) From mass-production pioneer to impairment charges to complete withdrawal, the full trajectory of the e-Axle business line is a microcosm of the new-energy vehicle e-drive track's journey from frenzy to reality, and it also marks the closing of the era of management that Nagamori built with his own hands.
Placing near-monopoly in hard-disk spindle motors alongside a full-scale rout in e-drive systems within a single company, Nidec's predicament reflects two very different fates across the motor industry's old and new tracks: in a mature, stable-demand installed-base market, the share barriers built by a first mover are extremely hard to dislodge; but in an emerging track like new-energy vehicles, where demand swings sharply and price wars can reshape the cost curve at any moment, even the largest motor maker in the world by scale cannot necessarily convert that scale advantage into sustained profitability.
2.4 WEG: How a Brazilian Company Climbed to No. 1 in Global Low-Voltage Motors
If Nidec's story is one of a giant's retreat, then the story of WEG S.A. (B3: WEGE3, founded in 1961 in Rio Grande do Sul, Brazil) is one of a latecomer's accelerated overtake. WEG's net revenue reached BRL 40.8 billion in fiscal 2025, and that same year, WEG overtook ABB (15.5%) for the first time to claim the No. 1 spot globally in low-voltage motors with a 16% share (Omdia basis) — the most emblematic reshuffling of the global motor competitive landscape in decades: a company from an emerging market overtaking a century-old industrial powerhouse rooted in Europe.
The key move that drove this overtake was an acquisition completed in April 2024: WEG bought Regal Rexnord's industrial motor business for roughly US$400 million. The deal rapidly expanded WEG's manufacturing capacity and distribution channels in North America and Europe, letting it move directly into the installed share of developed markets on top of its Latin America-rooted base, reaching the top spot years earlier than organic growth alone could have achieved. As of now, WEG operates 67 industrial parks worldwide, produces more than 19 million motors a year, and employs roughly 48,000 people. WEG's path from a South American manufacturer to the global No. 1 in low-voltage motor share clearly demonstrates how M&A integration can reshape the global landscape faster than technological leadership alone — a mirror worth holding up for other motor makers that still rely on organic growth as they seek breakthroughs abroad.
This reshuffling also points to a broader pattern: in an asset-heavy manufacturing industry like motors, where technology maturity is high and the room for differentiation in any single link is limited, M&A integration is often more effective than R&D investment alone at rewriting market-share standings in a short period of time. For other motor makers still relying mainly on organic growth and trying to penetrate developed markets gradually through overseas plants, the path by which WEG traded a US$400 million acquisition for a share overtake years ahead of schedule offers a faster, more realistic reference frame.
2.5 ABB: A Technology Moat and a Self-Declared "IE6"
ABB Ltd (dual-listed in Zurich, Switzerland and Stockholm, Sweden), though it ceded the No. 1 spot in global low-voltage motor share to WEG in 2025, still holds an industry-benchmark level of technological accumulation. Its Motion division, which houses the motors and drives business, generated revenue of US$8.247 billion in fiscal 2025, up 6% year on year, with an EBITA margin of 19.4% — a level of profitability that leads the industrial manufacturing sector.
ABB is a pioneer of the synchronous reluctance motor (SynRM) technology route: the rotor needs neither permanent magnets nor induced-current excitation, generating torque instead through reluctance differentials, combining the high efficiency of a permanent magnet motor with the low cost and rare-earth-free advantage of an induction motor. ABB launched an IE4-class integrated synchronous reluctance motor solution in 2011 and upgraded the product line to IE5 in 2019, staying at the front of the industry for a long stretch in the commercial rollout of efficiency technology. It should be noted that the "IE6" tier circulating in the market is ABB's own marketing terminology for product promotion, not an efficiency standard officially defined by the International Electrotechnical Commission (IEC) — the efficiency-class system formally published by the IEC currently goes only up to IE5, and the term "IE6" should not be confused with an actual international standard tier.
A shift in the share rankings does not fully equate to a shift in competitiveness — ABB's first-mover advantage in high-value-added technology routes such as the synchronous reluctance motor remains substantial, and its Motion division's near-20% EBITA margin is above the industry average. This suggests that competition in the global low-voltage motor market is moving from a pure contest of share and scale toward a dual track that weighs share and profitability together.
2.6 Siemens' Motor Business: From Innomotics to KPS, a Century-Old Lineage Says Goodbye
Turning the clock back to 1866, as mentioned in Section 2.1, when Werner von Siemens proposed the principle of the self-excited generator, laying the roots of Siemens' motor business for a century and a half to come. Yet in the third decade of the twenty-first century, this lineage, spanning more than 150 years, ultimately left the Siemens brand system entirely.
In 2022, Siemens spun off its large motors business into an independently operating entity; in 2023, Siemens at one point planned to pursue a standalone initial public offering (IPO) for the business, but ultimately abandoned that plan. The turning point came in October 2024, when the American private-equity firm KPS Capital Partners completed the acquisition of the business at an enterprise value of €3.5 billion. Once the deal closed, the newly independent company was renamed Innomotics, with roughly 15,000 employees and 17 plants, remaining a force not to be ignored in the global motor industry. The weight of this deal lies not only in the sum itself but in the fact that it marked the first time a century-and-a-half-old motor lineage traceable back to 1866 had cut ties entirely with its parent brand, Siemens, and passed instead into the hands of a private-equity fund focused on consolidating and reselling industrial assets. This is also a microcosm of a broader trend in recent years — Europe's old-line industrial conglomerates divesting non-core, capital-heavy businesses — as motor manufacturing, with its relatively low margins and high capital intensity, is gradually being removed from the list of core assets held by large diversified industrial groups.
The choice for Innomotics to be taken over by a private-equity fund rather than another industrial-capital buyer is itself worth pondering: KPS Capital Partners' core business is acquiring industrial assets, improving their operations, and then either selling them or pushing them toward a listing exit. This means Innomotics will, in all likelihood, go through another round of asset restructuring or ownership change within the next few years, rather than continuing to exist as a long-term, stable business segment within the Siemens group the way it did for more than 150 years.
2.7 Mabuchi Motor and Johnson Electric: Two Extremes in the World of Micro Motors
At the other end of the motor spectrum — the realm of micro and special motors, tiny in size and low in unit price yet staggering in shipment volume — two companies each represent an extreme of operating philosophy.
Mabuchi Motor Co., Ltd. (Tokyo Stock Exchange: 6592, hereafter Mabuchi) reported revenue of ¥200.4 billion in fiscal 2025, producing more than 1.4 billion micro motors a year, with a global share of over 80% in automotive side-mirror motors and over 70% in door-lock motors (company-reported basis). Mabuchi's operating model is textbook-extreme: in 1987, Dalian Mabuchi, which it established in Dalian, Liaoning, China, was the first wholly foreign-owned subsidiary set up in China by a Japanese company; from the 1990s onward, Mabuchi moved its mass-production processes entirely out of Japan, achieving 100% overseas production — putting manufacturing entirely at lower-cost overseas sites while keeping only R&D and headquarters functions at home. It is an extreme sample of an efficiency-first business philosophy.
Johnson Electric Holdings Limited (Hong Kong Stock Exchange: 00179, hereafter Johnson Electric) has taken a different path. Founded in Hong Kong in 1959 by Wong Chung-Yiu and his wife, the company reported revenue of US$3.648 billion and net profit of US$263 million in fiscal 2024/25, producing 4 million motors a day, with automotive-related products accounting for 84% of revenue. As a Hong Kong-born company that grew into an ethnic-Chinese giant of the global micro-motor world, Johnson Electric's brand and product lines form their own self-contained system. One red line worth flagging here explicitly: Johnson Electric bears no equity relationship whatsoever to the A-share-listed "Dechang Co., Ltd." (SHA: 605555, registered in Ningbo, Zhejiang) — the two even sued each other in 2021 over trade-name rights. Their names are highly similar, but their businesses, shareholding, and financial data must never be conflated — this is one of the easiest traps to fall into when citing material about this industry.
The divergence in paths between Mabuchi and Johnson Electric reflects, to some extent, two different manufacturing genes: the former wins through extreme cost efficiency and depth in a single supply chain, having moved mass production entirely offshore to drive down costs; the latter relies more on customer relationships and breadth of product portfolio accumulated over the long run in the vertical field of automotive electronics. The two models, arriving by different routes at the same conclusion, prove that in the highly fragmented, extremely low-unit-price track of micro and special motors, both economies of scale and vertical specialization can build a moat.
2.8 International Energy-Efficiency Regulation: IEC Tiers and the Diverging Paths of US and EU Regulation
The motor efficiency-class system is developed and led by the International Electrotechnical Commission (IEC): standard IEC 60034-30-1 defines the sequence of efficiency classes from IE1 to IE4, while IEC 60034-30-2, aimed at variable-frequency motors, further defines the higher IE5 class, together forming the internationally recognized framework for motor efficiency classification in use today. Moving from IE1's "standard efficiency" to IE5's "ultra-premium efficiency," a higher class means lower energy loss at rated load — and this unified classification language is precisely the technical basis that lets the EU raise its mandatory threshold year after year, as well as the shared reference point for mutual recognition of compliance across countries' motor products.
Within this framework, the EU and the United States have taken two starkly different regulatory paths in recent years. The EU has tightened its mandatory threshold in stages through Regulation (EU) 2019/1781: starting July 1, 2021, mandatory IE3 coverage was expanded to more power ranges of motor products; starting July 1, 2023, motors in the 75kW-to-200kW power range were required to meet IE4. This threshold is a full tier higher than China's current IE3 mandatory floor, meaning any motor manufacturer planning to export to the EU market must bear the corresponding costs of efficiency upgrades and compliance certification — the EU market has, in effect, turned its efficiency standard into a hidden trade barrier.
In stark contrast to the EU's continued tightening, the direction of US regulation has reversed. New motor-efficiency rules originally advanced by the US Department of Energy (DOE) — projected to save American users a cumulative US$56 billion in electricity costs over the next thirty years — were formally withdrawn by the Trump administration in March 2025 (caveat: US regulatory developments in this area remain fast-moving; readers should verify the current status as of the time of reference).
The implications of this divergence for global motor trade are unambiguous: motor manufacturers exporting to the EU must keep investing in R&D and production-line upgrades to meet a threshold that rises year after year, while product lines aimed at the US market are, for now, no longer under the same intensity of mandatory efficiency pressure. For motor makers positioned across multiple export markets at once, this means product efficiency classes, certification costs, and R&D priorities now have to be planned separately by destination market, rather than treated uniformly under a single global standard — energy-efficiency regulation is evolving from a purely environmental issue into a structural force reshaping the global motor trade landscape.
From Faraday setting a wire spinning in his laboratory to today's regulators around the world redefining the threshold of a "qualified motor" through efficiency classes, across the two centuries this craft has traveled, industrial mainstream practice has never stopped searching for a new balance point between efficiency and cost. Nidec's exit, WEG's rise to the top, and the farewell of Siemens' motor lineage are among the most vivid strokes in this latest reconstruction of that balance point — and where the next balance point will land, and in whose hands, is exactly the question the chapters that follow will continue to answer.
Chapter 3: The PEST Environment — The Energy-Efficiency Baton
For the motor industry, the four quadrants of PEST are not balanced: policy dominates alone, serving as the baton that determines the investment pace and technology-route choices across the entire industry chain, while the economic, social, and technological quadrants function more as the backdrop and extension of how policy plays out on the ground. This imbalance is itself a judgment call — an old industry repeatedly reshaped by mandatory efficiency standards depends far more on the policy calendar than on the rhythm of spontaneous market clearing, more so than most manufacturing sub-sectors.
3.1 P — Policy: A Forty-Year Mainline of Mandatory Generational Replacement
Why policy refuses to let go of the motor is a question whose answer lies in the denominator. China's installed motor base is roughly 3.27 billion kW, consuming more than 4.5 trillion kWh of electricity a year — 75% of the country's industrial electricity consumption — meaning three-quarters of every industrial electricity bill ultimately flows to this seemingly ordinary category of rotating component. In earlier official statements, the share of motor electricity was expressed against total societal electricity consumption, once cited in the 60%-to-64% range (per remarks by NDRC officials and the National Energy Conservation Center between 2011 and 2016); today, this 75% figure is measured against industrial electricity consumption instead — one is a whole-society basis, the other an industrial basis, and the two cannot be directly compared — but they point to the same conclusion: however the denominator is drawn, the motor remains the single largest category in the electricity-consumption map. The motor is not the most expensive equipment in the industry chain, but it is the single category that consumes the most electricity; when energy conservation and emissions reduction need a lever to grab, the motor is naturally the fulcrum with the greatest leverage. This is the underlying logic behind why efficiency standards have kept tightening, without interruption, since the early twenty-first century. It also determines the three-tier structure of the policy toolbox: standards set the threshold, dedicated action plans drive progress, and fiscal subsidies provide incentive — stacked together, these three tiers form the complete picture of China's motor-efficiency policy over the past two-plus decades.
National standard GB 18613 is the skeleton of this mainline, having undergone three substantive revisions over forty years:
- The 2002 first edition, which for the first time set minimum efficiency limits and efficiency-class thresholds for electric motors;
- The 2006 revision, which raised the threshold modestly;
- The 2012 edition (effective September 1, 2012), which switched to the loss-analysis test method, bringing the measurement basis closer to actual operating conditions;
- The 2020 edition, a watershed: starting June 1, 2021, IE3 became the mandatory efficiency floor for production and sale — motors that fail to meet IE3 may not be manufactured or sold — with IE4 designated as the energy-conservation evaluation value and IE5 marked as the standard's highest tier, leaving room for further upgrades down the road.
The change in test methodology is not an irrelevant technical detail: the loss-analysis method measures each component of loss during motor operation separately and sums them, coming closer to real operating conditions than the earlier, blunter whole-unit efficiency measurement, and it provided the measurement foundation for the finer-grained efficiency classes — IE3, IE4, IE5 — that followed. Choosing IE3 rather than a higher tier as the mandatory floor was, at its core, a compromise between the ideal of efficiency and industrial reality: China's motor manufacturing base spans tens of thousands of enterprises of widely varying scale, and requiring IE4 or even IE5 in one step would have meant a substantial share of small and mid-sized capacity being knocked out directly. The layered design — IE3 as the floor, IE4 designated the energy-conservation evaluation value — was a pragmatic choice that left a transition window for existing capacity. The pace of the three revisions demonstrates one thing: the efficiency threshold was never raised all at once, but in stages, each time leaving a window, giving assemblers and the supporting chain time to switch over — yet the direction has never reversed.
Once the standard set the threshold, an industrial promotion plan followed. The target set by the Motor Energy Efficiency Improvement Plan (2013–2015) was to roll out 170 million kW of high-efficiency motors; there is no official acceptance data available for how this round was actually completed, and that gap must be left honestly unresolved rather than glossed over. This blank spot only makes the next round more valuable by contrast — both were multi-year industrial promotion plans, yet one stopped at the target itself with no closed loop of results, while the other delivered on all three of its metrics — output, share, and electricity savings. The contrast itself is direct evidence of a difference in policy execution strength.
It is the later round that actually left real evidence behind. From 2021 to 2023, output of high-efficiency energy-saving motors climbed from 92 million kW to 179 million kW, very nearly doubling in three years and exceeding the 170-million-kW rollout target; by 2023, the share of high-efficiency energy-saving motors in the installed base reached 20.2%, up 12.9 percentage points from 2020, likewise exceeding the established 20% target; annual electricity savings reached 62.7 billion kWh, above the 49-billion-kWh target. All three metrics were fulfilled ahead of target (per People's Daily's authoritative account). This is not common in the history of industrial-policy execution — most dedicated plans stop short, leaving a gap between the target on paper and actual output; this round of motor-efficiency policy is a rare sample where target and result truly reconcile. It is worth noting that this structural leap occurred against a backdrop of overall pressure on total motor output — structural upgrading outran the contraction in total volume, showing that the efficiency standard is pushing the industry from scale expansion toward quality substitution. This body of evidence is also important context for understanding why the later four-ministry plan dared to set its targets as high as 35% and 15%: less than a decade ago, one five-year plan could not even leave behind acceptance data, while the most recent round delivered on all three metrics — output, share, and electricity savings — meaning the new plan's dual-track targets are not an arbitrary reach, but a further escalation built on a foundation already proven workable.
The threshold keeps moving upward. GB 30253-2024 (permanent magnet synchronous motors) and GB 30254-2024 (high-voltage motors), effective October 1, 2025, set higher efficiency floors for permanent magnet synchronous motors and high-voltage motors respectively, marking the standards system's formal opening of the doorway to the "IE5 era." The previous round of thresholds was capped at IE3; in this round's policy language, IE5 is no longer just a tier notation at the end of a standard's text, but now has a dedicated standard to anchor its rollout. For manufacturers, the new standards mean that both the permanent magnet synchronous and high-voltage product lines must simultaneously complete their efficiency data and pass the corresponding tests and certification — this kind of compliance cost tends to fall first on leading enterprises, and how quickly small and mid-sized manufacturers can keep pace will largely determine whether the "IE5 era" turns out to be a gradual transition or an abrupt culling.
The latest round of policy signals emerged in 2026. The Ministry of Industry and Information Technology and three other ministries jointly issued the Implementation Plan for the High-Quality Development of Energy-Saving Equipment (2026–2028) in March 2026, placing energy-saving motors first among six categories of key equipment and setting dual-track targets for both the share of new additions and the share of the installed base: by 2028, energy-saving motors, fans, pumps, and compressors must each reach a 35% share of new additions, and their share of the installed base must each exceed 15%. Behind the dual-track targets are two parallel policy demands: the new-addition share targets the product structure of the incremental market, forcing newly manufactured equipment to align directly with higher efficiency classes; the installed-base share targets the pace of stock replacement, meaning the retirement and renewal of old equipment will become an ongoing task over the next three years rather than a one-off campaign-style overhaul. The plan also names several specific technology directions — super-Tier-1 efficiency, wide-range permanent magnets, magnetic levitation, and direct-drive motors — terms that had previously appeared mostly in industry trade shows and corporate marketing materials, and are now, for the first time, written into an industrial plan at the ministerial level, indicating that the policy weight given to technology-route endorsement is rising. Among the six categories of key equipment, energy-saving motors were placed first — ahead of fans, pumps, and compressors — and this ranking is itself a signal: within the efficiency map, the motor is still judged to be the single equipment category with the greatest leverage effect, echoing precisely the denominator logic that opened this section.
The accompanying fiscal leverage has escalated in step. The pool of ultra-long-term special treasury bonds earmarked for equipment renewal across the whole industry is roughly RMB 300 billion; for Tier-1 efficiency equipment, the subsidy cap is 20% of investment amount; at the local level there are additional dedicated top-ups, with subsidies for Tier-1 efficiency motors falling roughly in the range of RMB 45 to RMB 120 per kW — though local practices vary considerably, with subsidy strength and application thresholds differing across provinces and cities, so enterprises need to check the specific local policy to know what subsidy they can actually claim. From an execution standpoint, the role of fiscal leverage is more about pulling than backstopping — the subsidy cap covers only one-fifth of investment amount, and enterprises still have to shoulder most of the retrofit spending themselves; what truly determines the pace of retrofitting is whether the hard red line drawn by the mandatory efficiency standard overlaps with the window during which local subsidies are available. For small and mid-sized motor plants, the IE3 mandatory floor is not just a policy slogan but a very real retrofit ledger: composite estimates show that the cost pressure from efficiency retrofitting runs roughly 10% to 15%, with retrofit spending amounting to roughly 25% to 50% of the cost of buying a new motor outright, and a payback period of one to two years — whether a plant's finances can hold out through that one-to-two-year window directly determines whether a small or mid-sized plant gets knocked out or keeps pace with the generational changeover. From GB 18613 to the four-ministry plan, forty years of policy history point clearly in one direction: the efficiency threshold only rises, never falls; fiscal incentives fill part of the gap, but the cost of the changeover is ultimately absorbed by the industry chain itself — meeting the efficiency standard is turning from a compliance option into a condition of survival.
3.2 E — Economy: Copper-Price Transmission and Manufacturing Sentiment
If policy is the strongest exogenous variable for the motor industry, raw-material price swings are the most direct economic-environment shock, and the two together determine an enterprise's actual profit margin in any given period. Within the motor's cost structure, copper is the most sensitive variable: copper wire accounts for roughly 30% to 40% of raw-material cost, and copper, aluminum, and steel together account for roughly 60%. International copper prices rose for seven consecutive months in 2026, briefly breaking above US$14,500 per tonne; domestic futures prices broke above RMB 106,000 per tonne at the same time. The transmission pattern is fairly clear — for every US$1,000-per-tonne rise in copper price, the cost of a new-energy drive motor rises by roughly 2% to 3%; at the end-market level, quoted prices for standard motors have generally risen by 10% to 20%, forming a pattern of "upstream benefits, midstream is squeezed": upstream copper mining and electrolytic-copper trading clearly benefit, while motor manufacturers in the midstream bear the cost squeeze, and small and mid-sized plants with weaker bargaining power are especially exposed.
In the face of rising copper prices, the industry's visible responses fall into roughly three paths: embedding a copper-price indexing mechanism into contract terms, shifting part of the raw-material volatility risk onto downstream customers; substituting aluminum for part of the copper windings to lower unit cost; and accelerating the shift to brushless designs to reduce the amount of copper used in windings. These responses are more of a buffer than a cure — the cyclical swing of copper prices remains a constant variable hanging over motor manufacturing costs.
Under copper-price pressure, industry-wide profitability did not deteriorate in step — it instead showed signs of a rebound. Data from the Small and Medium-sized Motor Branch of the China Electrical Equipment Industry Association (CEEIA) show that in 2024, the 58 sample enterprises' total output was 272.101 million kW, down 0.3% year on year; profit was RMB 4.37 billion, down 8.3%; the share of loss-making firms reached 13.8%; export revenue was RMB 7.38 billion, up 5.6% — clear signs of strain. Behind the loss-making-firm figure lies a stratification of scale effects: large enterprises, with their purchasing leverage and hedging tools, can partly offset copper-price swings, while the broad base of small and mid-sized motor plants lacks such tools, so every rise in copper price directly erodes their already-thin margins. By the first three quarters of 2025, the picture had clearly reversed: output was 202.005 million kW, up 4.7% year on year; sales revenue was RMB 56.0 billion, up 4.2%; profit was RMB 3.36 billion, up 10.3%; export revenue was roughly RMB 5.85 billion, up 15.0% — faster growth than domestic sales; generator (including wind-power) output grew 56.0%, one of the fastest-growing sub-categories in this recovery. For reference, the 3,802 above-scale enterprises in the motor industry saw revenue grow 19.6% and profit grow 22.8% in the first three quarters — both faster than the machinery-industry average and the national industrial average.
The product-structure upgrading forced by the efficiency standard also shows up in the output data: in 2024, output of Tier-2-and-above efficiency products grew 40.3% year on year, and Tier-1 products grew 112% — growth rates far outpacing the industry overall, the most direct structural signal under the policy baton. High-efficiency product lines are becoming a new profit outlet for motor enterprises, partially offsetting the price-competition pressure on the standard-motor end. The copper-price cycle and efficiency-driven structural upgrading together define the current economic environment of motor manufacturing: on one side, the rigid rise in raw-material costs; on the other, a policy-driven window for product upgrading — the two forces squeeze and create opportunity at the same time, and judging the industry's business climate cannot rely on watching a single curve alone.
3.3 S — Society: An Industry Nobody Pays Attention To
The motor's public recognition is completely out of proportion to its economic scale. Almost every piece of equipment in air conditioners, refrigerators, elevators, pump rooms, and production lines has at least one motor turning somewhere inside it, yet the brands consumers can name are almost uniformly the downstream assemblers — for an air conditioner, people recognize the appliance brand; for a car, they recognize the vehicle brand — but almost no one knows which motor maker produced the compressor motor or drive motor in their own home. The motor industry has more than 3,800 above-scale enterprises, and its products penetrate nearly every piece of electricity-consuming equipment, yet it has never managed to produce a single consumer-facing brand symbol.
This is not a matter of marketing capability but a fate determined by the B2B nature of the business. The motor is an embedded component, not facing end consumers directly; purchasing decisions rest with the downstream assembler, and brand premium is naturally captured downstream. The more reliable a motor is made, the longer its service life, the lower its failure rate — the more thoroughly it "disappears": consumers not perceiving the motor's existence is precisely the result of the motor maker having gotten the product right. This paradox — the better the job, the less anyone knows about it — is the key clue to understanding the motor industry's low social recognition.
The capital market's attention to the motor has also long been misaligned. For most of its history, motor-related stocks have been lumped into the broad machinery-equipment or components sector, rarely discussed on their own; only once energy-efficiency policy and emerging application scenarios took turns becoming the focus of the narrative did analysts begin singling out the motor for separate scrutiny. This sudden rise in attention stands in contrast to the technological character of the motor industry itself, which has barely changed in decades — a reminder that the rise and fall of public attention does not necessarily track the real rhythm of industry fundamentals. At the same time, the motor is an extremely mature category, its technology routes having converged over more than a century, with intense homogeneous competition and narrow room for pricing power, leaving it in a long-standing state of low margins and low attention. The advent of mandatory efficiency standards and emerging application scenarios is, in a sense, the first time external forces have systematically pulled the motor back into the spotlight — not because consumers have started to care about the motor itself, but because policy and the capital market have each, from the separate angles of energy conservation and emerging applications, rediscovered this long-overlooked old craft. This state of being unnoticed is precisely the starting point for the two transformations to come.
3.4 T — Technology: Direction First, Details Left for a Later Chapter
This section only points to the direction of the technology dimension; the specific paths and supporting evidence are left for Chapter 9. The continued escalation of efficiency standards is pushing the whole industry toward permanent-magnetization — the efficiency advantage of the permanent magnet synchronous motor over the induction motor is the technical precondition for IE4 and IE5 to be realized in practice; variable-frequency drive adoption is advancing in parallel, with the co-optimization of the variable-frequency drive and the motor body forming another main thread for compressing lifecycle energy consumption. Beyond that, two new stages are opening up the imaginative scope of the motor: hairpin windings, oil cooling, and multi-in-one integration in new-energy vehicle drive motors, and the joint-motor technology route in emerging robotics applications. Which of these directions is moving faster, and which is more narrative than substance, is not a judgment this chapter will make — that is left for Chapter 9 to unpack one by one.
Taking the four PEST dimensions together, policy is the absolute dominant variable: the mandatory changeover under GB 18613, the dual-track targets of the four-ministry plan, and the fiscal leverage behind equipment renewal together map out the most certain part of the motor industry's picture for the next several years. The copper-price swings and profit structure within the economic environment, and the unnoticed B2B fate within social perception, are more like friction and background noise in how policy plays out on the ground — they shape the pace but do not change the direction. The technology direction is a product of the joint action of policy, economic, and social conditions — the energy-efficiency baton has forced permanent-magnetization and variable-frequency adoption, while emerging application scenarios have forced open the two new stages of new-energy e-drive and joint motors. Understanding where the motor industry is headed next is impossible without first understanding this chronology of energy-efficiency policy.
Chapter 4: China's Market Size and Operating Trends — An Industry Measured in Kilowatts, Not in RMB
4.1 An Industry That Refuses to Be Measured in RMB
Open any authoritative statistical report on China's motor industry, and the first thing that jumps out is something anomalous: the hardest set of figures carries no currency unit at all.
The National Bureau of Statistics (NBS) publishes "AC motor output" monthly, measured in ten-thousand-kW units; the Small and Medium-sized Motor Branch of the China Electrical Equipment Industry Association (CEEIA) publishes sample-enterprise output, likewise in ten-thousand-kW units; the Micro Motor Branch publishes output in hundreds of millions of units. Try to find a single "market size (RMB)" figure that could represent the industry as a whole, and there is no reliably sourced version to be found — the handful of most widely circulated figures differ from one another by nearly an order of magnitude, and none of them can be traced back to a verifiable statistical basis.
Why would an industry so mature it is nearly ubiquitous fall silent on the most basic measure of total size? The answer lies not in any oversight by statistical authorities, but in four characteristics of the motor as a product itself.
First, the kilowatt is not a conversion unit but the product specification of the motor itself. What a motor does is convert electrical power into mechanical power; its rated power both defines how large a load it can drive and, in broad terms, determines its size, copper usage, and silicon-steel usage. A motor's "size" is naturally defined by its kilowatt rating, not by its selling price. Using kilowatts as the statistical basis is equivalent to capturing the product's physical attribute directly, without passing through any price intermediary.
Second, being ubiquitous and high-volume strips the unit count of additivity. A vibration motor inside a phone is a fraction of a watt; a high-voltage motor in a metallurgical plant is tens of thousands of kW — the two span six or seven orders of magnitude. Recording both a mine main-ventilation-fan motor and an electric toothbrush motor as "one unit" produces a sum with no industrial meaning. The kilowatt provides the only additive physical ruler this industry has — it at least guarantees that a single 10,000-kW unit contributes 10,000 kW to the total, and nothing more or less.
Third, price lacks a comparable benchmark. Two 7.5kW three-phase induction motors that differ by just one efficiency tier, or are sold domestically versus exported, or bear a proprietary brand versus OEM production, can differ several-fold in transaction price. The industry has no unified product catalog, no published price index, and no spot benchmark comparable to those for steel or copper. Any attempt to sum figures in RMB runs, from step one, into the unanswerable question of "which price."
Fourth, and the most fatal issue of all: the statistical boundary is unclear. A motor is both an independent commodity and a component. The motor inside an air conditioner's compressor, the direct-drive motor inside a washing machine, the e-drive unit inside a new-energy vehicle — the vast majority of these have never once been transacted separately under the name "motor." Market size measured in RMB therefore depends on which layer the cut is made at — the motor body alone, the integrated e-drive unit, or the full drive system including the inverter and reduction gearing — and the resulting figure can differ several-fold depending on where that cut falls. The very reason international institutions' estimates of the global motor market's size can diverge by a factor of three traces back to this same root.
It is worth noting that the credible RMB figures that do exist in this industry are, without exception, tied to a specific accountable entity: a listed company's revenue is backed by an audited consolidated financial statement, an association sample enterprise's sales revenue is backed by the financial data of a named company, and customs export value is backed by individual customs declaration forms. They are credible precisely because every yuan can be traced to a signing institution. "Industry market size," by contrast, is not something recorded by anyone — it is something constructed, and construction requires first drawing the industry's boundary, which is exactly what the motor industry lacks a universally accepted line for. No boundary means no denominator; no denominator means every aggregate figure is nothing more than the estimator's own arbitrary basis.
This chapter therefore takes an unglamorous approach: rather than offering any single aggregate figure for "China's motor industry market size (RMB)," it uses four separately traceable but mutually non-additive sets of figures to depict the state of the industry —
- The National Bureau of Statistics' AC motor output, measured in ten-thousand-kW units, reflecting the direction of physical output;
- The China Electrical Equipment Industry Association's sample-enterprise output, sales revenue, and profit, reflecting the direction of profitability;
- Customs' export value by category, reflecting the direction of external demand;
- The Micro Motor Branch's output value and unit count, reflecting the scale of the special sub-segment of micro and special motors.
The four pieces do not assemble into a single total, but the four directions taken together are enough to show what is happening in this industry. Preferring four true, mutually non-additive figures over one deceptively complete-looking total is both this chapter's method and this report's judgment on the state of statistics for the industry as a whole.
4.2 The Output Series: From Peak to Plateau
The NBS's AC motor output is the hardest time series this industry has, and it forms the skeleton of this chapter.
| Year | AC Motor Output (million kW) | YoY |
|---|---|---|
| 2021 | 405.018 | Peak year |
| 2022 | No reliable same-basis figure obtained for this report | — |
| 2023 | 368.125 | Down 14.25% |
| 2024 | Approx. 353.217 | Down 4.7% |
| 2025 | 349.885 | Down 0.5% |
From 405.018 million kW to 349.885 million kW, output fell by a cumulative 55.133 million kW over four years, a decline of roughly 13.6%. The shape of the curve is more worth noting than its magnitude: 2023 was a steep drop, the decline narrowed to under 5% in 2024, and 2025 was nearly flat. The step down has finished playing out, but output has not climbed back onto the old step — 2025's output remains a clear notch below the 2021 peak, and has stabilized at that lower level.
There is one detail about this series that has to be spelled out. Compounding the year-on-year growth rates sequentially and comparing the result against the table's absolute values reveals a discrepancy of about 1%; the 2024 figure itself carries a roughly 1% divergence across different secondhand versions cited by third parties. The discrepancy is small, but its meaning is clear — even the hardest output series here has already passed through a layer of third-party compilation. Users can treat it only as evidence of trend, not as a ledger accurate to one decimal place. The coarseness of industry statistics shows up not only in RMB figures but in the kilowatt figures as well — both need a qualifier.
There is more than one reason behind the step-down in output, and it cannot be attributed entirely to weak demand. At least two forces are at work simultaneously.
The first is the pullback in downstream assemblers' production schedules. The motor's direct customers are the assemblers of pumps, fans, compressors, machine tools, and various general-purpose machinery; the 2021 high point corresponded to the high point of that round of manufacturing investment and export orders, after which assemblers' production schedules pulled back, and the motor, as a supporting component, was compressed in step. To a large extent, the motor-output curve is a lagged mirror of the business climate for general-purpose machinery.
The second is a mismatch in timing around the mandatory efficiency changeover. GB 18613-2020 set IE3 (the third tier of the IEC efficiency classification) as the mandatory floor starting June 2021, and products falling short of that floor could no longer be manufactured or sold. Around a standard switchover, a concentrated shipment of old-standard products typically occurs, so the 2021 peak very likely includes some demand that had been pulled forward — it should be noted that this is an inference based on the policy timeline, and there is no product-level public statistic that can directly verify it.
There is one more point that is not a cause but a necessary caution when interpreting the output series: the kilowatt basis is completely insensitive to structural change. It records only the sum of rated power — a 7.5kW motor designed to the highest efficiency tier and priced noticeably higher, and a 7.5kW motor that just barely clears the mandatory floor, look identical on this report. So a decline in output does not equal contraction of the industry; it only means the "total rated power sold" has fallen. How much these kilowatts are worth, and how much profit they generate, requires a different ruler.
4.3 Declining Volume, Rising Value: A Curve Running the Opposite Direction
Looking only at the NBS's output figures would suggest an industry in decline. Overlay the China Electrical Equipment Industry Association's figures, and the picture flips immediately.
In 2024, the Small and Medium-sized Motor Branch's 58 sample enterprises had total output of 272.101 million kW, down 0.3% year on year, moving in the same direction as national output; that same year, profit was RMB 4.37 billion, down 8.3%, with a loss-making share of 13.8%. Output edging down slightly, profit falling noticeably, and roughly one in seven sample enterprises in the red — 2024 was the trough of this cycle.
In the first three quarters of 2025, the same set of sample enterprises turned all three figures positive at once, and in a telling order: output was 202.005 million kW, up 4.7%; sales revenue was RMB 56.0 billion, up 4.2%; profit was RMB 3.36 billion, up 10.3%. Profit growth was more than double revenue growth.
The broader reference is even steeper. Across all 3,802 above-scale enterprises in the motor industry, revenue grew 19.6% and profit grew 22.8% in the first three quarters of 2025 — both above the average for the machinery industry and for national industry over the same period.
The gap between the two association-based figures is itself informative. The branch sample consists mainly of standard small and mid-sized motor manufacturers, while the full above-scale basis also folds in faster-growing segments such as generators, e-drive systems, and micro and special motors — the branch's own 56.0% growth in generator (including wind-power) output over the same period is corroborating evidence. A considerable part of the above-scale basis's high growth does not come from traditional small and mid-sized industrial motors, and reading it directly as "the industrial motor sector is booming" would overstate the temperature of the underlying base.
One more divergence in direction is worth recording: national AC motor output declined for the full year 2025, while the 58 sample enterprises' output rose over the first three quarters. The two figures differ in both time range and statistical population and cannot be netted against each other directly; but the opposite directions at least suggest that the national contraction did not fall evenly on every enterprise. It must be added immediately that the industry has no authoritative concentration statistic, and any concentration metric derived from these figures does not hold up — the only indirect basis available is enterprise counts, such as 3,802 above-scale enterprises and 213 member units of the Small and Medium-sized Motor Branch, and these point to a highly fragmented market.
Putting the four sets of figures together, this chapter's core judgment holds: declining volume, rising value.
Output measured per kilowatt is falling, while the value carried per kilowatt is rising. The intervening variable is product structure. Each step up in efficiency class requires more copper in the stator winding, a higher grade of silicon steel, and even more permanent magnet material, so the motor's material cost and selling price rise in step. The result is that the same kilowatt of capacity now sells as a more expensive kilowatt.
"Declining volume, rising value" is a different thing from an ordinary price increase. A price increase means the same product selling for more; what is happening here is a product swap: low-efficiency commodity motors are exiting, and high-efficiency products are filling in the gap. The former is held down by price wars — competition on price for low-end standard motors has never let up; the latter is underpinned by mandatory standards and equipment-renewal policy. Profit growth consistently outpacing revenue growth is a direct read on improving gross-margin structure, not a read on recovering demand. Interpreting the 2025 profit rebound as "industry recovery" is the most common misreading of this shift.
The other side of this judgment must be stated just as clearly: structural transformation does not save everyone. The 13.8% loss-making share in 2024 shows that sample enterprises have already split into two camps — those keeping pace with the efficiency changeover and those falling behind. The step-down in the output figures means, for small and mid-sized plants accustomed to making low-efficiency commodity products, the outright disappearance of orders; for enterprises capable of delivering the top two efficiency tiers at scale, it means a way out beyond simply trading price for volume. The same output curve tells completely opposite stories on the two types of enterprises' financial statements.
4.4 Provincial Distribution: East China Accounts for Nearly Sixty Percent
The 2025 provincial distribution continues a long-standing pattern of high geographic concentration: Jiangsu at 16.35%, Zhejiang at 15.45%, Guangdong in third place, and East China accounting for 58.91% combined. This data likewise comes from third-party compilation of the NBS's monthly figures, and is tallied by place of production rather than place of company registration — for enterprises with plants across multiple provinces, output is recorded in the province where the plant is located.
Jiangsu and Zhejiang together account for nearly a third of the national total, and East China for close to sixty percent. The reason for this concentration lies not in the motor itself but in the motor's customers. The motor is a supporting component, and capacity has to sit close to the assemblers: the Yangtze River Delta simultaneously clusters together the largest motor-using industries — pumps and valves, fans, air compressors, textile machinery, packaging machinery, home appliances, and new-energy vehicle assembly — and transport radius and support-response speed dictate that motor plants can only grow up next to their customers. East China's near-sixty-percent share is, in essence, a projection of the distribution of China's general-machinery and home-appliance manufacturing capacity, not the outcome of some independent industrial policy.
Guangdong, in third place, has taken a different path. The Pearl River Delta's strength lies in micro and special motors and home-appliance supporting components — products in the range of a few watts to a few hundred watts, whose unit count is extremely large but whose share on a kilowatt basis is limited. The same ten-thousand-kW report records both a single several-hundred-kW high-voltage motor and thousands of small home-appliance motors on the same scale, where a single unit of the former is worth an entire batch of the latter.
This gives rise to a reading trap that has to be called out explicitly: the provincial share ranking reflects the total rated power of each province's motor manufacturing capacity, not the output value, enterprise count, or employment scale of each province's motor industry. Using kilowatt share to infer the economic scale of a province's motor industry will systematically understate regions dominated by micro and special motors, and systematically overstate regions dominated by high-voltage, high-power products. The kilowatt ruler buys additivity at the cost of erasing differences in product form, and the provincial data makes that cost most plainly visible.
The same logic applies to any cross-province comparison: a three-percentage-point difference in kilowatt share between two provinces might signal a huge gap in industry scale, or it might just mean the two regions' dominant products sit in different power ranges. Provincial data can answer "where is rated power produced," but it cannot answer "where does industry value land."
4.5 Where the Denominator Is Written: How Much Electricity the Motor Actually Consumes
Regarding the share of electricity consumed by motors, the most widely circulated claim is that "motor electricity consumption accounts for half of society's total electricity use." Searching the original text of the relevant MIIT documents turns up no such statement; it is more likely a distortion that formed through repeated secondhand citation. A percentage with no denominator, no year, and no issuing authority is precisely the most typical sample of the statistical confusion in this industry.
There are three defensible sets of figures, and each must be written together with its denominator.
- The IEA basis: in 2023, motor-driven systems consumed 53% of the world's total electricity use, and 72% of the world's industrial-sector electricity use. The denominator is global, and the year is 2023.
- The official Chinese basis: China's installed motor base is roughly 3.27 billion kW, with annual electricity consumption exceeding 4.5 trillion kWh, accounting for 75% of industrial electricity use. This set of figures appears in citations related to the Implementation Plan for Promoting Equipment Renewal in the Industrial Sector, issued by MIIT and six other ministries in 2024. The denominator is China's industrial electricity use, not China's total societal electricity use.
- The historical basis: between 2011 and 2016, remarks by NDRC officials and materials from the National Energy Conservation Center once put motor electricity consumption at 60% to 64% of total societal electricity use. The denominator is China's total societal electricity use, and the year is now nearly a decade old.
The three sets of figures use, respectively, global total societal electricity, China's industrial electricity, and China's total societal electricity as their denominators, with years of 2023, 2024, and a decade ago. Mixing any two of these sets together for comparison or extrapolation produces a wrong conclusion; and the reason the widely circulated "half" claim does not hold up is precisely that it pastes the numerator from one set onto the denominator of another.
Setting aside the confused citations, the underlying conclusion itself is solid: motor-driven systems are the single largest consumer of electricity on the planet. Of every two kWh of electricity generated globally, motors consume a little more than one; in China, three-quarters of industrial electricity flows to motors. No other category of industrial product occupies the same position.
This position determines the policy treatment the motor industry receives, and it determines every subsequent discussion of energy efficiency in this report. For the vast majority of industrial goods, a one-percentage-point efficiency gain is merely a product performance metric; for the motor, with an annual electricity consumption base of 4.5 trillion kWh, even a one-percentage-point improvement in the average efficiency of the installed base translates into annual electricity savings on the order of tens of billions of kWh. Motor efficiency is therefore not a product issue but an issue of total energy volume — the reason it is written into national-level energy-conservation plans starts logically from this very denominator.
One more comparison illustrates the difficulty of efficiency governance even more clearly. Set the 3.27-billion-kW installed base against the 2025 AC motor output of 349.885 million kW, or roughly 0.35 billion kW — the two are not strictly comparable, since the installed base covers all types of motors while output counts only AC motors — but the order of magnitude is clear enough: the installed stock is roughly ten times annual output. In other words, even if every unit of new output went entirely toward replacing old motors in service, fully turning over the whole stock would still take close to a decade. The pace of the efficiency changeover is ultimately set by the stock-replacement cycle, not by policy intent alone.
4.6 Efficiency Structure: Output Steps Down, Efficiency Steps Up
The step-down in output tells only half the story. Over the same period, another curve has been climbing steeply upward.
| Year | High-Efficiency Energy-Saving Motor Output (million kW) | Share of Annual Motor Output (policy basis) |
|---|---|---|
| 2021 | 92 | 39% |
| 2022 | 167 | 72% |
| 2023 | 179 | 73% |
The share of high-efficiency energy-saving motors in output rose from 39% to 73% within two years — the steepest curve in this cycle. The inflection point falls between 2021 and 2022, coinciding with the timing of GB 18613-2020 setting IE3 as the mandatory floor in June 2021, below which products could no longer be manufactured or sold. The jump in share is, first and foremost, a direct result of regulation, and only secondarily a matter of market choice.
Data from the association sample makes the sharpness of the jump even clearer. In 2024, the 58 sample enterprises' total output fell 0.3% year on year, yet within that total, Tier-2-and-above efficiency products came to 78 million kW, up 40.3% year on year, and Tier-1 efficiency products came to 22 million kW, up 112% year on year. (In China's efficiency-class numbering, the lower the number the higher the efficiency, with Tier 1 the highest.) Against the same sample's total output of 272.101 million kW as the denominator, Tier-2-and-above products account for roughly 28.7% and Tier-1 products for roughly 8%. In a year when the total stood still, the top two efficiency tiers grew 40% and more than doubled, respectively — the most direct physical evidence of "declining volume, rising value," and it also explains why profit growth was able to outpace revenue growth in 2025: the structural improvement had already taken place on the product side in 2024, it simply took another year to show up on the income statement.
But there is a break in statistical basis hidden between these two sets of figures that has to be called out. Dividing the 2021 high-efficiency energy-saving motor output of 92 million kW by the NBS's same-year AC motor output of 405 million kW yields just over 20%, not the 39% given by the policy basis; doing the same division for 2023 yields under 50%, versus the policy basis's 73%. The two denominators are simply not the same thing — the "annual motor output" in the policy basis and the NBS's "AC motor output" do not cover the same scope.
The conclusion is not that one set of figures is wrong, but that in this industry, any division performed across sources must first prove the denominators share the same origin. This report therefore does not offer any single percentage for "high-efficiency motor penetration" — circulating versions range from under 10% to over 30%, contradicting one another and mostly untraceable to a source, and their disagreement comes almost entirely from the denominator, not the numerator.
What truly needs to be distinguished is the gap between two very different worlds: new additions and the installed base. As of 2023, high-efficiency energy-saving motors accounted for 73% of that year's new output, but only 20.2% of the nation's installed motor base — the latter figure up 12.9 percentage points from 2020, already a fairly fast pace of advance. The more-than-fifty-percentage-point gap between the two is simply another way of writing the ten-year replacement cycle described in Section 4.5: the new-addition side has essentially completed its changeover, while the installed-base side has only just worked through a fifth of the way.
This gap determines the demand structure of the motor industry for years to come. Efficiency competition in the incremental market is nearing its end — above the mandatory floor, the contest is now over the premium space created by super-Tier-1 efficiency, permanent-magnetization, and higher rotational speeds, and the room to compete on price with low-efficiency products has already been sealed off at the regulatory level. The stock-replacement market, by contrast, has only just opened up, and its momentum does not depend on users' spontaneous willingness: an old motor that still turns carries no urgency to replace for its user, so the pace of replacement ultimately depends on the strength of equipment-renewal subsidies and the natural retirement rate of aging equipment.
4.7 Micro and Special Motors: A Great Power by Unit Count, a Catch-Up Player by Value
Micro and special motors are one of the few segments in this industry with an association-reported output-value figure, and the reason confirms precisely the four points made at the opening of this chapter: micro and special motors are counted by unit, their product form is highly standardized, and the vast majority are transacted as independent commodities — conditions that allow them to be summed in currency terms. Whatever segment can be measured in RMB is, without exception, a segment with a clearly defined boundary.
In 2025, China's micro-motor industry had a total output value of roughly RMB 290 billion, with output of 16 billion units against demand of 14 billion units over the same period; the branch's forecast for 2026 is 18 billion units and RMB 295 billion. Dividing one figure by the other yields the most telling fact in this section: the average ex-factory unit price of a Chinese micro or special motor is roughly RMB 18. By the same arithmetic, the 2026 forecast implies an average unit price that is even lower still — unit growth outpacing output-value growth means the branch itself expects the industry to keep making up for lower prices with higher volume.
Sixteen billion units is a quantity hard to grasp intuitively. They are hidden in a phone's vibration feedback and camera autofocus mechanism, in a car's side mirrors, door locks, seat adjustment, and air-conditioning vents, in electric toothbrushes, robot vacuum cleaners, printers, and every moving part of every home appliance. Over a lifetime, the average user will wear out several dozen micro and special motors without ever realizing they have bought a single one.
The scale of output is not in dispute, but the position in terms of value is an entirely different matter. Figures from the Information Center of the China Electronic Components Industry Association show that global demand for micro and special motors was roughly 14.2 billion units in 2023, worth roughly RMB 284.22 billion; by share of sales revenue, Japanese companies held 40.8%, and mainland Chinese companies held 33.3%.
A country that is an outright great power by unit count ranks behind Japan in the ranking by sales revenue. The gap lies not in production capacity but in product structure: share of the high-value micro and special motors — automotive-grade, medical-grade, precision optical drives, and specialty products with high speed and long life — remains concentrated in the hands of Japanese makers; what pulls down mainland China's average unit price is precisely the sheer volume of general-purpose products. Unit-count share and sales-revenue share are two different things, and mistaking the former for the latter is the most common cognitive error in this segment.
Worth debunking in passing is a claim widely circulated in Chinese-language sources: "China accounts for 70% of the global micro and special motor market." This figure finds no support in authoritative sources and diverges wildly from the 33.3% sales-revenue share — it is most likely an estimate on a unit-count basis mistaken for a sales-revenue share. The mechanism behind this kind of distortion is not complicated: dividing China's output in one year by global demand in a different year, with mismatched years and mismatched bases, can manufacture whatever percentage one wants — dividing China's 16 billion units in 2025 by the world's 14.2 billion units of demand in 2023 can even produce the absurd conclusion that China's output exceeds global demand.
A great power by unit count, a catch-up player by value — this contrast in micro and special motors is a microcosm of the structural position of China's entire motor industry, and another expression, at the most granular scale, of "declining volume, rising value." What China's motor industry has to fight for next is not how many more units or how many more kilowatts it can build, but how much it can sell each unit, each kilowatt, for.
4.8 Exports: Large Motors Lead the Way, with Mexico and Vietnam in Front
Customs-basis export figures for the first three quarters of 2025 show three categories moving in different directions: small and mid-sized motors, RMB 65.38 billion, up 7.8%; micro motors, RMB 18.92 billion; large motors, RMB 4.96 billion, up 64.0%. The three together total roughly RMB 89.26 billion, of which small and mid-sized motors account for about 73%, micro motors about 21%, and large motors just over 5%.
The fastest-growing category is precisely the one with the smallest base. The 64% growth in large motors is notable, but its absolute scale of RMB 4.96 billion means its pull on total industry exports is limited. Generator (including wind-power) output under the branch basis grew 56.0% over the same period, pointing to the same underlying variable as large motors' high growth — the investment cycle in power and heavy industry, not a recovery in demand for general industrial motors. What truly represents the fundamentals of the industry's exports remains small and mid-sized motors, over 70% of the total and growing 7.8%; treating large motors' explosive growth rate as representative of external demand for the industry as a whole would seriously overstate the temperature.
Exports on the association-sample basis form another, independent line: the 58 sample enterprises had export revenue of RMB 7.38 billion in 2024, up 5.6%, and roughly RMB 5.85 billion in the first three quarters of 2025, up 15.0%. The sample basis's export growth rate jumping from single digits to double digits does not contradict the customs basis's 7.8% growth for small and mid-sized motors — the sample enterprises are mainly mid-to-large above-scale manufacturers, with a higher proportion of high-efficiency products among their exports, so their unit price and growth rate are naturally above the national average. It is worth flagging that RMB 5.85 billion and customs' RMB 65.38 billion differ by an order of magnitude — the former is 58 enterprises' export sales revenue, the latter is the nation's customs-declared value — and the two cannot corroborate each other, still less be spliced into a single series.
The destination-mix data rewards closer reading. Figures from the China Chamber of Commerce for Import and Export of Machinery and Electronic Products (CCCME) show that China's motor-product exports totaled US$6.35 billion in the first five months of 2024, up 1.6% year on year, with Mexico and Vietnam as the top two destinations. This set of figures is denominated in US dollars and covers only the first five months, so it cannot be strung together with the earlier RMB-denominated, first-three-quarters figures — it must be read on its own.
Neither Mexico nor Vietnam is a major end-consumer market for motors — both are assembly bases. Mexico corresponds to the vehicle, appliance, and industrial-equipment assembly capacity that has landed there following North American nearshoring; Vietnam corresponds to the eastward shift of appliance and electronics contract manufacturing. The bulk of China's motor exports is therefore not direct sales to end markets, but a supporting component embedded within the layout of cross-border manufacturing capacity — wherever assembly capacity moves, the supporting motors follow.
Two implications follow from this. First, the stability of China's motor exports depends heavily on the pace at which China's own assembly manufacturing shifts abroad, not only on the strength of overseas end demand — capacity relocation can, for a period, actually boost motor exports, because what moves away is the assembly stage while the supporting supply chain stays behind. Second, the more concentrated destinations are in assembly bases, the more sensitive the industry becomes to changes in the destination country's industrial policy and tariff rules: once the layout of assembly capacity shifts again, motor orders will move house right along with it, and motor makers have almost no bargaining power over that kind of shift.
Three export threads — the steady expansion of small and mid-sized motors, the cyclical bursts in large motors, and destinations concentrating in assembly bases — together support the other side of this chapter's core judgment. Even as domestic output steps down, external demand is one of the few directions still providing incremental growth; more importantly, the increment it provides likewise skews toward high-efficiency, high-power products rather than low-end commodity goods. Domestic mandatory standards and overseas efficiency thresholds push China's motor industry toward the same position from two directions: build less, sell for more, and it has to be better. This is the throughline that only becomes visible once this industry is measured in kilowatts rather than in RMB.
Chapter 5: Deconstructing the Supply Chain: The Trio of Silicon Steel, Copper Wire, and Magnets
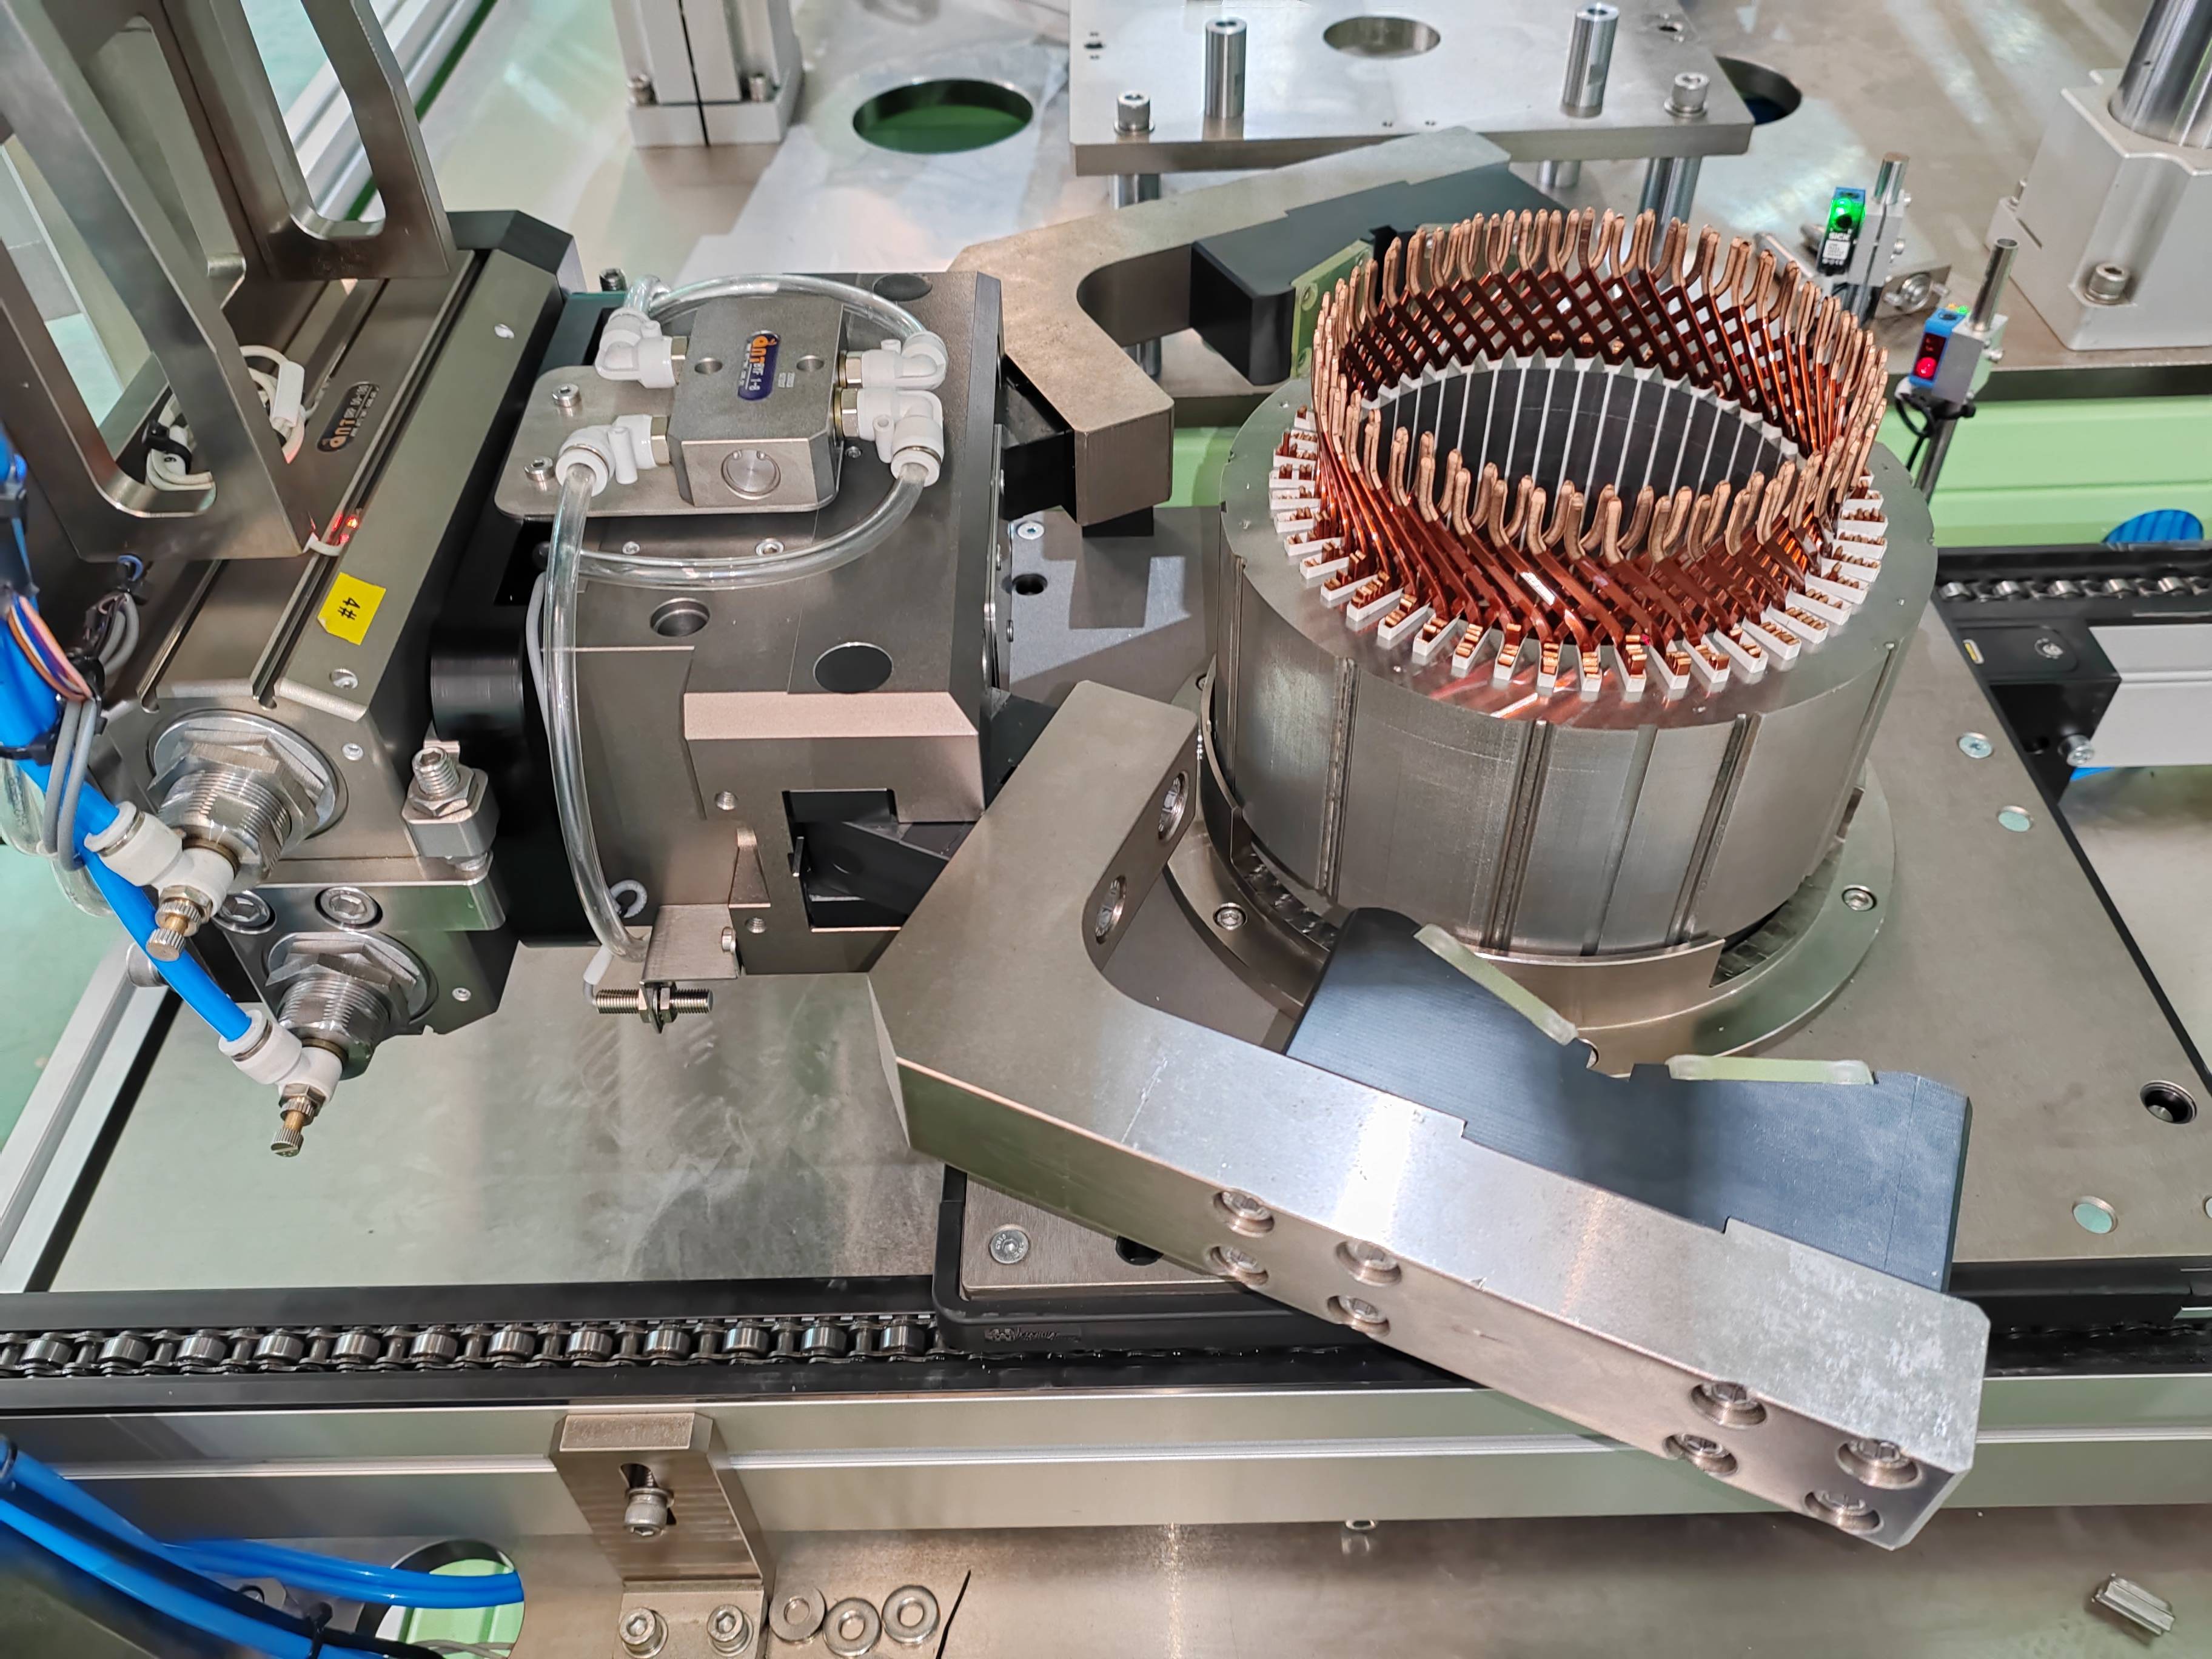
The electric motor supply chain follows a classic dumbbell structure: upstream material costs account for the bulk of expense, midstream manufacturing runs on thin margins, and downstream application scenarios spread extraordinarily wide. Opening up the cost sheet of a single motor, electrical steel, copper wire, and magnet steel are the three key materials that determine where the profit goes, and price fluctuations in all three transmit almost synchronously to the price quotes issued by finished-motor manufacturers. This chapter works through the supply chain layer by layer, moving from upstream to downstream and from materials to business models.
5.1 The Upstream Trio: Price Resonance Across Electrical Steel, Copper, and Magnet Steel
Electrical steel (silicon steel sheet) is the core material of a motor's iron core. Non-oriented silicon steel is divided by magnetic performance and loss metrics into standard grades and high grades, with the latter being an essential material for new energy vehicle drive motors and high-efficiency energy-saving motors — the core advantage of high-grade non-oriented silicon steel lies in lower iron loss and higher magnetic flux density, which enables higher power density within the same volume, and this is precisely why new energy vehicle drive motors, which are highly sensitive to weight and space, generally specify high-grade material. Domestic leader Baosteel has non-oriented silicon steel capacity exceeding 2 million tonnes, of which high-grade capacity exceeds 1 million tonnes, accounting for roughly 24% of national high-grade output; Shougang's dedicated high-grade line has a capacity of 550,000 tonnes, and in 2022 the company publicly stated that high-grade products were in short supply — a statement that was time-bound and reflects only the production-and-sales situation at that moment. The pull from the demand side deserves closer attention: according to estimates by China Research and Intelligence (智研咨询), demand for high-grade non-oriented silicon steel from China's new energy vehicle sector will reach approximately 2.04 million tonnes in 2025. Standard grades have long been fully localized, with intense competition and thin margins, while high-grade material is the product of a dual barrier of accumulated technical know-how and capital investment — when downstream demand growth outpaces the pace at which leading producers can expand high-grade capacity, tightness is a condition to be expected as the norm, not an occasional occurrence.
If electrical steel determines whether a motor can be built at all, copper determines whether building it is worthwhile. Copper wire (enameled wire) is the primary material for stator windings, accounting for roughly 30% to 40% of a motor's raw material cost; if copper, aluminum, and steel are combined, the three metals together can account for around 60%. This gives the motor industry a distinctive identity — it is an "amplifier industry" for commodity prices: the higher the share of material cost, the more each swing in copper prices is amplified by the motor's cost structure into an operational-level shock. Industry estimates suggest that for every US$1,000-per-tonne rise in copper prices, the manufacturing cost of a new energy drive motor climbs by roughly 2% to 3%. In 2026 this amplifier was truly triggered: international copper prices rose for seven consecutive months, briefly breaking through US$14,500 per tonne, while domestic futures prices also climbed above RMB 106,000 per tonne; standard motor manufacturers were forced to raise ex-factory prices by 10% to 20%, and the industry showed a divergence of "upstream benefiting, midstream under pressure" — copper mining and smelting captured the price windfall, while motor manufacturing had to absorb the cost, and the divergence itself was uneven: large firms with global procurement capability and scale-based bargaining power could partially hedge, while small and medium motor makers with weaker bargaining power bore the brunt of the price increase passively. Facing this transmission, motor companies' countermeasures cluster around three approaches: adding copper-price pass-through clauses to procurement contracts to shift part of the price risk downstream; substituting some copper conductors with aluminum wire to reduce dependence on copper, known as "using aluminum to save copper"; and pushing brushless conversion — replacing traditional brushed structures with brushless DC motors (BLDC), which indirectly compresses per-unit copper consumption while reducing weight and losses. But all three approaches have their limits: the effectiveness of contract pass-through clauses depends on downstream customers' willingness to accept them, using aluminum to save copper sacrifices some conductivity and adds bulk, and brushless conversion is more of a long-term technology path than a short-term cost-reduction lever — none of the three can fully hedge against the impact of copper price swings, which is exactly why "upstream benefiting, midstream under pressure" keeps being cited as the industry's most immediate feeling in 2026.
Magnet steel is the component with the greatest price elasticity in this trio. A single new energy vehicle drive motor consumes roughly 2.5 kilograms of NdFeB permanent magnet material; in 2024, China's new energy vehicle sector's demand for NdFeB reached 57,000 tonnes, up 38% year-on-year, a sizeable share of total national NdFeB consumption (approximately 195,000 tonnes). Rare earths are the single largest line item in the raw material cost of permanent magnet motors, accounting for roughly half of that cost. In early 2026 this link tightened again: the rare earth price index rose more than 30% from the end of 2025, with terbium oxide prices briefly touching RMB 6.4 million per tonne, an 11-year high. Rare earths tend to rattle motor makers' nerves more readily than electrical steel or copper because they are low in volume, high in value density, and more concentrated on the supply side, giving them far greater price elasticity than bulk metals. It should be candidly noted that reliable public statistics are not currently available to break down NdFeB downstream demand by category — pumps and valves, home appliances, automotive, industrial motors, and so on — and this report does not attempt a numerical breakdown, noting only that new energy vehicles are the primary driver of incremental demand. The sensitivity of rare earth prices is further compounded by the direction of the motor technology shift — the industry is accelerating its migration from induction motors to permanent magnet synchronous motors, and permanent magnet motors are precisely the main vehicle for rare earth consumption, meaning that the weight of rare earth price volatility on the motor industry will keep amplifying as the permanent-magnetization rate rises, rather than being a one-off event. The trio is not independent of one another — electrical steel determines magnetic-circuit losses, copper determines electrical-circuit losses, and magnet steel determines magnetic field strength; together the three determine a motor's power density and efficiency ceiling, and any shortage or price rise in any one of them is directly reflected in finished-motor makers' material-selection decisions and price quotes.
5.2 Two Poles of Auxiliary Materials: The Localization Temperature Gap Between Insulation Materials, Bearings, and Die-Cast Housings
Motor insulation materials are graded into several tiers by heat-resistance class, among which Class H (a heat-resistance rating of 180°C) corresponds to high-speed, high-power-density applications such as new energy vehicle drive motors and some industrial motors. Some categories of these high-grade insulation materials — particularly high-performance insulating varnish, high-temperature-resistant film, and impregnating resin — still rely on imports, and domestic substitutes have not yet fully caught up with mainstream international suppliers on stability and consistency. These auxiliary materials are not expensive on a per-unit basis, but should supply be cut off, what is at stake is whether the motor can meet the threshold requirements of higher-speed, higher-power-density applications — a textbook case of a "small material, big risk" category, in sharp contrast to the three primary materials that account for the bulk of cost, where the primary materials are expensive because of the volumes consumed while the auxiliary materials are expensive because they cannot be substituted. Insulation material grades span different heat-resistance ranges from low to high, with higher grades corresponding to longer insulation life and greater heat-resistance margin. As motors trend toward miniaturization and higher rotational speeds, heat-generation density per unit volume rises, and the required insulation grade rises in step — this is a long-term, structural demand curve rather than a short-term supply-demand gap, meaning that if import dependence on high-grade insulation materials is not substantively eased, it will keep amplifying as the share of high-speed motors rises.
The degree of localization in bearings shows a clear dividing line, with entirely different stories on either side of it. High-speed rail bearings are the hardest sample on this line to crack, and also the one where the results of the effort are most visible: as of the first quarter of 2025, the localization rate for high-speed rail axle-box bearings stood at roughly 38%, and for traction motor shaft bearings at roughly 42%, while Schaeffler and SKF, the two foreign giants, together still hold 62.3% of the imported share — the localization rate has kept climbing over the past several years, but foreign firms' installed-base advantage remains substantial, and substitution is a protracted campaign measured in years. In contrast to the high attention paid to high-speed rail bearings, there is currently no authoritative statistical benchmark for the localization rate of bearings used in general-purpose industrial motors; this report candidly notes this gap rather than filling it with an estimate — this category of "invisible bearings" is enormous in volume yet rarely tracked systematically, which is precisely a reflection of the motor industry's broader condition of being "ubiquitous and high-volume, yet overlooked by everyone." The fundamental reason high-speed rail bearings have continued to receive concentrated resource support in the localization process lies in their safety rating and status as major national equipment, which forces concentrated investment in coordinated industry-university-research-application efforts; general-purpose industrial motor bearings, by contrast, are scattered across the procurement lists of tens of thousands of small and medium motor makers, each purchasing small volumes with weak bargaining power and lacking an organizational vehicle for concentrated effort, so it is naturally difficult to form authoritative localization statistics for them — this contrast is itself a microcosm, at the auxiliary-material level, of the structural industry problem whereby "major equipment gets focused attention while ubiquitous, high-volume products are systematically overlooked."
Motor housings are mostly formed through aluminum alloy die-casting, and the die-casting process determines the housing's heat-dissipation efficiency, structural strength, and machining precision — it is a general-purpose process that links the upstream and downstream stages of motor manufacturing, and it also follows the same lightweighting logic as the "using aluminum to save copper" approach discussed in the previous section. The technical bar for die-casting is lower than for electrical steel, copper, or magnet steel; it is the segment with the most mature domestic supporting supply chain and relatively balanced bargaining power, and it is less often the focus of supply-chain discussions, but it remains an indispensable piece of the complete supply chain — the design of a housing's cooling fins and the uniformity of its wall thickness directly affect a motor's continuous-operation temperature rise, an easily overlooked yet essential link amid the trend toward motor miniaturization and higher power density.
5.3 Cost Structure: The Pricing Fate of a Materials-Intensive Industry
Placing the trio and the auxiliary materials into the finished-motor cost sheet makes clear that motors are a textbook materials-intensive industry. According to research-report estimates, raw material costs for special motors generally fall in the range of 60% to 75% of total cost (Wolong Electric Group Co., Ltd., SHA: 600580, hereafter Wolong Electric, discloses a figure of 68.3%), manufacturing overhead accounts for 15% to 25%, and labor cost only 8% to 12%. This set of ratios determines the pricing fate of the motor industry — the bulk of profit does not sit in the hands of the motor makers themselves, but on the price curve of the upstream material market. When electrical steel, copper, and rare earths enter a price-rising cycle simultaneously, all that motor makers can maneuver within is the already-narrow space of manufacturing overhead and labor cost.
This also explains why the countermeasures listed in the previous two sections — copper-price pass-through clauses, using aluminum to save copper, brushless conversion — have become an industry-wide consensus response rather than a stopgap adopted by individual companies: in a structure where raw materials account for roughly seventy percent of cost, any single failure to pass a material-side price increase downstream directly eats into an already-thin gross margin. From the profit side, each increase in material cost first erodes gross margin and then forces a price hike, and whether that price hike can be passed downstream in turn depends on downstream bargaining power and how tightly contract terms are drawn — along this chain, the operating volatility of the materials-intensive motor industry is, in essence, passively following the commodity cycle, rather than a normal commercial fluctuation driven by autonomous pricing power on the demand side. For most small and medium motor makers, material cost management is not optional — it is the line that determines whether the enterprise can survive the price cycle. Materials-intensive enterprises facing cost pressure commonly pursue two vertical-integration approaches: one is extending into the material segment through equity stakes, joint ventures, and similar means to lock in supply stability and pricing; the other is reducing exposure to price volatility through scaled, centralized procurement and hedging instruments — the specific deployment paths and outcomes at individual companies are left to the company-focused chapter, and only the structural summary is given here.
5.4 Midstream Process: From Stamping and Lamination to Hairpin Flat Wire
The midstream manufacturing process for motors can broadly be summarized into three stages — stamping, lamination, and winding: silicon steel sheet is first stamped into the stator and rotor's laminate pieces, then stacked and pressed sheet by sheet into the core, and finally the winding conductors are embedded into the slots of the stator core and insulation processing is completed. This process chain is mature and stable; it is the foundation that allows the small and medium motor industry to achieve scaled production and sustain thin-margin operations, and it also directly mirrors, on the production side, the cost structure of "materials-intensive, low manufacturing-overhead share" described in the previous section. The stamping stage relies heavily on precision dies and stamping equipment and has a relatively high degree of automation; the precision of the lamination stage directly determines the consistency of the core's magnetic circuit; the winding stage, meanwhile, has long remained relatively labor-dependent — particularly under an order structure of small-to-medium batches and many varieties, the payback period for automated winding equipment tends to be long, which is the practical reason small and medium motor makers still widely use manual round-wire winding processes alongside hairpin winding.
What is truly transforming this process chain is the spread of hairpin (flat-wire) winding technology. Compared with traditional round-wire windings, hairpin windings can raise the slot fill factor (the proportion of the slot filled by conductor) to around 70%, meaning the same slot space can accommodate more conductor, lowering resistive losses and raising power density — precisely why new energy vehicle drive motors favor hairpin windings. But hairpin technology demands far higher precision in forming, welding, and insulation processing than round wire does, and production-line investment runs two to five times that of a round-wire line. According to a single-source estimate, the penetration rate of hairpin motors rose from roughly 15% in 2020 to roughly 70% in 2024; the pace itself shows that hairpin winding has moved from an "optional upgrade" to the "de facto standard" for new energy drive motors. The rising bar for production-line investment also carries a direct consequence: those with hairpin mass-production capability are mostly well-capitalized large manufacturers, or Tier 1 suppliers deeply tied to vehicle makers, which echoes the market stratification in which small and medium motor makers remain concentrated mainly in round-wire, standardized commodity territory — the bar for process upgrades is quietly widening the gap between tiers within the industry. The forming and end-welding of hairpin conductors generally use laser welding, which demands extremely high consistency of weld points and yield control; the production-line ramp-up period often takes several months or longer to reach stable mass-production yield — this is one of the reasons production-line investment runs far higher than for round wire, encompassing not only equipment procurement cost but also the hidden cost of process tuning and yield ramp-up.
5.5 Downstream Overview: Motors Hidden in the Big Three and Two Product Lines
Downstream applications for motors are extremely fragmented, but a handful of major-equipment applications carry the bulk of total electricity consumption. According to a benchmark estimate from the National Energy Conservation Center — data formed in 2016 that reflects the electricity-consumption structure of that time — the three major categories of general equipment, pumps, fans, and compressors, together account for roughly 30% of the nation's total electricity consumption. Although this figure carries a time stamp, it still explains why energy-efficiency retrofits in the pump, valve, and fan industries keep being cited as the main battlefield for motor energy conservation.
Turning to specific categories, air-conditioner compressors are the most typical large-scale downstream application: GMCC (Midea's compressor brand) holds a roughly 34% global market share, and if GMCC is combined with the two other domestic makers, Welling and Highly, the combined domestic market share exceeds 78% — the competitive landscape for air-conditioner compressor motors has already converged tightly into the hands of a small number of leading manufacturers.
Automobiles are another major thread, though there is currently no unified authoritative figure for the number of motors per vehicle, and estimates vary considerably across sources. On balance, an internal-combustion vehicle is fitted with on the order of several dozen motors (dispersed small motors for seats, wipers, doors and windows, cabin blowers, and the like); new energy vehicles, having added new electrified components such as the drive motor, electronic oil pump, and electronic water pump, see the motor count per vehicle climb to close to a hundred — this report offers only a directional range here and does not cite any single precise figure.
Power tools are the most trade-oriented segment of the motor downstream: China's power tool output accounts for over 60% of the global total, and export value reached US$9.758 billion in 2024, up 21% year-on-year — a rare high-prosperity signal against a backdrop of slowing growth across most downstream categories. Beyond the Big Three, home appliances, and automobiles, industrial applications such as machine tools, conveying equipment, and construction machinery are likewise traditional strongholds for small and medium induction motors; these applications are scattered across every corner of manufacturing, statistical definitions are highly inconsistent, and this chapter does not break them down further, leaving that for a dedicated thematic chapter. Together, these downstream applications complete the industry portrait of motors as something "hidden inside everything that turns": the raw-material end is highly concentrated in three categories — electrical steel, copper, and magnet steel — while downstream applications are extremely fragmented, and every material-side price increase travels along this chain from concentration to fragmentation, transmitting layer by layer into almost every branch of manufacturing.
5.6 Business Model: OEM Supply and the Payment-Term Transmission Chain
The business model of the motor industry is highly dependent on downstream customers; the vast majority of motor makers play the role of OEM (original equipment manufacturing, producing to downstream specifications) supporting suppliers — producing to the specifications of finished-equipment makers or system integrators, with their products embedded in downstream customers' final products, and rarely reaching end consumers under an independent brand. This is mutually reinforcing with the industry trait, repeatedly emphasized in earlier chapters, of being "ubiquitous and high-volume yet unable to name a brand": a motor maker's customers are engineers and procurement departments, not end consumers, so the incentive to build a brand is inherently weak. Under the OEM model, motor makers and downstream customers tend to go through a lengthy qualification and integration cycle — onboarding a new customer requires multiple stages such as sample testing, small-batch validation, and mass-production certification, and once certification is passed it creates a high switching cost, which to some extent gives motor makers customer stickiness, but also means the cycle cost of developing new customers is not low — the other side of this business model.
This dependent business model also means motor makers are in a weak position in payment-term negotiations. Taking the automotive supply chain — one of the motor industry's important downstream sectors — as an example, the industry-average payment term has long stood at roughly 121 days; starting in June 2025, a new 60-day payment rule combined with public commitments from 17 automakers began pushing payment terms shorter. It should be noted that this figure is an economy-wide reading for the automotive supply chain, not a dedicated statistic for the motor industry, but as a component supplier within the automotive supply chain, motor makers are equally caught up in this payment-term negotiation chain. With upstream material prices under pressure from rising copper and rare earth costs, and downstream payment terms slow to shorten meaningfully, motor makers being squeezed from both ends is precisely the shared structural fate of materials-intensive, OEM-supplying industries.
Chapter 6: Competitive Landscape and Key Enterprises: Giants Without Brands
6.1 3,802 Above-Scale Enterprises, and a Concentration Report That Does Not Exist
In disclosing operating data for the first three quarters of 2025, the China Electrical Equipment Industry Association (CEEIA) offered a reference frame: 3,802 above-scale enterprises in the motor industry, with revenue up 19.6% year-on-year and profit up 22.8%, both outpacing the machinery industry and national industry as a whole. Within the same association system, the Small and Medium-sized Motor Branch has 213 member units. The gap between these two figures itself illustrates the shape of the industry — even counting only above-scale enterprises, there are still 3,802 of them; even counting only the small and medium motor makers with enough scale and willingness to join the association, there are still more than two hundred.
The next question follows naturally: what share do the top five hold? The top ten? The answer is that there is no answer. Several sets of concentration figures for the motor industry circulate in the market, differing from one another by as much as an order of magnitude, none traceable to a standardized source, and none officially released by an association or statistical authority. This report's approach is to state the matter plainly: this is a highly fragmented industry that lacks authoritative concentration statistics.
The absence of statistics is not an oversight in statistical work — it is that the statistical object itself does not hold together. The "motor industry" is not one market; it is dozens of markets sharing one name. The vibration motor in a mobile phone and the traction motor in a high-speed train are both motors, yet the former is priced in fractions of a yuan and the latter in millions of yuan; a cross-flow fan motor in an air conditioner and a nuclear main pump motor are both motors, yet the former's customer is an appliance maker's procurement department while the latter's customer list numbers fewer than twenty nationwide. Summing the revenue of these products into a single denominator and then calculating any given company's share yields a number with no operational meaning whatsoever. If the denominator does not hold together, the share naturally cannot be calculated.
This makes it possible to answer the larger question posed at the opening of this chapter: why has this industry, which manufactures everything that turns, failed to produce a single mass-market brand across a century and a half? The answer has four layers, and all four concern the industry's position in the value chain, not its marketing capability.
- The first layer is position. The motor is a component; the purchasing decision is made in the finished-equipment maker's engineering and procurement departments, never in the hands of the consumer. People buy air conditioners, washing machines, elevators, electric bikes — the motor does not even earn a line in the product manual. A product that never faces the end user has no channel through which to build an end-user brand.
- The second layer is standards. The IE1-through-IE5 classification of IEC 60034-30-1 defines efficiency, the frame-size system defines mounting dimensions and shaft extension, and national standards fix both performance and interfaces — two motors of the same frame size and the same efficiency class are physically interchangeable. When a product's most critical attributes are defined by a standard rather than by the manufacturer, brand premium has nowhere to land, and the only competitive dimensions left are price, delivery time, and reliability track record.
- The third layer is channel. A special-motor maker's customer list may run to only a few dozen names, and a single seasoned sales engineer knows every key decision-maker personally. The economics of brand communication simply do not hold up under this customer structure: who would the advertising even be aimed at?
- The fourth layer is that vertical integration absorbs the name. In 2024, the top-ranked supplier of new energy passenger-vehicle e-drive systems in China was FinDreams Powertrain, with a share of roughly 31.7%, and it is an in-house component company of a vehicle maker whose products are almost never sold externally. On the appliance side: the top three domestic air-conditioner compressor makers — GMCC, Welling, and Highly — together hold more than 78% share, and two of the three belong to appliance-group parents. The end-product brand absorbs the component brand into its own name; the consumer remembers the air conditioner's brand, not the compressor's brand, let alone the brand of the motor inside the compressor.
An overseas reference frame is useful for calibrating intuition here: according to Omdia, the global low-voltage motor leader in 2025 was WEG with a 16% share, followed by ABB at 15.5%. Even the global champion captures only about one-sixth of the market, and fragmentation within China can only be more pronounced. The phrase "giants without brands" describes precisely this condition — the industry contains companies with revenue exceeding RMB 10 billion that rank first in the world within their niche, yet their names circulate only within customers' lists of qualified suppliers.
6.2 Wolong Electric: A Global No. 1 That a Township Motor Factory Bought Over Forty Years
Wolong Electric (SHA: 600580, Shangyu, Shaoxing, Zhejiang) traces its origins to the Shangyu County Multi-Speed Micro Motor Factory, founded in 1984. Forty years later, according to Frost & Sullivan, it ranks first globally in explosion-proof e-drives, fourth in industrial e-drives, and fifth in HVAC e-drives. The path from township enterprise to global No. 1 was not a technological leap — it was three cross-border acquisitions.
In 2011, Wolong acquired Austria's ATB, then Europe's third-largest motor maker, for roughly EUR 101 million, a deal that brought European high-voltage and explosion-proof product lines along with European certification systems and customer relationships. Between 2014 and 2015, it acquired Italy's SIR and OLI vibration motor businesses (public sources give two different years for these two deals). In 2018, it acquired General Electric's medium- and low-voltage industrial motor business for US$160 million, gaining North American distribution channels and a set of industrial customers. All three acquisition targets were established industrial motor assets, not technology upstarts — what was bought was product catalog breadth, certifications, and customer relationships, precisely the three things hardest to build in-house and most time-consuming to acquire in the special-motor track.
The 2025 financials offer another clue. Full-year revenue was RMB 15.454 billion, down 4.88% year-on-year, or up 2.59% excluding the effect of the divestiture; net profit attributable to the parent was RMB 1.126 billion, up 42.04% year-on-year; gross margin was 25.37%. Revenue falling while profit surged came from the same move: divesting the new energy vehicle motor business and redirecting resources back to the core industrial business. Explosion-proof motors contributed RMB 4.633 billion, industrial motors RMB 4.095 billion, and HVAC motors RMB 4.958 billion — the three together make up 88.5% of the base business. Overseas revenue accounted for 41% of the total; the company completed its first self-built overseas plant in Haiphong, Vietnam in 2018, and roughly 80% of its supply to the Americas comes from its Monterrey, Mexico plant (the latter figure comes from an investment-advisory-type source and should be treated with caution).
What the capital markets are truly chasing is the other 3.34%. In 2025, Wolong's robotics and motion-control components business generated revenue of RMB 516 million, up 14.13% year-on-year, accounting for 3.34% of total revenue. It is a primary supplier of frameless torque motors to Unitree — Unitree's H2 has 31 joints across its body, and the frameless torque motors inside those joints come from this forty-one-year-old motor maker; Wolong has also established a joint venture with AgiBot involving cross-shareholding. "A second spring for an old motor factory in robotics" is an accurate description, but the two sets of figures need to be read side by side: the imaginative scope of dozens of joint motors per humanoid robot is large, yet its actual contribution to the 2025 financial statements is 3.34%. At today's scale, Wolong's robotics business looks more like an option than an established line of business; its value lies in positioning, not in current-period profit.
6.3 Broad-Ocean Motor: Selling Motors at an Average of Just Over RMB 80 a Unit
Zhongshan Broad-Ocean Motor Co., Ltd. (SZE: 002249, Zhongshan, Guangdong) posted 2025 revenue of RMB 12.221 billion and net profit of RMB 1.083 billion, up 21.99% year-on-year. It runs two business lines: building and household appliance motors, at RMB 6.902 billion with sales volume of 78.64 million units, and automotive components (dominated by new energy vehicle e-drives), at RMB 5.178 billion, with oil-cooled X-pin hairpin motors already in mass production.
Dividing the building-and-household-appliance segment's revenue by its sales volume yields an average of under RMB 90 per unit. This price is the most literal footnote to "ubiquitous and high-volume," and it also answers the brand question raised in Section 6.1: at a unit price of just over eighty yuan, no brand investment can ever be recouped, and the outcome is decided purely by copper consumption, yield rate, automation rate, payment terms, and scale. Broad-Ocean's path has been to carry the large-scale, low-cost manufacturing capability honed through Pearl River Delta appliance supply chains across into automotive e-drives — the two businesses share no customers whatsoever, yet they draw on the very same underlying capabilities.
6.4 Jiadian Co.: Four Thousand Variants and Two Licenses
Jiadian Co., Ltd. (SZE: 000922, Jiamusi, Heilongjiang), a subsidiary of Harbin Electric Group, posted 2025 revenue of RMB 4.92 billion and net profit of RMB 254 million, of which nuclear power products contributed RMB 998 million, up 14.8% year-on-year. It is the domestic leader in explosion-proof motors and nuclear main pump motors, with a product range covering 347 series and nearly 4,000 variants and annual capacity above 18.6 million kW; the company describes itself as having "deep roots spanning more than 80 years."
Placing Jiadian and Broad-Ocean side by side reveals two entirely different businesses within China's motor industry. Broad-Ocean sells 78.64 million building-and-household-appliance motors a year, with a single model potentially running to several million units; Jiadian, meanwhile, has to maintain nearly 4,000 variants a year, a considerable share of which are produced in the mere dozens or hundreds. The former is a scale business where the cost curve decides survival; the latter is a catalog-breadth business where the barrier lies not in manufacturing but in market access — explosion-proof certification, nuclear safety equipment manufacturing licenses, and first-unit-in-service track records are qualifications that must be accumulated year by year, and a new entrant can buy equipment with capital but cannot buy time. The double-digit growth in the nuclear power segment also illustrates another feature of the special-motor track: demand follows major engineering projects, and its correlation with the macro cycle is far lower than for general-purpose motors.
6.5 XEMC: An Old Factory's Growing Revenue, Shrinking Profit
XEMC (Xiangtan Electric Manufacturing Co., Ltd., SHA: 600416, Xiangtan, Hunan) traces its lineage back to the Central Electrical Manufacturing Works founded by the Nationalist government in 1936, one of the 156 key projects of the First Five-Year Plan period, and it built China's first AC mainline electric locomotive in 1958. According to the company, its market share stands at 100% in marine electric propulsion and specialized launch systems.
In 2025, XEMC's revenue was RMB 4.888 billion, up 3.97% year-on-year, while net profit attributable to the parent was RMB 225 million, down 9.72% year-on-year. More noteworthy is the composition of that net profit: profit excluding non-recurring items was just RMB 7.47 million, against government subsidies of RMB 145 million for the period. By segment, motor-business revenue was RMB 2.913 billion, up 16.8% year-on-year, yet gross margin fell to 7.97%.
Selling more while earning less — XEMC is the clearest sample of "growing revenue, shrinking profit" in this round. The pressure comes from both ends: upstream, copper prices have kept climbing — international copper prices rose for seven consecutive months in 2026 and domestic futures broke through RMB 106,000 per tonne, while raw materials already account for over 60% of motor cost; downstream, standard motors face a bidding price war, with customers holding quotes from dozens of comparable suppliers. A gross margin of 7.97% means that after deducting selling, R&D, and administrative expenses, almost nothing is left from the core business, and the bottom-line profit can only be propped up by subsidies.
Placing XEMC alongside Wolong sharpens the contrast further: both take industrial motors as their core business, yet one has a motor-segment gross margin of 7.97% while the other has an overall gross margin of 25.37% — a difference of more than threefold. The gap is not about equipment or process, but about product mix and bargaining position — Wolong's revenue center of gravity sits in categories like explosion-proof and HVAC that carry certification barriers and command overseas premiums, while a larger share of XEMC's motor segment is exposed to price competition in general-purpose products.
6.6 Jiangte Motor: The Cost of Diversification
Jiangxi Special Electric Motor Co., Ltd. (SZE: 002176) posted 2025 revenue of RMB 1.955 billion and a net loss of RMB 369 million. Breaking it down, the motor business generated revenue of RMB 1.025 billion, up 5.51% year-on-year, accounting for more than half of total revenue and still growing; the entire loss came from the lithium-salt business.
A motor business is one with slow growth, low volatility, and stable cash flow. Using it as the base to carry the price elasticity of a cyclical commodity looks excellent on the books during an upswing, but during a downswing, a full year of profit from the core business is not enough to fill a single quarter's hole in the side business. Jiangte's motor business itself has nothing wrong with it; what went wrong was the risk exposure of the asset portfolio. For an industry whose average gross margin is not high to begin with, this is a cautionary counter-example worth remembering: a motor business's stability is its greatest asset, and when that stability is mortgaged in exchange for elasticity, the cost is usually borne by the core business.
6.7 New Energy E-Drives: A Third Taken by Captive Supply, the Rest Just Finishing the Loss Curve
In 2024, China's new energy passenger vehicle e-drive installations totaled 7.758 million units, up 41.72% year-on-year. This is already a mature, high-volume market, yet its landscape differs completely from that of traditional motors.
Ranked first is FinDreams Powertrain, with a share of roughly 31.7% (on a January–November 2024 basis). It is the in-house e-drive division of a vehicle maker, serving only that maker's own models and rarely competing for external orders. In other words, a third of this market's volume is allocated before competition even begins. The top-ranked third-party player is Inovance United Automotive Electronic Systems (联合动力), with roughly 11% share of the motor-control segment in the first half of 2024, revenue of RMB 10.4 billion in the first three quarters of 2024 (up 96% year-on-year), and a planned IPO fundraising of RMB 4.86 billion. The remaining third-party makers compete for share in the space left after captive supply claims a third of the market, while also facing prices that vehicle makers push down year after year.
Jing-Jin Electric's (SHA: 688280) ten-year curve is the fullest evidence for the judgment that "e-drives don't make money" — and also the fullest evidence of that judgment being broken. In the first half of 2022, Jing-Jin Electric's gross margin was -3.84% — for every e-drive unit sold, it could not even recoup the material and manufacturing cost. For all of 2024 it still posted a net loss of RMB 436 million. By 2025, revenue reached RMB 2.729 billion, up 109.11% year-on-year, with net profit of RMB 150 million — its first full-year profit since listing.
The shape of this inflection point deserves a closer look. Revenue doubled in a single year, while net profit swung from -RMB 436 million to +RMB 150 million. No new technology generation appeared in between — what appeared was shipment volume. E-drives are a classic asset-heavy, high-fixed-cost business: production-line investment for hairpin stators runs two to five times that for round wire, and oil cooling and multi-in-one integration raise the bar for a single production line even further. Below a certain capacity-utilization threshold, every unit sold fails to absorb its share of depreciation; once shipment volume crosses a certain point, the marginal cost on that same production line falls rapidly, and profit is released in a non-linear fashion.
Zhejiang Founder Motor Co., Ltd. (SZE: 002196, Lishui, Zhejiang) offers a second coordinate that pins down this break-even line more precisely. By the end of 2023, Founder Motor's cumulative drive-motor shipments had reached nearly 2.6 million units, still without turning a profit; by 2025, cumulative shipments exceeded 4 million units across nearly 50 vehicle models, with full-year revenue of RMB 2.915 billion, up 17.82% year-on-year, and net profit of RMB 21.01 million, moving into the black. These two data points bracket the break-even point somewhere between 2.6 million and 4 million units. Zhuhai Enpower Electric Co., Ltd. (SZE: 300681, Zhuhai, Guangdong) follows the same path: 2025 revenue of RMB 3.874 billion, up 59.45% year-on-year, and net profit of RMB 186 million, up 161.62% year-on-year — a profit-growth rate several times the revenue-growth rate, the classic pattern of fixed-cost dilution once a company has crossed the break-even line.
During the same period, one side advanced while the other retreated. Just as China's third-party e-drive makers were crossing the break-even line one by one, Nidec Corporation — the world's earliest mass producer of e-Axles — announced in May 2026, after booking massive restructuring charges, that it would dissolve its China-Europe joint venture and exit the business. The pioneer's exit and the latecomers' turn to profit together show that the deciding factor in this track is not being first to market, but whether a company can outlast the price rhythm and volume-ramp rhythm of the Chinese market long enough to reach scale. The entry barrier in the e-drive industry has never been technology — it is the capital depth and order visibility needed to survive the loss-making period.
6.8 Micro-Special Motors and the Robotics Concept: Three Anchors of Actual Performance
If the e-drive track's story has already entered its second half, the micro-and-special-motor and robotics-motor side remains at a stage where expectations far outrun actual performance. Four listed companies plus one chip maker form the best sample for observing this side.
Shanghai Moons' Electric Co., Ltd. (SHA: 603728, Shanghai) posted 2025 revenue of RMB 2.762 billion, up 14.32% year-on-year, and net profit of RMB 61.13 million, down 21.54% year-on-year. Its product positioning is strong — it sits in the top global tier for coreless motors and stepper motors, with robotics-segment revenue up 22% year-on-year. The gap shows up in expectations — analysts had once projected 2025 net profit of RMB 139 million, up 79% year-on-year, versus the actual outcome of RMB 61.13 million, down 21.54% — a gap separated by nothing less than a flipped sign. The gap between expectation and actual results need not be read as anything sinister; the structure alone tells the story clearly enough: the base for robotics-related revenue is still small, and no growth rate, however high, can offset the price pressure on the general-purpose micro-and-special-motor side.
Jiangsu Leili Motor Co., Ltd. (SZE: 300660, Changzhou, Jiangsu) posted 2025 revenue of RMB 4.179 billion, up 18.77% year-on-year, and net profit of RMB 299 million. Home-appliance motors, at RMB 2.303 billion, form the base business, while automotive motors, at RMB 940 million (up 53.5% year-on-year), provide the increment. This is the most typical pivot path for micro-and-special-motor makers: taking the cost-control and rapid model-changeover capabilities honed in appliance supply chains and applying them to higher-priced, more strictly certified automotive-grade orders, with the base business feeding the new category.
Shenzhen Zhaowei Machinery & Electronics Co., Ltd. (SZE: 003021, Shenzhen, Guangdong) posted 2025 revenue of RMB 1.716 billion, up 12.52% year-on-year, and net profit of RMB 254 million. It is one of the most closely watched names under the dexterous-hand concept, yet dexterous-hand revenue in the first three quarters of 2025 was just RMB 15.53 million, or 1.2% of total revenue.
Hangzhou Weiguang Electronic Co., Ltd. (SZE: 002801, Hangzhou, Zhejiang) posted 2025 revenue of RMB 1.475 billion and net profit of RMB 364 million, up 65.22% year-on-year, for a net margin of nearly 25% — the highest of any company in this chapter; but profit excluding non-recurring items fell 9.08% year-on-year, indicating that profit growth did not all come from core operations. Weiguang makes refrigeration-cabinet motors and external-rotor fan motors — a narrow niche cultivated for a long time, and a sample of high returns from a small track.
Fortior Technology (SHA: 688279) posted 2025 revenue of RMB 774 million, up 28.91% year-on-year, net profit of RMB 219 million, and a net margin of roughly 28%. It does not make the motor itself, but BLDC drive chips — on the same value chain, the control side's profit margin runs a notch higher than the manufacturing side's: for the same brushless motor, added value is migrating from copper and silicon steel toward algorithms and chips.
Placing three anchors of actual performance side by side: Wolong's robotics components account for 3.34% of revenue, Zhaowei's dexterous hand accounts for 1.2% of revenue, and Moons' full-year net profit was RMB 61.13 million. Add one more market-level anchor — the frameless torque motor, the single most core component of a humanoid robot joint, had a China market size of RMB 180 million in 2023 and RMB 209 million in 2024. The so-called "most expensive stage" currently has a real size on the order of a few hundred million RMB. Pointing out the true scale of this figure is not a rejection of the direction — it is a reminder: robotics motors today are a valuation story, not yet a revenue story, and the distance between the two must be filled with shipment volume, not with forecasts.
6.9 CRRC Zhuzhou Electric: The One That Doesn't Need to Report a Share
CRRC Zhuzhou Electric Co., Ltd. is a wholly owned subsidiary of CRRC Corporation Limited. Of the nine core technologies underpinning high-speed rail, it is the sole domestic company that handles both traction motors and traction transformers. In 2019, it released the TQ-800 permanent magnet traction motor, designed for 400 km/h operation; according to Xinhua, permanent magnet traction delivers energy savings of up to 30% compared with conventional AC traction.
Regarding its market share, this report offers only a qualitative statement: it holds a dominant position in the supply of traction motors for domestic mainline railways. Several sets of market-share percentages circulating publicly contradict one another and come from unreliable sources, and are therefore not cited.
What is worth analyzing is precisely why it does not need to answer the share question. Procurement of mainline railway traction systems takes place within a closed technical and institutional framework, where supplier qualification is determined by type testing, reliability verification, and in-service track record — share here is not the outcome of competition but the outcome of allocation. Its rival is not a domestic peer but the engineering timeline required to take permanent magnet traction from prototype to full-lifecycle reliability. This also supports, from another angle, the conclusion of Section 6.1: within the motor industry, some sub-markets simply do not operate on share-based logic at all.
6.10 Foreign Firms in China: Thirty Years Later, They Have Become Chinese Capacity
Foreign motor giants have been present in China for over thirty years, and their form today is entirely different from when they first entered.
- Nidec: its Dalian new energy motor base came online in 2021 with planned capacity of 3.6 million units; its Pinghu industrial park hosts 17 subsidiary companies under the group; its Dongguan base produces roughly 160 million motors a year.
- ABB: Shanghai ABB Motor has been in China for thirty years, its Shanghai high-voltage motor operation for twenty, and it also runs a generator base in Nanchang.
- Innomotics: its Tianjin joint venture plant was formerly Siemens Drive Technologies, renamed in 2024 following the spin-off of its parent company's motor business, and was the first to launch IE5 products meeting the national standard's Class 1 (highest) energy-efficiency tier.
- Mabuchi Motor: its Dongguan base employs nearly ten thousand workers; Dalian Mabuchi, established in 1987, was the first 100%-owned subsidiary of a Japanese company in China.
- Johnson Electric: operates from bases in both Shenzhen and Changzhou (a clarification is needed here: Hong Kong-listed Johnson Electric Holdings Ltd. and A-share-listed Dechang Co., Ltd. are two entirely unrelated companies with no equity relationship, and the two have even sued each other over trade-name rights — their financial and business data must not be conflated).
A change of role has taken place over these thirty years. In the early period of entry, foreign firms brought technical standards, process systems, and management methods, and local manufacturers absorbed the fundamentals of modern motor manufacturing through supply-chain participation and talent flow; today, foreign-invested plants in China mainly provide capacity and export capability.
A set of mutually corroborating figures spells this change of role out clearly. According to the China Electronic Components Industry Association's information center, of global micro-and-special-motor sales, Japanese firms hold 40.8% and mainland Chinese firms 33.3%. Yet Mabuchi ended mass production in Japan back in 1990 and shifted to 100% overseas production, now producing over 1.4 billion units a year; Nidec alone produces roughly 160 million motors a year at its Dongguan base. The sales figures are booked to Japanese companies, while the physical output overwhelmingly takes place in Pearl River Delta workshops. A share table measures financial attribution and brand attribution, not manufacturing geography — this, once again, explains why China is the world's largest motor manufacturing base yet has exported almost no motor brand of its own.
6.11 Cross-Sectional Synthesis: One Industry, Three Tracks
Placing all the companies analyzed individually in this chapter into a single table, what strikes the eye first is not the gap in scale, but the gap in the shape of returns.
| Company | 2025 Revenue | Net Profit Attrib. to Parent | Primary Track | Competitive Key |
|---|---|---|---|---|
| Wolong Electric | RMB 15.454 billion | RMB 1.126 billion | Explosion-proof · Industrial · HVAC | Global product catalog and M&A integration |
| Broad-Ocean Motor | RMB 12.221 billion | RMB 1.083 billion | Appliance motors · Automotive e-drive | Scale and per-unit cost |
| Jiadian | RMB 4.92 billion | RMB 254 million | Explosion-proof · Nuclear power | Certification and track record |
| XEMC | RMB 4.888 billion | RMB 225 million | Industrial motors · Marine propulsion | Special qualifications and structural adjustment |
| Jiangsu Leili | RMB 4.179 billion | RMB 299 million | Appliance micro motors · Automotive | Category migration |
| Enpower Electric | RMB 3.874 billion | RMB 186 million | New energy e-drive | Volume ramp diluting fixed costs |
| Founder Motor | RMB 2.915 billion | RMB 21 million | New energy e-drive | Shipment volume crossing break-even |
| Moons' Electric | RMB 2.762 billion | RMB 61 million | Stepper · Coreless | High-end micro-special and robotics positioning |
| Jing-Jin Electric | RMB 2.729 billion | RMB 150 million | New energy e-drive | First full-year profit |
| Jiangte Motor | RMB 1.955 billion | -RMB 369 million | Motors · Lithium salts | Dragged down by asset portfolio |
| Zhaowei Machinery | RMB 1.716 billion | RMB 254 million | Micro-drive systems | Dexterous-hand positioning |
| Weiguang Electronic | RMB 1.475 billion | RMB 364 million | Refrigeration-cabinet motors · External-rotor fans | Deep cultivation of a narrow track |
Weiguang, with revenue of RMB 1.475 billion, earned RMB 364 million in net profit, while XEMC, with revenue of RMB 4.888 billion, earned net profit attributable to the parent of only RMB 225 million — of which only RMB 7.47 million excluding non-recurring items — in the motor industry, scale does not automatically convert into profit. What determines the shape of returns is the track a company sits on, and the whole industry's tracks can be distilled into three.
- Standard products compete on cost. Small and medium induction motors, appliance motors, general-purpose fans, and water pump motors belong to this track. Products are defined by national standards and frame-size systems, customers put projects out to bid on price and delivery time, and comparable suppliers number in the hundreds. Unit prices commonly sit at the order of a few hundred yuan — Broad-Ocean's building-and-household-appliance motors average under RMB 90 per unit — and every percentage point of gross margin comes from copper consumption, slot fill factor, automation rate, and scale. XEMC's motor-segment gross margin of 7.97% is the reading from the deepest point of price war on this track. The long-term winners on this track will only ever be the handful with the best-optimized cost structure.
- Special products compete on qualification. Explosion-proof motors, nuclear power motors, marine electric propulsion, and mainline traction motors belong to this track. Products here are defined by certification, catalog breadth, and in-service track record. Jiadian's nearly 4,000 variants, CRRC Zhuzhou Electric's dominant position in mainline traction, and XEMC's marine propulsion and specialized launch systems all share one thing in common: no new entrant can compress time with capital alone — an explosion-proof certificate, a first-unit grid-connected trial run, all must be counted in years. Wolong's forty years and three cross-border acquisitions followed precisely this same logic: if you cannot buy time, buy a company that already owns it.
- New stages compete on positioning. New energy e-drives and robotics motors belong to this track, and the landscape has not yet converged. E-drives have already scaled up — domestic new energy passenger vehicle installations reached 7.758 million units in 2024 — but a third of that is taken by captive vehicle-maker supply, and third parties only began crossing the break-even line one by one in 2025; robotics motors, meanwhile, remain at a starting point on the order of a few hundred million RMB, with their share of individual companies' revenue ranging from 1% to 3.34%. The financial profile during this positioning phase is remarkably consistent: revenue share is extremely low, investment cannot stop, yet valuation weight is extremely high.
The three tracks differ in customers, in barriers, in cycles, and in what decides winners — standard products compete on cost, special products compete on qualification, new stages compete on positioning. Their only shared trait is that not one of them leads to the consumer. The reason this industry, which manufactures everything that turns, still has no mass-market brand is not that these companies are not big enough, but that every position they occupy sits one layer behind the end product: their customers are engineers, their deliverable is a single line item in a list of qualified suppliers, and their value is ultimately written into the brand of an air conditioner, an elevator, a car, or a high-speed train. This industry has never lacked giants — what it lacks is simply the position where an end user could ever call out its name.
Chapter 7: Industrial Belts: The Heart Hidden Beside the Cluster
7.1 The Geographic Expression of "Ubiquitous and High-Volume"
Industrial-belt research usually has a default subject: a single end-product category concentrated densely on one patch of land — lighting fixtures, textiles, wire mesh — a product consumers can name directly, so the cluster's boundary comes into focus naturally. Motors do not belong to this category. A motor is an intermediate good; it does not appear on a store shelf, and it rarely even appears on a finished product's marketing page. Its geographic distribution does not follow consumer attention — it follows only two more mundane laws.
The first law is following the downstream customer. The motor is a shared component across pumps, fans, compressors, appliances, machine tools, and automobiles; wherever there is a manufacturing cluster with rotating parts, a cohort of motor makers has almost certainly grown up within a hundred-kilometer radius. Wenling, Zhejiang, home to the country's largest pump-manufacturing base, has motor factories sitting right beside its pump factories; Zhongshan and Shunde (Foshan), Guangdong, major home-appliance centers, concentrate air-conditioner fan and washing-machine motor capacity along the western shore of the Pearl River estuary; Changzhou, Jiangsu, having assembled the full chain of new energy vehicle assembly, batteries, e-drives, and charging piles, naturally grew a drive-motor and micro-special-motor supply segment in the middle of that chain. An electric motor industrial belt rarely exists independently — it behaves more like a heart supplier attached beside someone else's cluster, pumping at whatever rate the downstream cluster's own pulse demands.
The second law is path dependence rooted in historical endowment. A handful of places have no local downstream base at all, yet have built motors into a pillar industry through sheer will: Fu'an, Fujian, a county-level city in the mountains of eastern Fujian, has lived off a single product — the motor — for forty years; Shangyu, Zhejiang, grew from a small township factory into the world's No. 1 explosion-proof motor maker; Boshan, Shandong, still holds onto more than forty old factories making special-form motors. What these three places share is an early start, a single lead factory, and a subsequent reliance on exports or nationwide supply relationships to move capacity, rather than on local customers to absorb it.
The two laws combined are precisely the geographic version of the phrase "ubiquitous and high-volume": the distribution map of motor factories is almost a shadow cast by the map of China's manufacturing clusters itself — only ever one step behind, one layer beneath, and never signed with its own name. This chapter walks through that map — from Fu'an, the place most deserving of the title "capital," to Shangyu, the place that most resembles "one city, one company," to the Pearl River Delta, whose statistics are the murkiest, and finally back to the old factories left behind by the planned economy. By the end, it becomes clear that the geography of China's motor industry is in fact an overlay of two maps — and the two barely coincide.
7.2 Fu'an, Fujian: Forty Years of a Small Mountain Town
Fu'an sits in the mountains of eastern Fujian, administered by Ningde, and lies on none of the trunk lines of any traditional manufacturing corridor, yet it is the only place in the country to carry the title "China's Capital of Small and Medium-sized Motors." The title was first awarded in 2009 and successfully re-reviewed twice, in 2014 and 2019. Beyond that, Fu'an has also secured a string of designations including China Export Base for Small and Medium-sized Motors, National Torch Program Small and Medium-sized Motor Specialty Industrial Base, and the country's first National-level Export Motor Quality and Safety Demonstration Zone. The sheer density of these titles itself makes a point: Fu'an's motor industry was not pulled up by local downstream demand — it was propped up by exports, which is why what it needs most is not supply-chain certification, but export qualification and quality endorsement.
In terms of scale, Fu'an is home to nearly a thousand motor, electrical-equipment, and supporting enterprises, of which 124 are above-scale, 18 have annual output value exceeding RMB 100 million, and total employment exceeds 50,000 — these figures date to around 2019. Another set of material puts local motor-industry employment at over 80,000; the gap with the 50,000 figure stems from differences in the statistical year and scope, with the latter figure likely also including related industries such as massage and health-care devices. This report presents both figures side by side and notes the discrepancy in years rather than merging them. What genuinely anchors the industry's standing is its share: Fu'an accounts for roughly one-fifth of national small and medium motor output and exports, and nearly 60% of the same industry within Fujian province. As for the recent situation, from January through April 2026, Fu'an's motor and electrical-equipment industry recorded above-scale output value of RMB 6.934 billion, up 21.55% year-on-year. There is also a circulating annual output-value figure framed around an "electric motor industrial park," whose order of magnitude does not match the monthly series cited above and whose source and statistical scope are unclear; this report does not adopt it.
At the planning level, the Fujian Provincial Department of Industry and Information Technology and four other departments jointly issued the Several Measures on Supporting the High-Quality Development of the Motor, Electrical Equipment, and Massage Equipment Industries in Fu'an City, which sets a target of exceeding RMB 50 billion in full-chain scale by 2027. The pairing of "motors and electrical equipment" with "massage equipment" in the document's title itself reveals the structure of Fu'an's industrial belt: it is a composite built around the motor as its core, extending downstream into water pumps, generator sets, gasoline-and-diesel generator sets, and electronic health-care and medical devices. In other words, Fu'an is a sample of upstream pushing downstream into existence — the motor came first, and things that use the motor grew up afterward. This is the exact reverse of Wenling's path, where downstream pulled upstream into being; the two constitute two opposite directions of industrial-belt evolution.
Fu'an's starting point was Fujian Mindong Electric Motor Co., Ltd. At the very start of the reform-and-opening era, this enterprise pulled ahead through internal reform, becoming the only company in the national machinery industry to win the National Quality Gold Award three times in a row. Its YC-series motors pushed foreign brands out of the Southeast Asian market within three years, and the comparison detail passed down from that time is almost blunt in its simplicity: on the same water-supply system, an installed British motor could only pump water up to the 10th floor, while switching to a Mindong motor could push it to the 15th. Looking back today, this was not a victory in the sense of a technological generation gap — China's small and medium motor makers at the time had introduced no new principle or new material; what won was "good enough, cheap, and fast delivery" within the same tier of technology. And it is precisely this playbook that has shaped how China's small and medium motor makers have operated in the global market for the forty years since — a logic highly similar to the path by which WEG, discussed in Chapter 2, climbed to become the world's No. 1 low-voltage motor maker through cost and M&A.
By the 1990s, Fu'an's privately owned motor enterprises had spread rapidly, with products extending from a single motor category into more than a dozen categories — electric motors, water pumps, generators, gasoline-and-diesel generator sets, electronic health-care and medical devices — spanning more than 300 series and over 2,000 specification variants. The true mechanism by which Fu'an turned from "one factory" into "one belt" was the fission of a single state-owned plant's technology, blueprints, and people into more than a thousand small private factories. A saying circulates among local business owners that "one in every four generators made in China comes from Fu'an," but this claim has no statistical backing whatsoever and can only be treated as practitioners' self-description, not cited as share data.
Fu'an's forty years make clear both the conditions and the cost of a small town building itself on an intermediate good. The conditions are three: an early start, reliance on exports, and growth through fission. The cost is equally clear: of nearly a thousand enterprises, only 124 are above-scale, meaning the overwhelming majority are small and micro factories with limited individual scale, thin technical reserves, and weak capital-spending capacity. The mandatory energy-efficiency upgrade discussed in Chapter 3 is a product-line upgrade for large firms, but a cash-flow threshold for this cohort of small and micro factories. Whether the RMB 50 billion full-chain target can be realized will ultimately depend not on the output value of the leading enterprises, but on whether this cohort of small and micro factories can clear the next step beyond the mandatory IE3 floor.
7.3 Zhejiang's Twin Cities: Shangyu's One Company and Wenling's One Pump
Zhejiang contributes two starkly different samples to the motor map: one an extreme case of concentration, the other an extreme case of symbiosis.
Shangyu's sample is Wolong. In 1984, the Shangyu County Multi-Speed Micro Motor Factory in Shaoxing opened for business, an entirely unremarkable name among the township enterprises blossoming everywhere at the time; it was renamed Wolong Motor in 1991, listed on the Shanghai Stock Exchange in 2002, and took its current name, Wolong Electric Group Co., Ltd. (SHA: 600580, hereafter Wolong Electric), in 2019. Forty years later, according to Frost & Sullivan, Wolong Electric ranks first globally in explosion-proof e-drives, fourth in industrial e-drives, and fifth in HVAC e-drives. The key moves in between were two cross-border acquisitions: acquiring Austria's ATB, then Europe's third-largest motor maker, for roughly EUR 101 million in 2011, and acquiring General Electric's medium- and low-voltage industrial motor business for US$160 million in 2018 — a township factory that, over the span of some twenty years, bought its European peers straight into its own financial statements.
Shangyu has thereby become a rare "one city, one company" sample in industrial-belt research: it does not satisfy the usual definition of a cluster, since there are no hundreds or thousands of similar local enterprises supporting and competing with one another — there is only one absolutely dominant player. The reason lies in the expansion economics of the motor industry. The competitiveness of small and medium motor makers comes from the breadth of specification coverage and manufacturing cost, and the fastest way to broaden specification coverage is to buy someone else's already-mature product lines, capacity, and channels — not to replicate a batch of small factories at home. Shangyu's industrial geography is thus, in essence, the headquarters projection of a "one company, many cities" structure: Shangyu retains the headquarters, R&D, and part of the production capacity, while the real capacity map is spread across Yinchuan, Wuhan, and overseas — the company completed its first self-built overseas plant in Haiphong, Vietnam in 2018, roughly 80% of its supply to the Americas comes from its Monterrey, Mexico plant (the latter figure from an investment-advisory-type source), and overseas revenue accounted for 41% of company total revenue in 2025. Viewing Shangyu through the "one city, one company" lens overstates local cluster density; only the "one company, many cities" lens can explain where Wolong's cost structure and export resilience actually come from.
Wenling's sample is the exact opposite. Wenling is the country's largest pump-manufacturing base, with water pump output accounting for over 40% of the national total, small water pump output over 70% of the national total, and an international market share of roughly 20%. In 2018, the pump and motor industrial cluster was included among Taizhou's RMB-100-billion-class industrial clusters, and in 2020 Wenling's equipment manufacturing sector (pumps and motors) was included in the list of National New Industrialization Industry Demonstration Bases. It should be noted that a set of total output value and above-scale output value figures once circulated for the Wenling pump and motor cluster, at a magnitude clearly inconsistent with Wenling's own economic size, with a questionable source and statistical scope; this report does not adopt it. What can be confirmed and used are the three share figures cited above.
What is truly worth studying about Wenling is the name itself — the local official term has never been the "pump industrial cluster," but the "pump and motor industrial cluster," the two words written together as an industrial fact, not a rhetorical flourish. In a small water pump's bill of materials, the motor is the single highest-value item; pump makers either produce their own motors in-house or complete procurement within a half-hour drive — the cost structure discussed in Chapter 5 is here compressed into a stretch of highway. A deeper layer of symbiosis occurs on the process side: the production organization of a household submersible pump and a small motor overlap heavily — both involve stamping, winding, press-fitting, final assembly, and burn-in testing — equipment can be shared, workers can be swapped between them, and the cost of retooling fixtures is minimal. The true boundary of an industrial belt is never drawn by a product catalog — it is drawn by process and equipment.
Placed side by side, the two cities offer Zhejiang a set of mirror images. Wenling had downstream pull upstream into being, giving demand a naturally stable footing, but the risk is that its motors stay locked into the low-price, low-voltage, low-power segment with no traction to break upward; Shangyu grew outward from a single company, reaching the farthest in technology and specification breadth, but the risk is that no local supply-chain depth has formed — should the leading firm's global footprint contract, there is no second layer of local buffer. Each path's ceiling is, in its own way, clearly defined.
7.4 The Guangdong Micro-Motor Belt: No Title, No Statistics
The Pearl River Delta is very likely the most densely concentrated location for micro-motor output in China, yet it is the only industrial belt in this chapter for which no independent statistical benchmark can be produced. A thorough search of public channels turns up no authoritative figure for the output value or volume of Guangdong's micro-motor industry: at the provincial level there is only the aggregate for small and medium enterprise specialty industrial clusters, and at the municipal level only broader figures covering categories such as home appliances and equipment manufacturing. This section therefore offers no estimate of cluster scale, using only the distribution of leading enterprises as corroborating evidence — candidly flagging a data gap serves the proper duty of research better than presenting a number of unclear provenance.
- Zhongshan: the headquarters of Zhongshan Broad-Ocean Motor Co., Ltd. (SZE: 002249, hereafter Broad-Ocean Motor). In 2025, Broad-Ocean Motor's building-and-household-appliance motor business generated revenue of RMB 6.902 billion, with sales volume of 78.64 million units. The appliance clusters of Zhongshan and Shunde are its earliest and most stable customer base, with a supply radius for air-conditioner fan motors, washing-machine motors, and refrigeration-cabinet motors short enough to be measured in hours.
- Dongguan: Mabuchi Motor's Dongguan base employs nearly ten thousand workers. Mabuchi first set up a plant in Guangdong in 1986 under a processing-with-supplied-materials arrangement, established Dalian Mabuchi in 1987 — the first 100%-owned subsidiary of a Japanese company on mainland China — established Dongguan Mabuchi in 1994, and added the Daojiao plant in 2010. The group produces over 1.4 billion micro motors a year, holding a global share of over 80% in automotive side-mirror motors and over 70% in door-lock motors (both company figures), and has produced entirely overseas since ending mass production in Japan in 1990.
- Shenzhen: Johnson Electric Holdings Ltd. was founded in Hong Kong in 1959 by Wang Songliang and his wife, produces roughly 4 million motors a day, and derives 84% of revenue from automotive products, with Shenzhen and Changzhou as its main mainland bases. Shenzhen Zhaowei Machinery & Electronics Co., Ltd. (SZE: 003021, hereafter Zhaowei Machinery), meanwhile, built its business on micro-drive systems and is a representative domestic name in micro-transmission technology.
The distinguishing feature of the Guangdong micro-motor belt is the deep embedding of foreign-invested leaders. It is not something that grew naturally out of local resource endowment, but the result of two external input lines converging at the mouth of the Pearl River: one is the northward migration of Hong Kong manufacturing, with Johnson Electric as the standard sample; the other is Japanese-invested processing-with-supplied-materials and wholly owned plants, with Mabuchi as the standard sample. What foreign investment brought was not just orders — more importantly, it brought mass-production process standards, tooling capability, and quality-management systems for micro motors, and the local supply chain was trained in reverse over the long process of supporting foreign-invested firms; the localization of magnet steel, commutators, oil-impregnated bearings, and injection-molded parts was accomplished precisely through this process.
The cost is that the shape of this industrial belt remains perpetually blurred. The Pearl River Delta carries no "capital" title, has no independent statistics, and does not even have a clear geographic center: Shenzhen, Dongguan, and Zhongshan each stick close to a different downstream sector — 3C and consumer electronics, automotive components, and home appliances — and the ties among the three points are, if anything, looser than each point's tie to its own downstream. A nameless industrial belt's true size tends to be systematically underestimated, and the direct consequence of that underestimation is its long-standing absence from both policy resources and statistical view.
7.5 Changzhou and Boshan: One Newest, One Oldest
Changzhou is the youngest point on this map. Positioning itself as the "Capital of New Energy," it has assembled the full chain of vehicle assembly, power batteries, motors, and charging infrastructure, with nearly 4,000 related manufacturing enterprises and an industrial density that ranks among the highest nationwide. Motors are one link in that chain, but as with Guangdong, no independent output-value statistic can be found, and this report does not fabricate a cluster scale for it. What can be confirmed is company-level evidence: Jiangsu Leili Motor Co., Ltd. (SZE: 300660, hereafter Jiangsu Leili) posted 2025 revenue of RMB 4.179 billion, up 18.77% year-on-year, of which appliance motors contributed RMB 2.303 billion and automotive motors RMB 940 million (up 53.5% year-on-year); Johnson Electric also has a base in Changzhou. Changzhou and Wenling are structurally isomorphic, only with the downstream swapped from pumps to vehicles and the timeframe swapped from the 1990s to the 2020s. This isomorphism means the same opportunities and the same risks: demand is underpinned by local vehicle-assembly and appliance customers, bargaining power likewise sits with those customers, and the e-drive price war explored in Chapter 8 will transmit all the way down the chain to Changzhou's motor makers.
Boshan is one of the oldest points on this map. Boshan District, Zibo, is currently home to 45 motor-manufacturing enterprises, with backbone firms including Shandong Shanbo Electric Motor Group, whose main products are DC micro motors and special-form AC motors applied across more than a dozen fields including automotive, defense, aerospace, textiles, and agricultural machinery; the locality has established both a pump-industry alliance and a motor-systems industry alliance, stringing R&D, manufacturing, sales, and after-sales into a cluster-style organizational form. Regarding Boshan's historical standing, local accounts record that the motors used in the first batch of domestically produced "Liberation" brand trucks, the first artificial earth satellite "Dongfanghong I," and China's first launch vehicle were all made in Boshan — this claim originates from local promotional material and media reprints, carries no specific year, and is not corroborated item by item by any authoritative historical source; this report presents it as-is per the local account and does not treat it as an established historical conclusion.
Forty-five factories versus Fu'an's nearly one thousand is a gap of two orders of magnitude, and Boshan's value clearly does not lie in scale, but in the fact that it demonstrates the lower-bound form of an industrial belt: a cohort of historic old factories, one industry alliance, and a handful of niche product variants sustaining their presence through special-form and specialty orders. For this kind of small, old cluster, the most critical variable is equipment renewal — local firm Kaiou Motor has invested a cumulative total of over RMB 25 million since 2022 to advance production-line automation and end-to-end data connectivity, a typical move by an old cluster responding to the energy-efficiency upgrade. The very same amount of investment is a cash-flow threshold within Fu'an's cluster of small and micro factories, yet merely a single quarter's technical-upgrade budget on the books of a leader like Wolong — the gap between industrial belts ultimately comes down to the capital-spending capacity of the individual factory.
7.6 The Old-Factory Lineage: Motor Memories Left by the National Team
Privately-owned industrial belts are only half of China's motor map; the other half is written into the roster of old factories from the planned-economy era.
Shanghai Electric Machinery Co., Ltd. began in the first year of the Xuantong reign of the Qing dynasty, that is, 1909, as a small ironworks under the Yangshupu Bridge with just 11 employees at founding. It was reorganized in 1945 into Shanghai Electrical Works No. 4 and began producing electric motors, though output was negligible — full-year output reached only 1,700 kW by 1949. On December 1, 1949, Shanghai Electrical Works No. 4 was expanded and reorganized into Shanghai Electric Machinery Co., Ltd. In 1953, the state assigned it the trial-manufacture task for a 6,000-kW air-cooled steam turbine generator, listing it as a First Five-Year Plan priority. Five years later, in October 1958, Shanghai Electric Machinery built the world's first 12,000-kW double-water-internally-cooled steam turbine generator. The project was led by deputy plant director and chief engineer Meng Qingyuan, a graduate of the electrical engineering department at Shanghai Jiao Tong University, who had interned in 1937 at the British-owned Yangshupu Power Plant, where he was humiliated by American experts — and it was precisely this machine that broke the pronouncement, made back then, that "the Chinese will never be able to build a steam turbine generator." Double-water internal cooling is a scheme in which both the stator and rotor windings are cooled directly by water, and at the time it was an original path worldwide — on this path, China was not following: it was the first to get there.
Xiangtan Electric Machinery Works has an even earlier lineage. In 1936, the Nationalist government's National Resources Commission established the Central Electrical Manufacturing Works, sited at Xiashesi in Xiangtan to avoid the war, one of ten major heavy-industry plants and mines under the era's plan to "develop heavy industry, consolidate national defense." It was renamed Xiangtan Electric Machinery Works in 1953 and became one of the 156 key construction projects of the First Five-Year Plan; in 1958 it built China's first AC mainline electric locomotive, used on the Baoji–Chengdu railway. A widely circulated claim needs correcting here: Xiangtan Electric Machinery Works is often described as a relocated Third Front Construction plant, but its founding predates the launch of the Third Front Construction program in 1964 by nearly thirty years — it belongs to the First Five-Year Plan-era national key electrical-engineering base, not a Third Front plant. Conflating the two would misread both XEMC's technical origins and how its capability accumulation in electric locomotives and marine electric propulsion actually came about.
The motor-industry thread that is genuinely tied to the Third Front lies with the Shanghai lineage. In February 1969, Shanghai Gexin Electric Motor Factory established Shanghai Xiaosanxian Wuzhou Electric Motor Factory in Guichi County, Anhui, becoming a supporting unit for the Type 59 anti-aircraft gun; during the same period, Shanghai Gexin Electric Motor Factory also provided paired assistance to Lanzhou Integrated Electric Motor Factory, a standard sample of the "coastal areas support the interior" model. A Shanghai motor factory was split in two — half stayed in place, half moved into the mountains of southern Anhui — and it was through moves like this, bit by bit, that China's motor-manufacturing capacity was scattered into the interior.
The old-factory lineage explains several seemingly anomalous points on today's motor map: Harbin, Xiangtan, Shanghai, and Xi'an all possess strong large-motor and special-motor capability, yet have no corresponding private-sector motor cluster around them; conversely, Fu'an, Wenling, and Zhongshan have hundreds or thousands of private motor makers, yet not one of them can build a steam turbine generator or a nuclear main pump motor. The two maps were drawn according to entirely different logics from the start — during the planned-economy era, siting followed national mission assignments, weighing strategic need and defense depth, with products that were high-power, high-voltage, single-unit or small-batch; after reform and opening, siting followed downstream clusters and township-enterprise endowments, weighing order radius and factor cost, with products that were small-to-medium power, standardized, and large-batch. Only by viewing the two maps separately can one explain a long-misread phenomenon: China is simultaneously capable of building world-class large motors and locked in an all-out price war on general-purpose small and medium motors. The geographic counterpart to the question analyzed in Chapter 6 — "why motors have never produced a consumer brand" — is hidden right here: the national team supplies technical lineage and talent spillover, the private-sector belts supply specification coverage and cost, and the two systems are each complete in their own right, yet almost never converge into an opportunity for a brand.
7.7 Seeing "Ubiquitous and High-Volume" Clearly: From a Thousand Enterprises to Tens of Thousands of Manufacturers
Having walked through this map, a very practical question surfaces: how many motor factories actually exist nationwide, and which cluster does each one supply?
The hardest official figure available is 3,802 above-scale enterprises in the motor industry. But Fu'an alone is home to nearly a thousand motor, electrical-equipment, and supporting enterprises, of which only 124 are above-scale — the above-scale threshold by its very nature misses the overwhelming majority of factories. Turning toward business registries, the number of firms related to "motors" runs into the tens of thousands, yet the registries are equally unreliable: deregistered firms, idle factories, pure trading companies, and shell names that exist only in business-registration data are all jumbled together on the same list. As a result, three of the most basic questions have long gone unanswered: who is actually still producing, who supplies which cluster, and who is merely a line entry in a registry.
A ubiquitous, high-volume industry is precisely the hardest to see clearly, for three reasons. First, the industry has no consumer brand, so an enterprise list cannot be reverse-engineered from brand recognition the way it can for consumer goods — Chapter 6 has already spelled out the reasons for this in full. Second, industrial belts generally lack independent statistics — the gaps left by the Guangdong and Changzhou sections of this chapter are the most direct evidence, where even cluster output value cannot be found, let alone an enterprise list. Third, enterprise forms are extremely fragmented, and below the above-scale threshold lies a whole statistical blind spot — and this fragmentation is itself the very same root cause behind "no authoritative concentration statistics for the industry" discussed in Chapter 4.
Tianxia Gongchang treats factory identification itself as a foundational undertaking — covering the entire manufacturing sector with an identification benchmark of roughly 4.8 million active, verified factories (this figure is the total identified count of active factories across all of manufacturing, not the enterprise count for the motor industry specifically), separating out from the registries the three distinct questions of whether a factory is genuinely producing, what product it mainly makes, and which cluster it belongs to. For an industry like motors — with no brand, no credible concentration statistics, and industrial belts whose output value often cannot even be found — seeing the factories clearly first is more meaningful than calculating a market size first: Chapter 4 has already shown that, under current data conditions, the latter simply cannot yield a credible answer, while the former can at least be verified factory by factory.
The six places this chapter has walked through each take a different form: Fu'an turned a single product — the motor — into the forty-year pillar of a small mountain town through exports; Shangyu, through two cross-border acquisitions, sent a township factory to the top of the world's explosion-proof e-drive rankings; Wenling grew pumps and motors into one body through the shared process logic of a single production line; the Pearl River Delta quietly became the largest micro-motor production base through the embedding of foreign investment, yet has never had a name of its own; Changzhou fitted the motor into the chain of the new energy vehicle; and Boshan holds on to more than forty old factories and a glory whose exact years cannot be pinned down. Their only shared trait is that none of them appears in the name of the final product. The electric motor industrial belt exists in exactly this way — forever beside someone else's cluster, forever the one supplying the heart.
Chapter 8: Sub-Market Deep Dive: From Commodity Products to the Most Expensive Joint
Lining up the motor industry in a queue by unit value from low to high, the front and back of the line barely resemble the same industry. At the back of the line are small and medium induction motors, priced anywhere from tens to thousands of yuan per unit, where the deciding factor is the energy-efficiency class and a stator-rotor structure that has not changed in decades; at the front of the line is the frameless torque motor inside a humanoid robot's joint, priced at tens of times a common industrial motor, where the deciding factor is precision and response speed, not power and price. This chapter takes this queue apart segment by segment, examining who uses each sub-market, how its competitive landscape looks, and at what order of magnitude its value sits.
8.1 Small and Medium Induction Motors: Standardized Commodity Product
Small and medium induction motors are the oldest and most massive base-load product in this industry, with downstream applications covering nearly the entire range of general industrial-drive scenarios — water pumps, fans, compressors, conveyor belts, and appliance-compressor pairings; wherever there is a constant-speed rotating load, chances are this is the category of motor installed. The sample tracked by CEEIA's Small and Medium-sized Motor Branch best illustrates its condition: in 2024, the 58 sample enterprises had total output of 272.101 million kW, down only a slight 0.3% year-on-year — volume was stable; but profit was RMB 4.37 billion, down 8.3% year-on-year, with a loss ratio reaching 13.8% — stable volume, thin profit, the most typical financial expression of a standardized commodity product. Export revenue was RMB 7.38 billion, up 5.6% year-on-year, one of the few bright spots that year.
What truly deserves attention is the energy-efficiency mix: output of Class 2 and above energy-efficiency products reached 78 million kW, up 40.3% year-on-year; Class 1 energy-efficiency products reached 22 million kW, up 112% year-on-year. In a year when total output grew almost not at all, the explosive growth in high-efficiency tiers shows that the only product logic still functioning in this sub-market is the energy-efficiency upgrade cycle — survival comes not from winning orders through differentiated design, but from staying in step with the mandatory GB18613 threshold.
Comparing this with the data a year later makes it clearer: in the first three quarters of 2025, the Small and Medium-sized Motor Branch's figures show output of 202.005 million kW (up 4.7%), sales revenue of RMB 56.00 billion (up 4.2%), and profit of RMB 3.36 billion (up 10.3%) — a clear warming trend; but over the same period, the motor industry's 3,802 above-scale enterprises as a whole posted revenue growth of 19.6% and profit growth of 22.8%, meaning small and medium motors' recovery pace visibly lagged the broader market. This gap confirms this sub-market's position within the motor industry as a whole — it is the ballast, not the growth engine; the standardized commodity product cannot keep pace with the expansion speed of new tracks such as new energy drives and servo motors.
The competitive landscape echoes this same judgment: the Small and Medium-sized Motor Branch currently has 213 member units, set against the overall pool of 3,802 above-scale motor enterprises; the small and medium induction motor sub-market is highly fragmented, with no authoritative concentration statistics available. Fragmentation combined with thin margins together determine that this sub-market's survival logic is not about crushing rivals through scale, but about inching the energy-efficiency compliance line forward, one small step at a time.
8.2 High-Voltage and Explosion-Proof Motors: A Qualification Business
High-voltage motors and explosion-proof motors sit at two ends of the same logical line: the former corresponds to high-power scenarios in petrochemicals, metallurgy, and electric power, the latter to mandatory safety requirements in flammable and explosive environments — and the shared threshold for both is not price, but qualification certification. Explosion-proof motors must pass mandatory national certification before entering sites such as oil and gas fields, chemical plants, and coal mines; the certification cycle is long and the cost of maintaining the qualification system is high, which naturally shuts small and medium manufacturers out of the door — this is a business that first wins its ticket to entry through qualification and then earns repeat business through accumulated brand trust, not one built on grabbing orders through low prices.
Jiadian Co., Ltd. (SZE: 000922, under Harbin Electric Group, based in Jiamusi) is the most typical sample on this track: with over 80 years of deep experience, a product range covering 347 series and nearly 4,000 variants, and annual capacity exceeding 18.6 million kW, it is the leading enterprise in explosion-proof motors and nuclear main pump motors. It posted 2025 revenue of RMB 4.92 billion and net profit of RMB 254 million, of which nuclear power product revenue was RMB 998 million, up 14.8% year-on-year — the nuclear power scenario that nuclear main pump motors serve carries an even higher certification bar than conventional explosion-proofing, the thickest layer of barrier within the qualification business.
Wolong Electric Group Co., Ltd. (SHA: 600580, Shangyu, Shaoxing, hereafter Wolong Electric) follows a scaled-up path along the same logic: in 2025 its explosion-proof motor business generated revenue of RMB 4.633 billion, industrial motors RMB 4.095 billion, and HVAC motors RMB 4.958 billion, with the three together accounting for 88.5% of company total revenue — a genuine base business. According to Frost & Sullivan, Wolong Electric ranks first globally in explosion-proof e-drives, fourth in industrial e-drives, and fifth in HVAC e-drives — this tiered ranking shows that explosion-proof is the battlefield where it can better hold onto pricing power than in general-purpose industrial motors. Public estimates put the size of China's explosion-proof motor market at roughly RMB 12.4 billion (a figure to be treated with caution); the scale is not especially large, but the fact that leaders Jiadian and Wolong can both sustain double-digit net margins within a mid-sized market of this kind is a direct expression of the qualification barrier. The high-voltage motor space presents a different picture: GB30254-2024 has been in effect since October 2025, and together with GB30253-2024 (the energy-efficiency standard for permanent magnet synchronous motors), implemented in the same batch, forms the foundation for the coming IE5 standard era. After the standard upgrade, domestic and foreign manufacturers compete on the same footing, with no authoritative share statistics currently available and a landscape of mixed domestic-foreign competition.
8.3 Servo and Stepper: A Localization Milestone for the Motor Itself
Servo motors and stepper motors are both core actuating components in motion-control scenarios; the difference lies in the positioning method — servo relies on closed-loop feedback, stepper on open-loop pulse counting — the former is expensive, the latter cheap, covering two respective markets: high-end CNC machine tools and industrial robot joints, versus low-to-mid-end automation equipment. This section discusses only the motor itself, leaving controllers and drive algorithms to be covered in the industrial automation field.
The localization process for the servo motor itself has a widely recognized milestone: according to MIR Databank (睿工业), the domestic share of general-purpose servo systems reached 49.79% in 2022, close to half — currently the most reliable figure available. Another figure from GGII shows the localization rate for the servo motor unit itself exceeded 32% in 2023. The two figures cover different scopes (system versus unit) and should not be directly added together or substituted for one another, but both point to the same trend: domestic servo is moving from following to running alongside. In terms of share, Inovance Technology is the widely recognized domestic leader, while Japanese makers (Yaskawa, Mitsubishi Electric, FANUC) and German makers (Siemens) still hold the installed-base share at the high end. MIR's forecast for the servo system market puts it at roughly RMB 30 billion in 2022, breaking through RMB 40 billion by 2026, with the motor itself the most core link in that system-level pool and also the one where localization is advancing fastest.
Stepper motors follow a different, more budget-oriented path: the domestic stepper system market is worth roughly RMB 850 million a year, a much smaller scale than servo, with Leadshine Technology the domestic leader in this sub-market. The comparison between stepper and servo motors is, in essence, a comparison of precision tiers — servo serves high-value scenarios such as machine tools and robots, while stepper serves more cost-sensitive scenarios such as printers, textile machinery, and small automation equipment; the two do not compete directly, forming instead a high-low pairing along the same motion-control value chain.
8.4 The BLDC Brushless Wave: The Dual Push of Copper Prices and Energy Efficiency
Brushless DC motors (BLDC) are accelerating their replacement of traditional brushed motors and some induction motors across four major scenarios: home appliances, power tools, automotive, and industrial control. According to Xinhua, in the first quarter of 2026, the share of brushless motors across these four application areas had already broken through 65% — a clear technology-substitution curve, not a localized phenomenon (because statistical definitions of the global BLDC market vary too widely, this chapter does not cite a single aggregate figure).
Behind the brushless wave is a combination of two forces, not a single driver. The first is energy-efficiency logic: BLDC motors have no brush-friction losses, giving them inherently higher efficiency than brushed DC motors, which aligns with the policy direction of the mandatory GB18613 upgrade. The second is cost logic, and it is passively triggered — for every US$1,000-per-tonne rise in copper prices, new energy drive-motor cost rises by 2% to 3%; in 2026, international copper prices have already risen for seven consecutive months, briefly breaking through US$14,500 per tonne, with domestic futures simultaneously breaking through RMB 106,000 per tonne, forcing standard motor makers to raise quoted prices by 10% to 20%. Facing rising copper prices, the industry's response follows three paths: adding copper-price pass-through clauses to contracts to shift risk downstream, substituting aluminum for some copper material to save on copper consumption, and accelerating brushless conversion — BLDC motors generally use less copper than brushed or induction alternatives at the same power output. Two originally unrelated pressure lines — energy-efficiency policy and raw-material cost — converge on this single technology choice of going brushless, which is precisely why this wave is moving faster than any previous motor technology upgrade. Power tools are the most typical downstream sector for this trend: China's power tool output accounts for over 60% of the global total, with exports of US$9.758 billion in 2024, up 21% year-on-year — the stronger exports run, the greater the significance of BLDC penetration for cost control.
8.5 Micro-Special Motors: A Volume Superpower, a Value Minnow
Micro and special motors are the smallest and most dispersed-in-application branch of the motor family, encompassing mobile-phone vibration motors, automotive wiper and door-lock motors, home-appliance micro motors, and toy motors — each individual product carries extremely low value, and the business depends on massive shipment volume. According to CEEIA's Micro Motor Branch, China's micro-and-special-motor industry had total output value of roughly RMB 290 billion in 2025 and output of roughly 16 billion units (against demand of roughly 14 billion units), with a forecast of 18 billion units and RMB 295 billion in output value for 2026 — this single year's output already exceeds total global demand for micro and special motors in 2023 (roughly 14.2 billion units, valued at roughly RMB 284.22 billion). By output volume alone, China is the undisputed world factory for this sub-market.
But the value share tells a different story. By sales value, in the 2023 global micro-and-special-motor market, Japanese firms held a 40.8% share against 33.3% for mainland Chinese firms (per the China Electronic Components Industry Association's information center) — mainland China still trailing Japan by 7.5 percentage points. Output atop the world, share behind — placed together, these two figures sketch the most precise portrait of this sub-market: a volume superpower, a value minnow. Chinese factories build more micro and special motors than anywhere else in the world, yet for the same motor, Japanese firms can sell it at a higher unit price. Mabuchi Motor alone produces over 1.4 billion units a year, holding a global share of over 80% in automotive side-mirror motors and over 70% in door-lock motors (company figures) — confirming precisely Japanese firms' pricing power in high-value-added niche scenarios. For China's micro-and-special-motor industry to move from a volume superpower to a value power, what is lacking is not capacity but pricing power that can stand at the high end of application scenarios. The voice coil motor (VCM) used in mobile-phone camera modules is another footnote to this value stratification: this niche currently shows a Japan-Korea bipolar landscape, with Chinese manufacturers still playing catch-up.
8.6 High-Speed Rail Traction Motors: A Narrow Track Dominated by the National Team
High-speed rail traction motors serve a highly concentrated procurement system that is not market-priced through open bidding — the buyer is, in effect, China State Railway Group alone, and supply is likewise highly concentrated within the CRRC system. CRRC Zhuzhou Electric Co., Ltd., a wholly owned subsidiary of CRRC Corporation Limited, is the sole domestic company that masters both traction motors and traction transformers among the nine core technologies of high-speed rail, and it released the TQ-800 permanent magnet traction motor for 400 km/h operation in 2019, marking the mass-production landing of permanent magnet synchronous traction technology on China's high-speed rail. Compared with traditional induction traction motors, permanent magnet traction motors deliver energy savings of up to 30% (per Xinhua) — a sizeable share of the energy-cost total across a high-speed train's full life cycle.
The landscape of this sub-market must be described with caution: the traction-motor market-share figures circulating in the market contradict one another and none has a reliable source, so this chapter cites no specific share figure. What can be confirmed is a qualitative judgment: high-speed rail traction motors are dominated by the CRRC system, a narrow track highly concentrated within the national team, with procurement volume tracking China State Railway Group's rolling-stock procurement plan; there is no independent third-party market data, nor does the competitive narrative of "whose share is higher," applicable to other sub-markets, apply here — its value logic is high per-unit value constrained by capacity-planning totals, not winning through volume.
8.7 New Energy Drive Motors: The Largest-Scale, Hardest-to-Profit Sub-Market
New energy drive motors are the fastest-growing sub-market in this chapter, the one with the most participants, and also the hardest in which to turn a profit. In 2024, China's new energy passenger-vehicle e-drive installations reached 7.758 million units, up 41.72% year-on-year — this growth rate combined with absolute scale makes it, for now, the single largest emerging sub-market within the entire motor industry.
The supply landscape shows two parallel tracks — captive supply and third-party supply. FinDreams Powertrain (BYD's in-house e-drive business brand) leads with a share of roughly 31.7% (January–November 2024), relying on BYD's closed loop of captive supply across the whole vehicle — building its own cars, fitting its own e-drives, and not depending on the qualification cycle of external customers — a path that translates directly into a scale advantage in installation share. Inovance United Automotive Electronic Systems (联合动力) is the top-ranked third-party supplier: it held roughly 11% share of the motor-control segment in the first half of 2024, posted revenue of RMB 10.4 billion in the first three quarters of 2024 (up 96% year-on-year), and has launched an IPO with a planned fundraising of RMB 4.86 billion — an independent listed company emerging from the third-party camp, a marker of how market-driven this sub-market has become.
But largest-scale and hardest-to-profit are two sides of the same coin, and the financial history of third-party e-drive suppliers is almost a history of losses. Jing-Jin Electric Technologies Co., Ltd. (SHA: 688280, hereafter Jing-Jin Electric) once saw its gross margin fall as low as -3.84% in the first half of 2022, posted a full-year net loss of RMB 436 million in 2024, and only achieved its first full-year profit since listing in 2025, with revenue of RMB 2.729 billion (up 109.11% year-on-year) and net profit of RMB 150 million. Zhejiang Founder Motor Co., Ltd. (SZE: 002196, Lishui, hereafter Founder Motor) followed a different curve: by the end of 2023 its cumulative shipment volume had reached nearly 2.6 million units, still without turning a profit, and it only moved into the black in 2025, with revenue of RMB 2.915 billion (up 17.82% year-on-year) and net profit of RMB 21.01 million — its cumulative drive-motor shipments broke through 4 million units in 2025, across nearly 50 supported vehicle models. An even more extreme sample is Nidec Corporation: this Japanese giant, which holds roughly 80% of the global hard-disk spindle-motor market, entered the e-Axle (electric drive system) track with great fanfare as a mass-production pioneer in 2019, only to retreat step by step under the impact of China's price war — first booking roughly JPY 59.8 billion in restructuring charges in Q3 of fiscal year 2024, then losing a further JPY 87.7 billion over the following half-year, before its CEO ultimately announced in May 2026 that the company would dissolve its China-Europe e-Axle joint venture and exit the business. From Jing-Jin Electric's turn from loss to profit, to Founder Motor's failure to profit even after 2.6 million units shipped, to Nidec's quiet exit — the three samples together form a complete chain of evidence: unprofitability in e-drives is not an isolated case, but the common condition for third-party suppliers within this high-growth sub-market — the price war has ceded almost all the growth in installation volume to vehicle makers and leading captive suppliers, leaving third parties to either outlast the losses through scale until reaching break-even, or be forced out.
On the technology-path front, hairpin windings, oil cooling, and 800V high-voltage platforms are the currently recognized directions of iteration: 800V penetration was roughly 13% in 2025 (a figure to be treated with caution), while multi-in-one integration (combining motor, motor controller, and reducer into a single unit) is another battlefield for compressing cost and fighting over installation share.
8.8 Humanoid Robot Motors: The Most Expensive Joint, Currently a Business Worth Hundreds of Millions
The joint actuator of a humanoid robot is the highest-unit-value application scenario in the motor industry, with its core component being the frameless torque motor — one that dispenses with a housing and integrates directly into the joint structure, chasing the utmost in power density and response speed, priced at tens of times a common industrial motor. But in terms of market size, this most expensive joint is currently still a very small business: China's frameless torque motor market was worth RMB 180 million in 2023 and RMB 209 million in 2024, figures corroborated by two independent sources. Set within the coordinate system of the motor industry as a whole, this is a sub-market that has only just begun, not yet having formed economies of scale.
In terms of demand structure, collaborative robots remain the primary downstream application for frameless torque motors, accounting for roughly 70% of demand, with each collaborative robot using 5 to 7 actuators; the mass introduction of complete humanoid robots is only just beginning, with the number of joint actuators per unit ranging from just over twenty up to just over thirty, part of whose frameless torque motors are supplied by makers such as Wolong Electric. The continued rise in actuator count should, in theory, pull up the unit value on the motor side, but this transmission chain remains at the theoretical stage for now, and the actual market-size figure remains on the order of a few hundred million RMB.
Signs that actual performance is progressing more slowly than expectations have already shown up in financial reports. Shenzhen Zhaowei Machinery & Electronics Co., Ltd. (SZE: 003021, hereafter Zhaowei Machinery), which is focused primarily on the dexterous-hand direction, reported dexterous-hand business revenue of just RMB 15.53 million in the first three quarters of 2025, accounting for 1.2% of total company revenue — still a long way from becoming a pillar of performance. This figure stands in stark contrast to capital markets' valuation narrative around humanoid robot motors: the joint is indeed the highest-value-density position in this industry, but "most expensive" and "largest" are two different things — at present only the former has been realized, and the latter has not yet arrived. Further discussion of technical details and forecast methodologies is left to Chapter 9.
Sub-market comparison overview:
| Sub-market | Who Uses It | Competitive Landscape | Order of Value |
|---|---|---|---|
| Small/medium induction motors | Pumps, fans, compressors, and general industrial drives | Highly fragmented; represented by 58 sample enterprises | RMB 100-billion class; stable volume, thin profit |
| High-voltage and explosion-proof motors | Petrochemicals, coal mines, power, nuclear power, and other mandatory-safety scenarios | Dominated by qualification barriers; concentrated among leaders Jiadian and Wolong | Explosion-proof segment ~RMB 12.4 billion (caveated figure) |
| Servo and stepper | CNC machine tools, industrial robot joints, automation equipment | Inovance is the domestic leader; Japanese and German makers still hold high-end installed base | Servo system: RMB tens-of-billions class |
| BLDC brushless conversion | Home appliances, power tools, automotive, industrial control | Technology substitution underway; share already past 65% | Substitution curve; no aggregate figure cited |
| Micro-special motors | Mobile phones, automotive, appliances, toys, and other high-volume scenarios | China leads in unit volume; Japan leads in value share | China: ~RMB 290 billion, 16 billion units |
| High-speed rail traction motors | High-speed rail and urban rail traction systems | Dominated by the CRRC system; a narrow national-team track | No independent market data; high value per vehicle |
| New energy drive motors | New energy passenger vehicles | FinDreams leads captive supply; Inovance United leads third-party | 7.758 million units installed; largest scale |
| Humanoid robot motors | Collaborative robots, humanoid robot joints | Scaled competitive landscape not yet formed | China: ~RMB 200 million class; early stage |
Laid out side by side, these eight sub-markets span three orders of magnitude in value — from the RMB-100-billion-class standardized commodity product to the hundred-million-RMB-class most expensive joint. This span is itself a microcosm of the motor industry: the closer to the ubiquitous, high-volume end, the fuller the competition and the thinner the profit; the closer to the precision-density end, the fewer the participants and the more compelling the story — but the hard cash has not yet caught up with the scale.
Chapter 9: Technology Evolution: The Efficiency Ladder and the Priciest Stage
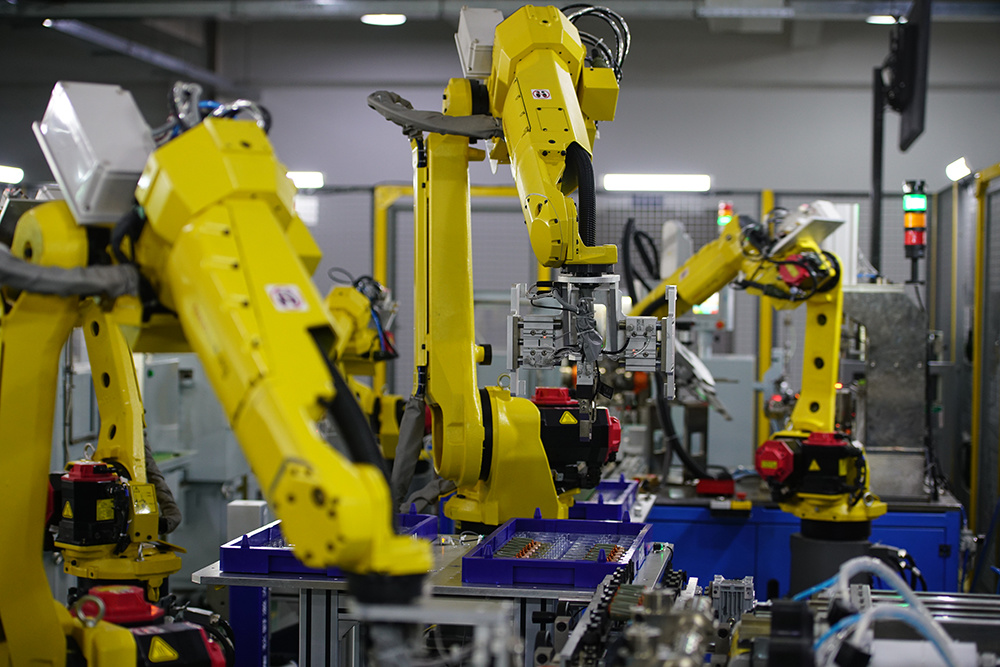
9.1 Two Hundred Years in One Timeline: From Oersted to IE5
The evolution of motor technology spans more than two centuries, from a chance discovery in a laboratory to the efficiency thresholds written today into mandatory national standards. Mapping out this timeline makes one throughline clear: the first hundred years solved the question of whether a motor could turn at all; the following half-century solved the question of whether it could turn without wasting electricity; and in just the last decade, the question has become whether a motor can be fitted into a joint no larger than a fist.
- In 1820, Danish physicist Hans Christian Oersted discovered that electric current produces a magnetic effect, linking electricity and magnetism for the first time — the starting point of motor theory.
- In 1821, British physicist Michael Faraday completed his electromagnetic rotation experiment, achieving the first conversion of electrical energy into mechanical energy.
- In 1834, German engineer Moritz Hermann von Jacobi built the world's first practical rotating electric motor, with a complete structure of a permanent-magnet stator, a wound rotor, and a commutator; four years later it propelled a small boat carrying fourteen people across the Neva River — the first time a motor actually did useful work.
- In 1866, Germany's Werner von Siemens proposed the principle of the self-excited generator, freeing motors from their earlier dependence on permanent magnets for field excitation and laying the technical groundwork for high-power motors.
- In 1888, Nikola Tesla's patent for the AC induction motor was sold to Westinghouse. Before this, DC motors had long dominated; the arrival of the AC induction motor solved the problems of long-distance drive and large-scale production, and AC motors set out on the road to industrialization from then on.
- In 1889, Russian engineer Mikhail Dolivo-Dobrovolsky invented the squirrel-cage three-phase induction motor. Simple in structure, it remained the dominant motor type by production volume for nearly a century and a half thereafter.
- In 1983, research teams at Sumitomo Special Metals of Japan and General Motors of the United States independently published findings on neodymium-iron-boron (NdFeB) permanent magnet materials in the same year, launching the practical application of rare-earth permanent magnet materials.
- In 1995, General Motors sold its NdFeB technology platform Magnequench to an investor group with Chinese capital backing — a pivotal moment in the shift of the rare-earth permanent magnet supply chain's center of gravity toward China.
- In the 1990s, variable-frequency drive (VFD) technology achieved large-scale adoption in China; for the first time, motors could run at the speed actually required rather than only at full speed or standstill, truly unlocking their energy-saving potential.
- In June 2021, China's national standard GB 18613-2020 formally took effect, making IE3 the mandatory floor for motors leaving the factory — anything below it could not be produced or sold.
- In October 2025, GB 30253-2024 (Minimum Allowable Values of Energy Efficiency and Energy Efficiency Grades for Permanent Magnet Synchronous Motors) and GB 30254-2024 (Energy Efficiency Standard for High-Voltage Motors) took effect simultaneously, moving China's motor industry as a whole into the IE5 standard era.
This timeline contains one turning point worth pausing on: from the squirrel-cage motor's structural maturity in 1889 to the arrival of NdFeB in 1983, nearly a century passed with no revolutionary breakthrough in the motor's basic structure; yet from NdFeB's arrival to today's mandatory IE5 standard took only a little over four decades. The pace of technology diffusion has clearly accelerated — a conclusion borne out more directly by the efficiency data in the next section.
9.2 The Efficiency Ladder: Copper-Cast Rotors, Permanent-Magnetization, and Synchronous Reluctance
From IE1 to IE5, the International Electrotechnical Commission defines the four efficiency classes IE1 through IE4 in IEC 60034-30-1, while IE5 for variable-frequency-drive applications is defined separately in IEC 60034-30-2 — efficiency classes themselves are split into two evaluation systems, one for direct line-frequency operation and one for variable-frequency drive, and this is the first premise for understanding the efficiency ladder.
In engineering terms, pushing a motor from a lower efficiency class to a higher one generally follows three technical paths. The first is optimizing the induction motor itself: replacing the rotor's cast-aluminum conductor bars with cast copper. Copper's electrical conductivity is markedly better than aluminum's, effectively reducing rotor losses; this is the path with the lowest conversion threshold, commonly used to move from lower classes up to IE3. The second is replacing induction motors with permanent-magnet motors: a permanent magnet synchronous motor replaces the induction motor, and because the rotor no longer needs an induced current to generate its magnetic field, slip losses are eliminated — currently the most mainstream path for moving from IE3 to IE4 and IE5. The third is the synchronous reluctance motor: the rotor uses neither permanent magnets nor induction windings, generating torque purely from reluctance differentials, which saves on rare-earth material costs while still reaching high efficiency classes; ABB is the technology pioneer on this path, launching an integrated IE4 product in 2011 and an IE5 product in 2019. The "IE6" designation sometimes heard in the industry remains, for now, a vendor-defined marketing term that has not entered the official standards system — a distinction worth noting whenever the term comes up.
Product-mix data from the industry association corroborates this upward march along the ladder. In 2024, among the 58 sample enterprises under the Small and Medium-sized Motor Branch of the China Electrical Equipment Industry Association (CEEIA), total output volume fell 0.3% year-on-year, yet output of Class-2-and-above efficiency products reached 78 million kW, up 40.3% year-on-year, and output of Class-1 efficiency products reached 22 million kW, up 112% year-on-year. The overall pie was essentially flat or even shrinking, yet the product mix was shifting rapidly toward higher efficiency classes at a growth rate far outpacing overall volume growth — a fact that speaks more to the pace of structural transition than the aggregate figures themselves.
Of the three paths, the energy-saving logic of permanent-magnetization is the most frequently cited, but the citation needs qualification: after a permanent magnet synchronous motor replaces an induction motor, the active power savings rate is estimated within the industry at 23% to 25% — this figure rests on relatively thin sourcing and should be treated only as a directional reference, not used as a precise engineering metric. The more solid evidence comes from the output-mix data itself — from 2021 to 2023, China's output of high-efficiency energy-saving motors (meeting Class 2 or above) as a share of annual motor output jumped from 39% to 73% in just three years; over the same period, the in-service share of high-efficiency energy-saving motors also rose from 7.3% in 2020 to 20.2% in 2023, a gain of 12.9 percentage points in three years. The pace of model turnover in new output is far faster than the climb in the in-service share — newly manufactured motors are quickly upgraded to higher efficiency classes, but the existing stock already installed on equipment is bound by its own service life and updates much more slowly. The near-doubling of the output share within three years is empirical proof of the pace of technology diffusion: once a mandatory standard takes effect, the supply chain's response speed is faster than most people expect.
9.3 The Electric-Drive Technology Stack: Hairpin Windings, Oil Cooling, 800V, and Multi-in-One Integration
New energy vehicle drive motors have shifted motor manufacturing away from the logic of bigger and sturdier toward the logic of denser and stronger, giving rise to an entirely new stack of manufacturing processes.
Hairpin motors are the starting point of this stack. Traditional round-wire windings are constrained by the round cross-section of the wire itself, which inevitably leaves gaps between windings; hairpin windings are inserted into the stator slots like hairpins, and the slot fill factor — the proportion of the available slot space occupied by the conductor's cross-sectional area — can reach about 70%, markedly higher than round-wire windings, at the cost of a significantly higher production-line investment, roughly 2 to 5 times that of a round-wire line. According to a single source, the penetration rate of hairpin motors in China rose from 15% in 2020 to about 70% in 2024; the directional trend is credible, but since this figure is supported by only a single source, the precise number should be cited with caution. Despite the significantly higher line investment required compared with round-wire processes, penetration still climbed to roughly seventy percent within four years, driven by strong pull from new energy vehicle demand — automakers highly sensitive to range and cost are willing to pay for higher power density, which in turn forces motor makers to amortize the fixed investment in hairpin production lines.
Oil cooling is the natural extension after hairpin windings. Once the slot fill factor is pushed higher, heat generation in the stator becomes more concentrated, and cooling by air or water alone at the housing exterior is no longer sufficient; cooling oil must directly contact the winding end-turns or flow through oil passages inside the rotor to further squeeze out additional power density.
The 800V high-voltage platform is the stack's voltage-side layer. At the same power level, raising voltage from the common 400V class to 800V lowers current accordingly, which in turn allows the conductor cross-section and wiring-harness weight to shrink while also shortening fast-charging time; according to an incomplete statistical estimate, penetration of vehicles rated above 800V reached about 13% in 2025 — the sourcing behind this figure is not entirely clear and it should be taken only as a directional reference.
Multi-in-one integration is the stack's endpoint on the systems-integration side — combining the motor, reducer, motor controller, and even the onboard charger and DC-DC converter into a single housing, reducing the number of components and connecting harnesses. This is a widely recognized direction for the industry, though no authoritative figure for integration penetration is currently available to cite.
A clear path dependency runs through these four layers of the stack: once the slot fill factor rises, power density rises with it, and so does heat density, which in turn forces an upgrade in cooling method; once the voltage platform is raised, the weight-reduction benefit from lower current can only truly be realized after both the motor itself and the motor controller have completed high-voltage conversion. Falling behind at any single layer drags down the returns of the whole system — which is also why upgrades to electric-drive motor technology are becoming increasingly difficult to discuss as isolated, single-point improvements.
Stacked together, the four layers point in one clear direction: the electric-drive motor is evolving from a standalone motor into a highly integrated system module, and the significance of single-point technical breakthroughs is increasingly giving way to system-level integration capability.
9.4 Humanoid Robot Motors: The Priciest Stage, the Thinnest Reality
If the previous two sections were about how motors are becoming more energy-efficient, this section is about how they are becoming more expensive — humanoid robots offer the motor industry an unprecedented high-price stage, but the brightness of the stage lights and the number of seats in the audience remain badly mismatched for now.
Humanoid robots impose two entirely new categories of technical requirements on motors. The joints require frameless torque motors: without an external housing, the stator and rotor are embedded directly into the joint structure itself, eliminating the weight and space occupied by a conventional motor housing, while requiring the highest possible torque density within a limited volume to support the limb's load-bearing and dynamic motion needs. The finger joints of dexterous hands, meanwhile, require coreless motors: the rotor has no iron core, and the winding itself is wound into a hollow cup shape, giving extremely low rotational inertia, fast dynamic response, and low heat generation — suited to the miniaturization and high-precision drive requirements at the finger scale. The design logic behind these two motor types differs entirely from the energy-saving focus of the previous two sections; the core demand here is extreme power density and response speed.
Even the per-unit usage figures are shifting quickly. Tesla's Optimus V2 used 28 joint actuators, with an additional 17 actuators in a single dexterous hand; by V3, the total joint count across the body had risen to 37. Unitree Robotics' humanoid robot is equipped with 31 high-precision joints. GGII's projection, based on its own scenario assumptions, puts average motor usage at about 40 motors per humanoid robot — a predictive figure derived from an assumed scenario, not an already-realized measured statistic. Moving from 28 actuators to 37 joints, manufacturers are trading additional degrees of freedom for a range of motion closer to that of a human; the engineering progress along this direction is real and verifiable. But the distance between a number of joints that can run in a lab and a product that can be delivered at scale on a production line — no single manufacturer has yet fully closed that gap.
The gap between forecasts and actual results is the fact most worth recording in this section. GGII's humanoid robot industry white paper has issued market-size forecasts in multiple versions, which differ from and are not mutually convertible across statistical scope (global versus China), currency unit, and base year — taking just one specific anchor point from among them, that forecast puts the 2030 global market size at over RMB 640 billion. The relatively confirmable reality is this: actual global humanoid robot shipments in 2024 were about 12,000 units; Tesla's Optimus had a target of 5,000 units for 2025, but actual full-year output was only in the hundreds — far short of target. Third-party research firm Omdia offers a comparatively conservative view, forecasting global shipments of 38,000 units by 2030, notably restrained compared with the more optimistic outlooks from sources such as GGII.
Figures further upstream in the industry chain make the real scale of the business even clearer. China's frameless torque motor market was worth RMB 180 million in 2023 and RMB 209 million in 2024 — a figure corroborated by two independent sources and thus relatively reliable. In other words, beneath market-size forecasts routinely running into the hundreds of billions, the entire Chinese frameless torque motor business is, for now, only just over RMB 200 million a year. Collaborative robots rather than humanoid robots remain the largest current application for frameless torque motors, accounting for about seventy percent of demand, with a single collaborative robot typically equipped with 5 to 7 frameless motors — a structure that points to a fact easily overlooked in market narratives: the real orders for frameless torque motors today mostly come from collaborative robot production lines that have already been commercialized for years, not from humanoid robots still at the prototype and small-batch trial stage; the latter's revenue contribution, in the financial statements of leading manufacturers, is typically only a line item in the low single-digit percentage range, far from becoming an independent pillar of performance. Listed companies' results tell the same story of a gap: for coreless motor maker Shanghai Moons' Electric Co., Ltd. (SHA: 603728, "Moons' Electric"), institutions once forecast net profit growth of 79% year-on-year to RMB 139 million, but the actual result was net profit of RMB 61.13 million, down 21.54% year-on-year; for dexterous-hand maker Shenzhen Zhaowei Machinery & Electronics Co., Ltd. (SZE: 003021, "Zhaowei Machinery"), dexterous-hand business revenue in the first three quarters of 2025 was only RMB 15.53 million, just 1.2% of the company's total revenue — scaling up is nowhere near arriving.
The temperature gap itself is the conclusion: humanoid robot motors are a stage being repeatedly amplified by market narrative, but the real business happening on that stage, at this stage, still runs in the hundreds of millions of RMB, not the hundreds of billions. The technical direction is sound — the choice of frameless torque and coreless routes is clear, and leading manufacturers' joint and actuator counts keep steadily rising — but the pace at which industrial scale is being realized is markedly slower than the pace at which forecasts are being published.
9.5 The Rare-Earth Route Debate: Tesla's Zero-Rare-Earth Pledge and GM's About-Face
At its first Investor Day in 2023, Tesla announced that its next-generation drive motor would use no rare-earth materials at all. At the time, its models in production used about 520 grams of rare earths per motor, with the goal of bringing that number to zero. The motivation is not hard to understand: rare-earth permanent magnets account for roughly half the raw-material cost of a permanent magnet synchronous motor, so eliminating rare earths is first and foremost a cost question.
But the technical feasibility of this proposition is not accepted within the industry. The reason permanent magnet synchronous motors achieve high efficiency and compact size is precisely their reliance on the high magnetic energy product that rare-earth permanent magnets provide; the motor routes that genuinely do not depend on rare earths are induction motors and synchronous reluctance motors, but these two types typically fall short of permanent magnet synchronous motors in power density and efficiency. Tesla has yet to disclose a specific alternative-material plan, which is also the main source of industry skepticism.
More direct counter-evidence comes from General Motors — which has returned to the rare-earth magnet market, resuming procurement while also participating in joint plant construction. On one side, Tesla is declaring a goal of zero rare earths; on the other, General Motors is re-embracing rare-earth magnets — two leading automakers making opposite choices at the same moment. Viewed against a longer historical thread, this route debate carries real weight: since Sumitomo and General Motors jointly published NdFeB technology in the same year, 1983, and GM's 1995 sale of Magnequench completed the shift of the rare-earth industry chain's center of gravity, the rare-earth permanent magnet supply chain has become deeply anchored to specific geographies. If de-rare-earthing were genuinely achieved, what would be shaken is not just one motor's bill of materials but the structure of an industry chain that has run for more than three decades. GM's move looks more like pragmatic risk management: rather than betting an entire powertrain on a substitute route whose technical details remain undisclosed and unproven at mass-production scale, it makes more sense to keep making good use of rare-earth permanent magnet technology that is already mature and whose supply chain has already run stably for decades. This does not mean the direction of de-rare-earthing is itself flawed — only that in a field as dependent on engineering validation as motors, a pledge made at a press conference still has a considerable distance to travel before it reaches genuine mass production. This route debate has no answer for now, only two bets placed in opposite directions.
9.6 Convergence: Two Steering Wheels
Taken together, the three threads of this chapter show that the evolution of motor technology is really being driven by two steering wheels turning at the same time.
One steering wheel is held by regulation. From the mandatory IE3 floor to the IE5 standard era, from cast-copper rotors to permanent-magnetization and synchronous reluctance, the primary force driving motor technology upgrades has consistently been the mandatory tightening of efficiency thresholds — every notch the regulation turns forces the industry chain to switch technical paths in response; the jump in high-efficiency energy-saving motor output share from 39% to 73% in three years is the most direct proof that this mechanism works.
The other steering wheel is held by application scenarios. The electric drive systems of electric vehicles and the joints of humanoid robots have pulled motors out of the efficiency race and into a power-density race — hairpin windings, oil cooling, and the 800V platform stack layer upon layer, all to pack greater power into the same volume; frameless torque motors and coreless motors are being pushed into joints and fingertips, all to squeeze sufficient torque and response speed out of a fist-sized space. This steering wheel is turning more urgently, and the stage lights are brighter, but as the previous section showed, the real industrial scale of humanoid robot motors at this stage has fallen well behind the pace of the narrative.
A hundred and fifty years ago, the motor solved the question of whether it could turn at all. Today, that same combination of rotor and stator is, on one hand, being forced by regulation to account for every kilowatt-hour, and on the other, being asked by the most cutting-edge applications to deliver industrial-grade force between a fingertip's width — the most rudimentary and the most cutting-edge of transformations, sharing the same physical principle, yet running along two completely different technical paths.
Chapter 10: Risks and Challenges
The pressures the motor industry faces today rarely arrive as a single point of impact; more often they amplify step by step along one transmission chain after another: raw material price swings pass through to the cost sheet, divergent overseas regulations pass through to export quotes, price wars at the vehicle-maker level pass through to component purchase orders, and the length of downstream payment terms passes through to the cash-flow statement. This chapter breaks down the transmission paths of seven categories of risk in turn; the focus is not on cataloguing phenomena but on explaining how external pressure walks, step by step, into motor companies' income statements and cash accounts.
10.1 Double Squeeze from Commodities: Cost Transmission from Copper and Rare Earths
Motor manufacturing is far more sensitive to raw material prices than most machinery manufacturing subsectors. According to research report figures, raw materials account for 60% to 75% of total cost for special motors (Wolong Electric disclosed a figure of about 68.3%), of which copper wire accounts for roughly 30% to 40% of raw material cost, and copper, aluminum, and steel together account for about 60%. This means nearly every fluctuation in commodity prices shows up in motor companies' gross margins with almost no buffer.
Since the start of 2026, international copper prices have risen for seven consecutive months, breaking through $14,500 per tonne, with domestic futures prices simultaneously breaking through RMB 106,000 per tonne; by one estimate, every $1,000-per-tonne rise in copper price raises new energy drive motor costs by 2% to 3%. Standard motor makers have broadly raised quoted prices by 10% to 20%, and the industry shows a divergence between "upstream benefiting, midstream under pressure" — raw material trading and smelting segments capture the windfall from rising prices, while motor manufacturers in the midstream, with limited bargaining power, are squeezed from both ends: unable to fully pass costs upward, and constrained downstream by commoditized competition that prevents them from raising prices in step.
Rare-earth magnetic materials have come under similar pressure over the same period. By industry estimates, rare earths account for about half the raw material cost of permanent magnet motors, while the rare-earth price index rose more than 30% in early 2026 compared with the end of 2025, and the price of terbium oxide reached RMB 6.4 million per tonne, an 11-year high. For manufacturers whose main product line is permanent magnet synchronous motors, this is a second squeeze running parallel to the copper price, and the two cost curves overlapping within the same time window has raised the difficulty of short-term cost management.
The transmission of cost pressure into squeezed margins has already left a clear mark on financial data. XEMC (Xiangtan Electric Manufacturing Co., Ltd., SHA: 600416, "Xiangtan") saw its motor segment revenue reach RMB 2.913 billion in 2025, up 16.8% year-on-year, but under the double squeeze of raw material costs and price competition, gross margin fell to 7.97%; the company's net profit attributable to shareholders fell 9.72% year-on-year, and after stripping out non-recurring gains and losses, profit was only RMB 7.47 million — "revenue up, profit not" is a real portrait faced broadly by motor companies during this upward cycle in raw material costs. Response measures visible across the industry include embedding copper-price-linked clauses in contracts, substituting aluminum for copper in material design, and reducing precious-metal use per unit through brushless conversion, but most of these are buffers rather than cures, and cost pressure will keep recurring with the commodity cycle. It is worth noting that this round of squeeze does not hit every company equally: companies with overseas bases that can source locally or lock in long-term supply agreements have significantly more room to buffer than small and medium-sized manufacturers dependent on spot-market purchasing; the latter typically have the weakest bargaining power during windows of rapid raw material price increases, and are also the most likely to be forced into a choice between raising prices and losing orders.
10.2 Low-End Involution: Homogeneous Competition in Standard Motors
Standard motors — especially small and medium-sized induction motors — have a low technical threshold and highly homogeneous products, making this segment where the motor industry's "involution" pressure concentrates most heavily. By the sample statistics of CEEIA's Small and Medium-sized Motor Branch, total profit among sample enterprises fell 8.3% year-on-year in 2024, with a loss-making share reaching 13.8% — in a segment marked by low-end overcapacity and intense price competition, nearly one in seven enterprises was operating at a loss (see Chapter 4's market operating data for detail; not repeated here).
Worth noting: the "anti-involution" governance now broadly promoted across manufacturing covers multiple areas facing overcapacity problems — it is a cross-industry policy orientation, not a motor-industry-specific measure. But its governing logic — correcting underpriced competitive selling and curbing the blind expansion of homogeneous capacity — applies equally to the standard motor segment, since underpriced competitive selling, trading profit for market share, is exactly the long-standing industry inertia that standard motors have displayed.
Standing in sharp contrast to low-end involution is the other end of structural upgrading within the same industry: over the same period, output of Class-2-and-above efficiency products grew 40.3% year-on-year, and Class-1 efficiency products grew 112%. Within the same industry, standard products are mired in price wars while high-efficiency products are growing explosively — this divergence is itself the most direct evidence of involution pressure: enterprises that cannot switch tracks through technical upgrading are, in all likelihood, headed for the fate of being swallowed by the loss-making segment while stuck in the homogeneous red ocean.
The reason the standard motor track continues to draw in capacity comes down to its low barriers to entry, generic equipment, and mature processes — there is almost no technical moat. Once this kind of capacity is built, it is very hard to exit — depreciation is not yet finished, order inertia persists, and even once per-unit profit has been squeezed to razor-thin levels, enterprises still tend to keep running to spread fixed costs, which further worsens low-price supply. This path dependency of "staying put even while knowing profit is razor-thin" is the core reason standard-motor involution is unlikely to self-clear in the short term, and the practical basis for why external policy intervention is needed.
10.3 The Cost Burden on Small and Medium Manufacturers from Mandatory Efficiency Upgrades
China's motor efficiency standards are in a phase of continuous tightening. GB 18613-2020 set IE3 as the mandatory floor starting June 1, 2021 — motors that fail to reach IE3 may not be produced or sold — with IE4 as the energy-saving evaluation value and IE5 as the highest class; GB 30253-2024 and GB 30254-2024, targeting permanent magnet synchronous motors and high-voltage motors respectively, took effect October 1, 2025, laying the standards foundation for the motor industry's entry into the "IE5 era." The Implementation Plan for High-Quality Development of Energy-Saving Equipment (2026–2028), issued in March 2026 by the Ministry of Industry and Information Technology and three other departments, further places energy-saving motors first among six categories of key equipment, explicitly targeting a 35% share of newly added energy-saving motors and an in-service share above 15% by 2028.
Standard turnover poses a genuine cost hurdle for small and medium-sized motor makers: according to overview sources, the cost pressure brought by efficiency retrofits runs about 10% to 15%, while retrofit investment amounts to roughly 25% to 50% of the cost of purchasing a new motor, with a payback period of about 1 to 2 years. Local subsidies do exist — Class-1 efficiency equipment subsidies do not exceed 20% of investment amount, and some regions offer subsidies of RMB 45 to 120 per kW for Class-1 efficiency motors, with considerable regional variation — but subsidy coverage and intensity are not uniform and cannot fully offset small and medium-sized manufacturers' retrofit spending.
The transmission mechanism works like this: unlike market competition, which leaves enterprises room to wait and see, a mandatory standard sets a hard threshold — fail to meet it, and you are out. Large-scale enterprises can spread retrofit costs across a bigger production base and more easily secure bank credit to support technical upgrades; small and medium-sized manufacturers have limited bargaining power against a fixed retrofit investment, and enterprises with already-tight cash flow may be forced to choose between suspending production for retrofitting and exiting the market altogether. In other words, while raising the industry's overall efficiency level, efficiency turnover is also, objectively, playing the role of a capacity-clearing mechanism — a key part of understanding how standards upgrades affect industry structure.
The staged effective-date schedule of mandatory standards is itself a unique kind of risk amplifier: the closer the transition period gets to its deadline, the narrower the choices become for small and medium-sized manufacturers that have not yet completed their upgrade — either rush the retrofit investment and bear higher financial pressure, or give up part of the market and hand orders to competitors who have already upgraded. This kind of time-window hard constraint differs from the sustained, gradual cost squeeze of copper or rare-earth prices — the pressure release is more concentrated and less reversible, and its impact on cash-strapped small and medium-sized enterprises is more direct.
10.4 Regulatory Divergence Barriers in Export Markets
China's motor exports now face the compliance complexity created by opposite regulatory directions in the two largest markets, Europe and the United States. The EU (European Union) Ecodesign Regulation (EU) 2019/1781 expanded mandatory IE3 coverage starting July 1, 2021, and starting July 1, 2023, made IE4 mandatory for motors in the 75kW-to-200kW power range — a full efficiency class above China's own mandatory IE3 floor. This means product lines destined for the EU market must be designed and produced separately to a higher efficiency standard and cannot simply reuse standard lines built for the domestic market; the resulting extra investment in winding processes, material selection, and testing and certification constitutes real export compliance cost.
In contrast to the EU's continued tightening is the reversal in the US regulatory path. The US Department of Energy had originally calculated that its new motor efficiency rule would save society $56 billion in electricity costs over 30 years, but the rule was formally withdrawn by the Trump administration in March 2025. It should be noted that US regulatory policy has been changing quickly, and the state of affairs described in this section reflects the point in time when the research was conducted, with the possibility of further adjustment. With the EU tightening unilaterally and US policy reversing, the efficiency regulatory paths of the two markets have, in effect, diverged.
The transmission mechanism plays out on two levels: first, enterprises exporting motors to the EU must bear higher compliance costs than in the domestic market, and this cost gap will very likely widen further as EU standards continue to tighten; second, product-standard investment aimed at the US market faces the risk of being made early only to potentially come to nothing, owing to policy uncertainty. Enterprises find it hard to cover two regulatory environments moving in opposite directions with a single product platform, structurally raising both the complexity of export deployment and compliance costs.
A deeper layer of risk lies in the fact that the standards themselves are still moving. Over the past decade-plus, EU efficiency thresholds have continued to tighten, expanding from IE3 to mandatory IE4, and the possibility of an eventual extension to IE5 has not gone away; meanwhile US policy direction has swung between two administrations. Enterprises exporting to the EU need to plan their production lines around the certainty of "continued tightening," while enterprises exporting to the US find it hard to judge whether their investments will be rendered moot by another policy reversal — this stacking of two entirely different kinds of uncertainty makes medium-to-long-term capacity planning particularly thorny for export-oriented motor enterprises.
10.5 Price-War Transmission from New Energy Electric Drive
Price competition at the new energy vehicle assembly end is transmitting up the supply chain to the motor segment. According to publicly available industry information, since 2024 more than 60 passenger vehicle models in the domestic market have publicly announced price cuts, generally exceeding 20%, while for a time only a single-digit number of automakers were able to turn a profit for the full year — this is a whole-vehicle-industry figure, not a motor-industry-specific statistic. The profit margin squeezed out of vehicle makers in the terminal price war will almost inevitably transmit upstream to component suppliers, and drive motors and motor control systems, as one of the most core components of new energy vehicles, bear the brunt.
The transmission mechanism shows up as a continuous narrowing of e-drive suppliers' bargaining room: vehicle makers hold stronger leverage in procurement negotiations and tend to push annual cost-reduction targets directly onto e-drive suppliers; with e-drive products already reaching mature process levels and industry capacity relatively ample, suppliers find it hard to counter price-cut pressure with differentiated premiums. It should be stated honestly that there is currently no independent, authoritative statistic on the loss-making share of the e-drive industry — the full trajectory of third-party e-drive suppliers moving from sustained losses to breakeven has already been presented with specific examples in Chapter 8 of this report and is not repeated here. What can be established is this conclusion: price-war pressure has already transmitted upward along the chain from vehicle maker to e-drive supplier, and profitability at the e-drive segment will likely remain under pressure in the near term.
This round of transmission also carries an easily overlooked consequence — in order to hold onto vehicle-maker customer orders, e-drive suppliers often have little choice but to accept quotes below a reasonable level, then maintain nominal profit by squeezing their own supply chain and delaying equipment investment. If this practice of trading long-term R&D and capacity investment for short-term orders continues too long, it may in turn weaken suppliers' competitiveness on next-generation technology platforms (such as higher-integration multi-in-one e-drive units or higher-voltage platforms), forming a chain reaction in which the price war squeezes current profit and then drags down future technology investment.
10.6 The Risk of Unmet Expectations in Humanoid Robots
Humanoid robots are viewed as the motor industry's next high-value-add stage, but a clear temperature gap exists between market reality and the capital-market narrative. The gap between production and shipment volumes is the first signal: actual global humanoid robot shipments in 2024 were about 12,000 units; industry leader Tesla set a target of 5,000 units for 2025, but actual deliveries came to only a few hundred — the huge gap between target and actual result shows that scaling up production is far harder than demonstrating a prototype.
The second signal lies in the fragility of the market-size figures themselves. Frameless torque motors are one of the core components in humanoid robot joints; China's market for them was worth about RMB 180 million in 2023 and about RMB 209 million in 2024, corroborated by two independent sources — the real-world foundation underpinning the narrative of a "hundred-billion-RMB humanoid robot market" is, for now, still a business on the order of a couple hundred million RMB. At the same time, different institutions' forecasts for the 2030 market size contradict each other and differ by several times over — some optimistic forecasts run as high as several hundred billion RMB, while a comparatively conservative estimate puts 2030 shipment volume at only about 38,000 units — and any set of forecast figures cited should note the specific institution and statistical basis, or it becomes very easy to mistake a forecast for an accomplished fact. A similar gap has also shown up in motor makers' own business expectations — institutions once issued profit forecasts of nearly 80% growth for a related manufacturer's robotics business, which ultimately did not materialize, another footnote to the disconnect between hyped expectations and operating reality.
The third risk is that mass-production consistency has not yet been validated. The frameless torque motors used in humanoid robot joints and the coreless motors used in dexterous hands remain, for the most part, at the stage of small-batch sampling paired with prototype iteration; the process gap between lab-level single-unit delivery and the consistency, yield, and cost-curve requirements of scaled mass production has not yet been fully crossed by any manufacturer. Before the three links of production ramp-up, yield validation, and cost curve have all been proven out, linearly extrapolating today's motor procurement scale straight into a hundred-billion-RMB market is, in essence, treating a forecast as an accomplished fact — precisely the risk this section means to flag.
For suppliers who have already positioned capacity ahead of demand for joint motors and dexterous-hand motors, this temperature gap also implies real operating risk: dedicated production lines built and staff and equipment reserved ahead of time to capture anticipated ramp-up demand will, if the downstream integrator's mass-production pace lags expectations by even a year or two, turn into idle capacity and depreciation pressure. In other words, humanoid robot motors are simultaneously the motor industry's highest-priced, most imagination-stretching new stage and the segment where current risk awareness is least mature and most prone to a mismatch between expectation and reality — the pace of demand-side validation deserves more attention than the pace of the capital-market narrative.
10.7 Payment-Term and Cash-Flow Pressure
Motor manufacturers — especially drive-motor makers deeply embedded in the new energy vehicle supply chain — also face cash-flow pressure from lengthening downstream payment terms. According to automotive industry figures, average payment terms across the whole-vehicle supply chain run as long as 121 days; starting in June 2025, a new 60-day payment rule began to be rolled out, with 17 automakers having publicly committed to implementing it — this is a whole-vehicle-industry-chain figure, not a motor-industry-specific statistic.
The transmission mechanism works as follows: motor and motor-controller makers mostly need to purchase copper, rare-earth magnetic materials, and other raw materials in advance and front the production costs, while collection cycles are constrained by downstream vehicle makers' payment-term arrangements — the longer the payment term, the greater the working-capital pressure enterprises bear during a period of rising raw material costs, and small and medium-sized suppliers in particular are prone to cash-flow strain caught in the time gap between fronting production costs and collecting payment. The direction of the new 60-day rule is worth watching, but whether it can truly be implemented in practice, how many tiers of component suppliers it will cover, and whether there is room for practices that effectively extend payment terms in disguise all remain to be seen. For the motor industry, payment-term risk stacked with raw material price risk constitutes a double test of enterprises' working-capital management capability.
Long payment terms also indirectly push up enterprises' financing costs: to fill the funding gap between accounts receivable and raw material spending, some small and medium-sized suppliers have little choice but to rely on external financing tools such as note discounting or accounts-receivable factoring to keep operations turning over; the interest and fees involved are, in essence, a transfer of payment-term risk into financial expense, further eroding an already thin net-profit margin. If the new 60-day rule can genuinely compress payment terms, the most direct beneficiaries would be exactly these small and medium-sized motor suppliers that have long relied on external financing to front production costs.
Chapter 11: 2026–2030: Judgments and Projections
Forecasting is an especially dangerous business in the motor industry. As earlier chapters have shown, there is still no clean, unified total figure for "China's motor industry market size (RMB)"; any compound growth rate built on a flawed denominator only compounds the error year over year. So this chapter does not attempt a total-size forecast. It does three things instead: it extends already-observed trend lines forward and explains the basis for the extension; it translates timetables that policy and standards have already fixed in place into a timetable for demand; and for the genuinely uncertain parts, it offers scenarios, each attached to a falsifiable criterion — if a given number shows up, the judgment holds; if a given number shows up instead, the judgment is voided.
Wherever this chapter makes an inference, it is labeled "Institute inference" with its basis stated, and is not mixed in with measured figures from the National Bureau of Statistics or industry associations. This chapter permits citation of named-institution total-size forecasts on only two points: micro and special motors at RMB 233.3 billion in 2026 and RMB 317.4 billion in 2030 (figure relayed via the China Electronic Components Industry Association); and new energy motors and controllers at RMB 492.0 billion by 2030 (Qianzhan Industry Research Institute figure). Apart from these two, this chapter cites no institution's size forecast — every figure that appears is either an already-realized measured value or is explicitly marked as an "inference."
11.1 Volume Down, Value Up: From "Counting Units" to "Counting Kilowatt-Hours"
Start with the hardest line: production volume. By National Bureau of Statistics figures, AC motor output peaked at 405.018 million kW in 2021, followed by 368.125 million kW in 2023, about 353.217 million kW in 2024, and 349.885 million kW in 2025, with year-on-year declines of 14.25%, 4.7%, and 0.5% respectively. From the 2021 peak to 2025, cumulative shrinkage over four years came to about 13.6% (Institute calculation based on the two endpoint values). It should be noted that the above series is drawn from third-party compilations of Bureau of Statistics data, with roughly a 1% discrepancy in sourcing basis across years — reliable for reading the trend, not for parsing decimal points.
What is interesting is not the decline itself, but the shape of the decline: the rate of decline converged over four years from double digits down to nearly zero. The Institute infers that output measured in 10,000-kW units will bottom out and flatten around 2026, and that 2026–2030 will most likely trace a low-slope flat line rather than a new upward cycle. This rests on three grounds: first, the convergence pattern of the decline rate itself; second, pumps, fans, and compressors — the "big three" plus home appliances that underpin the overall production base — have all entered a phase of stock replacement, where the elasticity of newly added installed capacity is far weaker than it was twenty years ago; and third, efficiency upgrading is almost insensitive to the production-volume measure — an IE5 motor and an IE3 motor of the same power register as the identical number on the "10,000-kW" ledger, meaning none of the value created by efficiency gains registers in the production-volume figures. Falsification criterion: if production volume by Bureau of Statistics figures returns to double-digit decline in any year, the bottoming-out judgment is voided and the industry enters a second round of capacity clearance.
Over the same period, revenue and profit are following a different path. In the first three quarters of 2025, the 3,802 above-scale motor enterprises saw revenue grow 19.6% and profit grow 22.8%, both higher than the overall levels for the machinery industry and national industry as a whole; meanwhile 2025 full-year national production volume was -0.5%. This twenty-percentage-point scissors gap is the whole substance of "volume down, value up." CEEIA's Small and Medium-sized Motor Branch's 58 sample enterprises give a more granular slice: in the first three quarters of 2025, production volume was 202.005 million kW, up 4.7%; sales revenue was RMB 56.0 billion, up 4.2%; and profit was RMB 3.36 billion, up 10.3% — profit growth running two and a half times revenue growth.
There is a discrepancy worth flagging buried between the two data sources: the Branch sample's production volume is up 4.7% while national production volume is down 0.5%. The Institute infers that the incremental growth is concentrated among leading sample enterprises while small and medium-sized manufacturers are net-exiting — the industry is undergoing a round of consolidation not yet backed by statistical data. It is described as unbacked precisely because the motor industry still lacks a properly defined concentration-ratio statistic; the various circulating versions of CR5 and CR10 all trace back to unclear sourcing. The only corroborating evidence available is denominators such as the 3,802 above-scale enterprises and the Branch's 213 member enterprises, along with the 13.8% loss-making share among sample enterprises in 2024.
Where the profit improvement comes from is made clearest by the Branch's 2024 structural data: that year, sample total output was 272.101 million kW, down a slight 0.3%, while output of Class-2-and-above efficiency products was 78 million kW, up 40.3%, and Class-1 efficiency products were 22 million kW, up 112%. The overall pie barely moved while the high-efficiency tier doubled. A caveat on sourcing basis must be added here: the national-level share of "high-efficiency energy-saving motors" in annual output rising from 39% to 73% between 2021 and 2023 is not the same line as the Branch-level share of "Class-2-and-above efficiency products" — the Institute infers that the former corresponds to a general term for output above the mandatory floor, while the latter corresponds to a higher tier; the two figures cannot be directly subtracted from one another, still less stitched together into a single penetration curve.
Putting the three sets of facts together, the industry narrative for 2026–2030 will shift its center of gravity from "how many 10,000-kW units were made" toward "how much each kilowatt sells for, and how many kilowatt-hours it saves the user." A motor's true product is the kilowatt-hours it saves the user over its entire service life; efficiency class, VFD compatibility, permanent-magnetization, and hairpin winding processes are all, in the end, means of selling that saved electricity at a premium. There is only one criterion, and it can already be tracked quarterly: association-level revenue growth staying persistently above production-volume growth. If revenue growth ever falls back below production-volume growth in a given year, or production volume turns positive while revenue turns negative, the "volume down, value up" structural transition is broken, and the industry reverts to pure volume-based competition.
The same test can be applied on the micro and special motor side. Of the two named forecasts permitted for citation, micro and special motors at RMB 233.3 billion in 2026 rising to RMB 317.4 billion in 2030 implies an average annual compound growth rate of about 8% (Institute calculation based on the two endpoint values); meanwhile the Micro Motor Branch's measured 2025 figures put unit output at 16 billion units with output value of about RMB 290 billion. The Institute infers that if unit-count growth in coming years falls below 8%, the micro and special motor segment is likewise on the "volume down, value up" path, driven by brushless motors replacing brushed motors and by a rising share of higher-priced categories such as automotive and robotics applications. Falsification criterion: in the Micro Motor Branch's annual data, if the gap between output-value growth and unit-count growth turns negative, then value upgrading on the micro and special side has not genuinely begun.
11.2 The Policy Calendar Is the Demand Calendar
The motor industry has one advantage other industries can only envy: a substantial share of its demand rhythm has already been written in advance by documents and standards. Lay out the policy calendar for 2026–2030, and most of the demand calendar comes with it.
Two already-realized milestones are firm. First, GB 18613-2020 set IE3 as the mandatory floor starting June 1, 2021 — anything below it may not be produced or sold — with IE4 as the energy-saving evaluation value and IE5 as the highest class; once the floor was raised, every general-purpose motor manufactured after 2021 started from the same line. Second, GB 30253-2024 for permanent magnet synchronous motors and GB 30254-2024 for high-voltage motors took effect October 1, 2025, laying the standards groundwork for the "IE5 era." In other words, 2026 is the first full production year under the new standards system, and any 2026 efficiency-structure data will be this standards system's first report card.
The milestone ahead is the Implementation Plan for High-Quality Development of Energy-Saving Equipment (2026–2028). Issued by the Ministry of Industry and Information Technology and three other departments in March 2026 (specific document number unverified), it places energy-saving motors first among six categories of key equipment, naming technical directions that include above-Class-1 efficiency, wide-range permanent magnets, magnetic levitation, and direct drive. The quantified target it sets is a 35% share of newly added energy-saving motors and an in-service share above 15% by 2028. A three-year window with a single assessment year — the shape of demand's timing is thereby fixed.
Will such targets fall short? China's efficiency-policy execution has one clean piece of empirical evidence. The Motor Energy Efficiency Improvement Plan (2021–2023) targeted high-efficiency motor output of 170 million kW, an in-service share of 20%, and annual power savings of 49 billion kWh; actual results were output of 92 million → 167 million → 179 million kW, an in-service share of 20.2%, and annual power savings of 62.7 billion kWh — all three targets exceeded. Even more notable is the shape of completion: from 92 million to 167 million, nearly doubling in a single year, with the jump occurring in the second year after the plan was issued rather than being spread evenly. As a point of comparison, the earlier 2013–2015 plan set the same 170-million-kW promotion target but left no official acceptance data behind — policy execution capability has only been proven starting with the 2021 round and should not be extrapolated indefinitely backward.
The Institute infers that the 2026–2028 demand pulse will likewise not be evenly distributed but will take a "low-then-high" shape: 2026 will be a digestion year for the standards switchover, with capacity, tooling, certification, and channel inventory all needing to be replaced; from the second half of 2027 through 2028, as the assessment year approaches, local subsidy catalogs, government procurement, and state-owned enterprise tender efficiency thresholds will likely tighten in a concentrated wave, producing a second-half acceleration. The basis for this is the shape of the 2021–2023 jump curve, plus the existing configuration of fiscal tools — the roughly RMB 300 billion in ultra-long-term special treasury bonds within the equipment-renewal pool is an economy-wide figure, of which Class-1 efficiency equipment subsidies do not exceed 20% of investment amount, and local subsidies for Class-1 efficiency motors fall in a range of RMB 45 to 120 per kW, with considerable regional variation.
An even more critical layer of inference concerns the shifting battlefield. There is not much room left on the newly added side: high-efficiency energy-saving motors already make up 73% of annual output, and finishing off the remaining twenty-odd percent runs into diminishing marginal returns; while the in-service share stood at only 20.2% as of 2023 — within a massive in-service stock of about 3.27 billion kW, close to eighty percent is still old motors. The Institute infers that the main battlefield of the 2026–2030 motor efficiency market will shift from "new-motor shipments" to "in-service stock replacement," and the decision-maker for stock replacement is the factory owner using the electricity, not the motor manufacturer — a longer transmission chain, more dependent on the arithmetic of electricity prices, subsidy catalogs, and retrofit payback periods. That arithmetic currently pencils out favorably: the cost pressure from efficiency retrofits for small and medium-sized manufacturers runs about 10–15%, retrofit investment amounts to roughly 25–50% of the cost of a new motor, and payback runs 1–2 years. Two falsification criteria apply: first, if the high-efficiency energy-saving motor share of annual output stalls near 73% in 2026–2027 while Class-1 efficiency product growth falls back from triple digits to single digits, it signals policy-to-demand transmission is weakening; second, if the local subsidy catalog of RMB 45–120 per kW broadly steps down before 2027, the "second-half acceleration" judgment needs to be revised downward.
11.3 Regulatory Fork: Europe's High-End Push and the Americas' Low-Price Window
On the export side, 2026–2030 presents a situation never seen before: European and American efficiency regulation are going their separate ways.
The EU's direction is upward. EU Regulation (EU) 2019/1781 expanded mandatory IE3 coverage starting July 1, 2021, and made IE4 mandatory for 75–200kW models starting July 1, 2023 — a full class above China's IE3 floor. For Chinese exporters, that extra class is not a technology problem but a compliance-cost problem — certification, testing, ecodesign information disclosure, and supply-chain traceability all have to be amortized into per-unit cost. The US direction, meanwhile, reversed in March 2025: the US Department of Energy's originally planned motor efficiency rule, which had been calculated to save users $56 billion in electricity costs over 30 years, was withdrawn. US policy is changing quickly at present; this section states only what has already occurred, as of the time this report was researched.
The Institute infers that the two markets now require two different playbooks, not a single product line covering both.
- For Europe: compliance is the ticket to entry. Efficiency class is not a selling point but an admission requirement; competition returns to delivery lead time, local service networks, and VFD and systems-integration capability. The right posture for Chinese manufacturers here is to build out IE4/IE5 product lines in depth and localize certification and after-sales service — price is no longer the primary variable.
- For the US: the withdrawal of the threshold means mid-to-low-efficiency, lower-priced products will still find a market for a while, but the real variable has shifted to tariffs and rules of origin. The playbook here is not efficiency upgrading but capacity footprint — where manufacturing is located matters more to success than which efficiency class is achieved.
There is corporate behavior corroborating this inference. Wolong Electric Group Co., Ltd. (SHA: 600580, "Wolong Electric") built its first self-owned overseas factory in Haiphong, Vietnam, in 2018, with about 80% of its supply to the Americas coming from a plant in Monterrey, Mexico (this figure comes from an investment-advisory-type source and should be used with caution); meanwhile figures from the China Chamber of Commerce for Import and Export of Machinery and Electronic Products show motor product exports of $6.35 billion in the first five months of 2024, a slight increase of 1.6%, with the largest destinations being Mexico and Vietnam. The Institute infers that the geographic center of gravity of exports is shifting from "China direct-to-end-market" toward a two-stage pattern of "China–third location–end market," and that customs-basis finished-motor export figures will find it increasingly difficult to fully reflect the true overseas share of China's motor industry.
The criterion to watch is the divergence in per-unit export value to Europe versus the US: under the same HS code, per-unit value to Europe should keep rising (as the share of IE4-and-above rises), while per-unit value to the US should hold flat or decline (given the continuing window for lower-efficiency, lower-priced models). This criterion needs one control variable applied: international copper prices had already risen for seven consecutive months into 2026, breaking through $14,500 per tonne, with domestic futures breaking through RMB 106,000 per tonne, and standard motors have generally repriced 10–20% higher as a result — all export unit prices will be lifted in the same direction by copper prices. What matters, then, is not the absolute unit price but the direction of the gap between the two destinations' unit prices. If unit prices at both destinations move in the same direction by a similar magnitude, it means the divergence has not yet shown up in prices, and the driving factor is copper prices and exchange rates rather than regulatory divergence — this section's judgment would need to be rethought from scratch.
Customs data broken down by product category hints at another layer of structure. In the first three quarters of 2025, large-motor exports reached RMB 4.96 billion, a surge of 64.0%, small and medium-motor exports reached RMB 65.38 billion, up 7.8%, and micro-motor exports reached RMB 18.92 billion. The Institute infers that the 64.0% growth in large motors, moving in the same direction as the 56.0% growth in generator (including wind power) output over the same period, points to the capital-expenditure cycle of overseas power and new energy infrastructure, and has little to do with motor efficiency turnover itself; the 7.8% figure for small and medium-sized motors is the true body temperature of general industrial exports. The two lines should not be conflated when making export judgments.
11.4 A Layered Projection for Three New Stages
The story of the old motor is efficiency; the story of the new motor is three stages: vehicles, robots, and automation. The maturity of these three stages differs by a full order of magnitude and must be examined in layers.
11.4.1 Electric Drive: Already Mainstream, the Profit Inflection Has Just Arrived
By scale, this is long past being an emerging category. In 2024, installed e-drive systems for China's new energy passenger vehicles reached 7.758 million units, up 41.72%; automaker-affiliated BYD's electric-drive arm FinDreams Powertrain led with about a 31.7% share (figure for the January–November 2024 period), while United Automotive Electronic Systems (a subsidiary of Inovance Technology) led the third-party camp (about an 11% share of the motor controller market in the first half of 2024, with revenue of RMB 10.4 billion in the first three quarters of 2024, up 96%, and a planned IPO fundraising of RMB 4.86 billion). Technology routes have also converged: hairpin windings, oil cooling, and multi-in-one integration have become standard, with 800V penetration at about 13% in 2025. One of the two named forecasts permitted for citation — new energy motors and controllers reaching RMB 492.0 billion by 2030 (Qianzhan figure) — describes precisely this stage's ceiling.
The real news is profit. 2025 saw a rare, synchronized turn: Jing-Jin Electric Technologies Co., Ltd. (SHA: 688280, "Jing-Jin Electric") posted revenue of RMB 2.729 billion, up 109.11%, and net profit of RMB 150 million, its first full-year profit since listing (it had lost RMB 436 million in 2024, and gross margin had once fallen as low as -3.84% in the first half of 2022); Zhejiang Founder Motor Co., Ltd. (SZE: 002196, "Founder Motor") posted revenue of RMB 2.915 billion, up 17.82%, with net profit of RMB 21.01 million turning it profitable, cumulative drive-motor shipments surpassing 4 million units across nearly 50 vehicle models supported (compared with cumulative shipments of nearly 2.6 million units at the end of 2023, when it was still unprofitable); Zhuhai Enpower Electric Co., Ltd. (SZE: 300681) posted revenue of RMB 3.874 billion, up 59.45%, with net profit of RMB 186 million, up 161.62%. The Institute infers that 2025 is very likely the inaugural year of profitability for third-party e-drive, triggered by cumulative shipments crossing the threshold of economies of scale, compounded by yield and material-utilization improvements as hairpin-winding and oil-cooling processes matured.
But the inflection is fragile. Based on the public figures above, net margins across the three companies fall broadly in a range of under 1% to a bit above 5% (Institute calculation); a single price war, one upward move in copper prices, or one major customer's annual price-cut clause could be enough to wipe it out. The reference case is right at hand: Nidec was the pioneer that put an e-Axle into mass production back in 2019, but subsequently booked about JPY 59.8 billion in restructuring charges, followed by another JPY 87.7 billion in losses, and ultimately announced in May 2026 the dissolution of its China-Europe joint venture and exit from the business — even a top-tier global player has struggled here. Two criteria apply: first, the segment gross margin and operating cash flow that United Automotive Electronic Systems will disclose after its IPO will be the first public answer to whether third-party e-drive can be durably profitable; second, the durability of Jing-Jin Electric's profitability, in particular whether it can post a second consecutive year of profit in 2026 on a non-recurring-adjusted basis. Falsification criterion: if two of the three companies above fall back into losses in 2026, the "inaugural profit year" judgment is voided, and the industry returns to its old cycle of rising installations without rising profit.
On structure, the Institute infers that 2026–2030 will trend toward "concentration at both ends": the share held by automaker-affiliated in-house supply will be passively lifted as sales concentrate among leading automakers; within the third-party camp, only a handful of companies that have won design-in with multiple automaker platforms and crossed the breakeven scale threshold will survive — small and medium-sized third parties will either be acquired or retreat into niche battlegrounds such as commercial vehicles and off-road machinery. The basis for this is that the intensity of the price war has already forced out one global giant, and the time window left for undersized players will not be any longer.
11.4.2 Humanoid Robot Motors: A RMB 200-Million Starting Point, Three Scenarios
This is the stage with the loudest narrative and the smallest actual results. China's market for frameless torque motors was worth RMB 180 million in 2023 and RMB 209 million in 2024, corroborated by two independent sources; collaborative robots contribute about seventy percent of demand within it, with a single collaborative robot using 5–7 units. In other words, the category repeatedly called "the priciest stage for motors" is, for now, still a business on the order of RMB 200 million a year — and the bulk of it is not even humanoid robots.
The scale of the gap can be shown with a single multiplication. Global humanoid robot shipments actually reached about 12,000 units in 2024; at the projected rate of about 40 motors per unit (a forecast basis, not a measured one), that corresponds to about 480,000 motors for the full year — barely a rounding error within a micro-motor industry that produces 16 billion units a year. Tesla targeted 5,000 units in 2025 and actually delivered only a few hundred; results at the listed-company level are equally sobering: Wolong Electric's 2025 robotics-component revenue was RMB 516 million, up 14.13%, but only 3.34% of total revenue; Shenzhen Zhaowei Machinery & Electronics Co., Ltd.'s (SZE: 003021) dexterous-hand revenue in the first three quarters of 2025 was RMB 15.53 million, 1.2% of the total; Shanghai Moons' Electric Co., Ltd.'s (SHA: 603728) robotics-segment revenue grew 22%, yet full-year net profit fell 21.54%, even as institutions had previously forecast net profit growth of 79% to RMB 139 million. This gap between institutional forecast and company results is the sharpest fact in this section.
More troublesome still, various institutions' forecasts for this track's 2030 scale are mutually contradictory — even different versions issued by the same institution over time fail to line up — and picking any one version at random as a basis amounts to treating a forecast as fact. The Institute's approach is to cite no total-size forecast at all, and instead run a scenario projection using trackable threshold values. The scope is unified as "China's combined market for frameless torque motors and coreless motors used in humanoid robots," excluding existing demand from collaborative robots, medical devices, power tools, and the like.
- Realization scenario: this scope surpasses RMB 1 billion in 2027 — roughly a fivefold jump from the roughly RMB 200-million starting point in 2024, implying integrator shipments entering the hundred-thousand-unit range or a marked rise in per-unit motor value. If this holds, motor makers' robotics business would, for the first time, qualify as a "pillar."
- Delay scenario: this scope remains below RMB 500 million in 2027. Narrative realization has to wait another cycle, and capital expenditure around robot motors during this period should be recalculated against the real pace of collaborative robots — the structure in which collaborative robots contribute seventy percent of demand is unlikely to change in the short term.
- Middle scenario: falling between RMB 500 million and RMB 1 billion. Industrialization is indeed progressing, but more slowly than the expectations priced into share valuations imply, and listed companies' robotics-related revenue share remains stuck below 5% — still hovering around the levels seen at Wolong (3.34%) and Zhaowei (1.2%).
The Institute infers that the middle scenario has the highest probability. The basis is a mismatch between demand and supply sides: integrators' joint designs are still iterating (the same company's product went from 28 joint actuators to 37 joints, with 17 actuators in a single hand); with the design not yet frozen, motor makers cannot secure long-cycle, large-volume design wins, and without those wins, motor makers will not build a dedicated production line for it. Within today's coreless-motor market, the overwhelming majority is still existing demand from medical devices, power tools, and the like, with humanoid robots forming only a very thin layer (Institute inference, based on the analogous structure in which collaborative robots make up about seventy percent of frameless torque motor demand). The shared criteria for these three scenarios are three publicly trackable data points: the annual market size of frameless torque motors and coreless motors, the robotics-business revenue share disclosed in listed companies' segment reporting, and the quarter-on-quarter trends at Moons' Electric and Zhaowei Machinery.
11.4.3 Servo Localization: Past the Halfway Mark in Sight, but Which "Half" Matters
Servo is the closest of the three stages to a tipping point. The most reliable share figure comes from MIR Databank: China's domestically made share of general-purpose servo systems reached 49.79% in 2022, just one step short of the halfway mark. The Institute infers that the domestic share of general-purpose servo systems settling above 50% during 2026–2030 is a high-probability event, with the criterion being MIR's annual share report — confirmation requires staying above 50% for two consecutive years; a single year crossing the line does not count.
But the substance of "past halfway" needs to be checked against another figure. The domestic-make share of servo motors as a standalone component exceeded 32% in 2023 (GGII figure) — a gap of seventeen to eighteen percentage points from the near-fifty-percent share held by general-purpose servo systems. The two figures are not contradictory; they describe two different positions in the industry chain: domestic substitution has moved in first at the drives, controllers, and overall solutions, where the threshold is algorithms and engineering support, while the threshold for the motor body itself is encoders, precision machining, and batch-to-batch consistency — a harder nut to crack. Japanese and German manufacturers' dominance in servo is built mainly on this motor-body segment.
The Institute infers that for 2026–2030, the key indicator for gauging the real substance of servo localization is not system-level share but whether motor-body localization can rise in step with it. Falsification criterion: if the GGII-basis standalone-motor domestic share is still stuck a bit above 30% in 2026–2027 while system-level share has already passed the halfway mark, it means domestic substitution has stalled at the integration layer, and the motor body is still an imported component — "past halfway" would then only be a figure on paper.
11.5 The WEG Lesson: Can Chinese Manufacturers Walk the Brazilian Path?
The global low-voltage motor market changed hands in 2025: Brazil's WEG, with a 16% share, overtook ABB's 15.5% for the first time to claim the top spot (Omdia figure). A company founded in southern Brazil in 1961 has, over more than sixty years, built out 67 industrial parks worldwide, about 48,000 employees, annual output of more than 19 million motors, and FY2025 net revenue of BRL 40.8 billion — pushing a venerable European giant off the top of the low-voltage motor throne. For Chinese motor manufacturers, WEG is a mirror more worth looking into than ABB or Siemens — because it too rose from an emerging market and did not build its success on brand premium.
Broken down, WEG's rise to the top rests on three things: acquisition, cost, and emerging markets. Acquisition was the final push — completing the roughly $400 million acquisition of Regal Rexnord's industrial motor business in April 2024 was an important driver behind overtaking the leader on share; cost is the chassis — low-cost local manufacturing combined with a high degree of vertical integration, with 67 industrial parks bringing a large share of processes in-house; emerging markets was the path chosen — rather than colliding head-on with ABB and Siemens in Europe's high-end market, WEG built volume starting from Latin America, Africa, and Southeast Asia, only turning back to enter developed markets once it had built sufficient scale.
Wolong Electric's path closely resembles WEG's. On acquisitions, it acquired Austria's ATB (Europe's third-largest motor maker) for about €101 million in 2011 and General Electric's low-to-medium-voltage industrial motor business for $160 million in 2018, and has also taken Italy's SIR and OLI vibration-motor businesses; on cost, beyond its domestic supply chain, it has established overseas bases in Haiphong, Vietnam, and Monterrey, Mexico; on emerging markets, overseas revenue already accounts for 41% of total revenue. The financials are also starting to signal that integration is paying off: 2025 revenue was RMB 15.454 billion, down 4.88% (up 2.59% excluding the effect of divestitures), net profit attributable to shareholders was RMB 1.126 billion, up 42.04%, and gross margin was 25.37% — revenue ceding ground while profit climbs is a classic signature of a converging integration phase.
The Institute infers that the conditions for Chinese manufacturers to replicate WEG's path are mostly already in place, but four obstacles must still be cleared.
- The profitability yardstick still sits on the other side. ABB's Motion segment posted FY2025 revenue of $8.247 billion and an EBITA margin of 19.4%; WEG, meanwhile, has annual output of more than 19 million units underpinning it. Wolong's 25.37% gross margin is a solid starting point, but between gross margin and operating margin lies the integration cost of acquired assets and the management overhead of globalization.
- Channels cannot simply be bought. Low-voltage motors are a business running on both OEM design-in and distributor networks in parallel; the distribution network and service radius WEG built over more than sixty years is not something a single acquisition can buy outright. An acquisition buys plants and orders, but not the replacement inertia built on an installed base.
- The geopolitical window is not symmetric. WEG is a Brazilian company, and the scrutiny it faces when acquiring European or American industrial assets is naturally lighter than what a Chinese company faces. Whether the window that let Wolong acquire General Electric's low-to-medium-voltage industrial motor business in 2018 will remain open long-term is a variable that must be written explicitly into the assumptions.
- Statistical bases cannot be used for self-comfort. By Frost & Sullivan's basis, Wolong is No. 1 globally in explosion-proof e-drive, No. 4 in industrial e-drive, and No. 5 in HVAC; by Omdia's basis, the low-voltage-motor share leaderboard is an entirely different table. The classification boundaries of the two tables differ, and rankings cannot be swapped for each other, still less added together — ranking oneself using whichever basis is most flattering is one of the most common forms of self-deception in industry research.
Criteria to watch: whether Wolong's overseas revenue share can keep rising beyond its current 41%; the gross-margin trajectory once overseas acquisition targets are consolidated; and whether a second billion-RMB-scale overseas capacity or channel acquisition emerges. Falsification criterion: if overseas revenue share pulls back for two consecutive years, and new overseas investment is limited to self-built capacity (the Vietnam model) rather than channel and brand acquisitions, then the "replicating WEG" judgment does not hold — that path is cost relocation, not global integration, and the two lead to entirely different endpoints.
11.6 Watchlist of Indicators
Every judgment in this chapter is falsifiable. For ease of tracking, the criteria scattered across each section are gathered here into a single list, ordered from most to least accessible.
- Monthly AC motor output by Bureau of Statistics basis (10,000 kW): watch whether it turns from negative to flat in 2026. A return to double-digit decline voids the "bottoming and flattening" call.
- The gap between association-sample revenue growth and production-volume growth: staying positive confirms "volume down, value up"; turning negative breaks the structural transition.
- Growth in output of Class-1 and Class-2-and-above efficiency products by Branch basis: a fall from triple digits to single digits is the first sign of weakening policy transmission.
- High-efficiency energy-saving motors' share of annual output (currently 73%) and in-service share (currently 20.2%): if the former stalls and the latter stays flat, it means the battlefield has failed to shift successfully to stock replacement.
- Whether the local Class-1 efficiency motor subsidy catalog (currently RMB 45–120 per kW) continues through the 2028 assessment year: a broad step-down means the "second-half acceleration" call needs to be revised downward.
- The gap in per-unit export value to Europe versus the US by customs basis: watch the direction of the gap, not the absolute value, and strip out the effect of copper prices rising in the same direction for both.
- The divergence between large-motor and small-and-medium-motor export growth rates: large motors track the overseas power-infrastructure cycle, while small-and-medium motors are the true body-temperature gauge of general industry.
- The segment gross margin and operating cash flow United Automotive Electronic Systems discloses post-IPO; whether Jing-Jin Electric can post a second consecutive profitable year on a non-recurring-adjusted basis.
- China's combined market size for frameless torque and coreless motors used in humanoid robots: surpassing RMB 1 billion in 2027 means realization, below RMB 500 million means delay.
- Whether listed companies' robotics-business share of total revenue can break through 5%: currently at 3.34% for Wolong and 1.2% for Zhaowei.
- Whether the MIR-basis domestic share of general-purpose servo systems can stay above 50% for two consecutive years; whether the GGII-basis domestic share of standalone servo motors can break out of the low-thirty-percent range.
- The direction of Wolong's overseas revenue share (currently 41%), and whether a new overseas channel-level acquisition emerges.
- Copper- and rare-earth-price transmission: every $1,000-per-tonne rise in copper price raises new energy drive motor costs by 2–3%; the rare-earth price index rose more than 30% in early 2026 versus the end of 2025, with terbium oxide at RMB 6.4 million per tonne, an 11-year high. What truly matters is the coverage rate of copper-price-linked clauses within orders.
Of these thirteen indicators, the great majority can be obtained directly from public association annual reports, monthly customs data, and listed companies' periodic reports, with no paid database required. That is precisely the reason this chapter avoids a total-size forecast — in an industry that still lacks even a clean statistical basis for market size, a watchlist of judgments that next quarter's data can overturn is more honest than a handsome-looking compound growth rate.
Chapter 12: Conclusions and the Institute's Judgment
If the whole report were reduced to one sentence: the motor is industry's heart — it appears in the name of no product, yet it decides the heartbeat of every product.
Every trait of this industry stems from the four words "ubiquitous and high-volume." Because of its sheer volume, it consumes more than half the world's electricity, and every single percentage point of efficiency improvement is worth one power plant; because it is everywhere, it hides inside every piece of equipment from refrigerators to high-speed trains, yet has left behind no brand a consumer could name. Over a hundred and fifty years, it has made itself the air of the industrial world: everywhere, and noticed by no one. What this report records is precisely the moment this old craft is being noticed again — efficiency regulation set IE3 as an unbreachable floor starting in 2021, high-efficiency motor output share jumped from 39% to 73% in three years, and a quiet, mandatory turnover is redrawing the industry's value curve; at the same time, new energy electric drive is installing nearly eight million units a year, and humanoid robots are fitting motors into finger joints — the most rudimentary energy-saving business and the most expensive precision stage are playing out simultaneously within the same industry.
We have equally presented the other side honestly: production volume has declined for several straight years from its 2021 peak, and the transition to "volume down, value up" has come with real, hard-earned pain — Xiangtan Electric's motor segment saw revenue rise without profit rising, third-party e-drive makers only reached their first annual profit in 2025, and humanoid robot motors, propped up by capital-market narrative into hundred-billion-RMB valuations, were still, last year, only a RMB 200-million business across the whole of China. The global lineup is reshuffling too: Brazil's WEG has claimed the top of low-voltage motors, Nidec has exited its e-drive gamble, and Siemens' motor bloodline has changed hands to private equity — the comings and goings of giants remind us that in this industry, where cost and scale do the talking, no throne lasts forever.
Observing an industry like this, the difficulty has never been at the top — listed companies' filings are public — but on the "everywhere" side: enterprises related to "motors" across the country number in the tens of thousands, from the finished-motor makers of Fu'an in the mountain city, to the pump-supporting suppliers of Wenling, from the stator-and-rotor workshops of Changzhou to the micro-motor assembly lines of Dongguan — who is producing, who is supplying which cluster, and who is only a name in a directory. Tianxia Gongchang's ongoing identification of roughly 4.8 million operating, genuine factories nationwide exists precisely to make this depth visible: following the single word "motor," one can trace a path from a listed leader all the way to the smallest end, a housing-casting workshop, and see clearly the real network of blood supply behind industry's heart.
The Institute's judgment: over the next five years, the story to watch in the motor industry is not production volume returning to its peak — that number belongs to 2021 — but three things: whether efficiency turnover can arrive on schedule per the policy calendar's "35% newly added share" target for 2028 (the previous plan's track record of overdelivering is worth some trust); whether the profit inflection at electric drive can spread from a single company to the industry as a whole; and whether the joints of humanoid robots can turn a RMB 200-million business into a RMB 20-billion one. The heart will never make headlines, but every beat of it is the background hum of Chinese manufacturing.
Data Sources
The data in this report is drawn from public government documents, listed companies' periodic reports, publicly available industry association information, international institution reports, and industry research institution estimates, cross-verified across multiple sources; wherever sourcing bases diverge, the institution and statistical scope have been noted in the text, and any unverified claims are either qualified or not used. Principal sources include:
- Tianxia Gongchang industrial platform — China factory database and industry-chain data
- National Bureau of Statistics (production output of products such as AC motors and generator sets, and operating data for above-scale enterprises)
- Ministry of Industry and Information Technology, State Administration for Market Regulation (efficiency standards GB 18613-2020 and GB 30253-2024, and policy documents such as the Motor Energy Efficiency Improvement Plan (2021–2023) and the 2026–2028 Motor and Transformer Energy Efficiency Improvement Action Plan)
- International Energy Agency (IEA) public reports on electricity consumption and efficiency of motor-driven systems
- China Electrical Equipment Industry Association (CEEIA) and its Small and Medium-sized Motor Branch and Micro Motor Branch — public information and operating data
- Periodic reports (disclosed via the Shanghai and Shenzhen stock exchanges) of listed companies including Wolong Electric Drive, Broad-Ocean Motor, Founder Motor, Moons' Electric, Jiangsu Leili, Zhaowei Machinery, Enpower Electric, Jing-Jin Electric, Jiadian, and Xiangtan Electric
- Annual reports and investor-relations materials of Nidec, ABB, WEG, Siemens, and Innomotics
- NE Times, GGII (Gaogong Industry Institute), and other third-party institutions' installation statistics for electric drive and robotics motors (estimation bases noted in the text)
- Estimates from institutions such as AskCI Consulting (中商产业研究院), Huajing Industry Research Institute (华经产业研究院), Zhiyan Consulting (智研咨询), and Qianzhan Industry Research Institute (前瞻产业研究院) (estimation bases noted in the text)
- General Administration of Customs import/export statistics, and authoritative media reports from People's Daily and Xinhua News Agency